. 2014 Jul 31:5:4511.
doi: 10.1038/ncomms5511.

SOX2 is a cancer-specific regulator of tumour initiating potential in cutaneous squamous cell carcinoma

Affiliations

SOX2 is a cancer-specific regulator of tumour initiating potential in cutaneous squamous cell carcinoma

Jasmin M Siegle et al. Nat Commun. .

Abstract

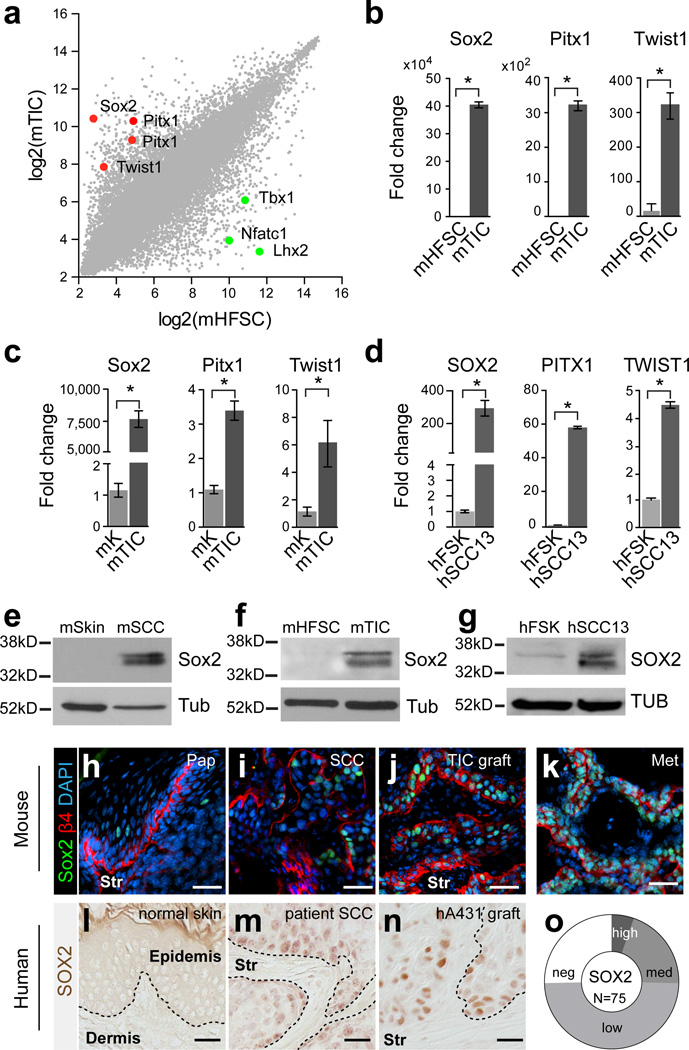
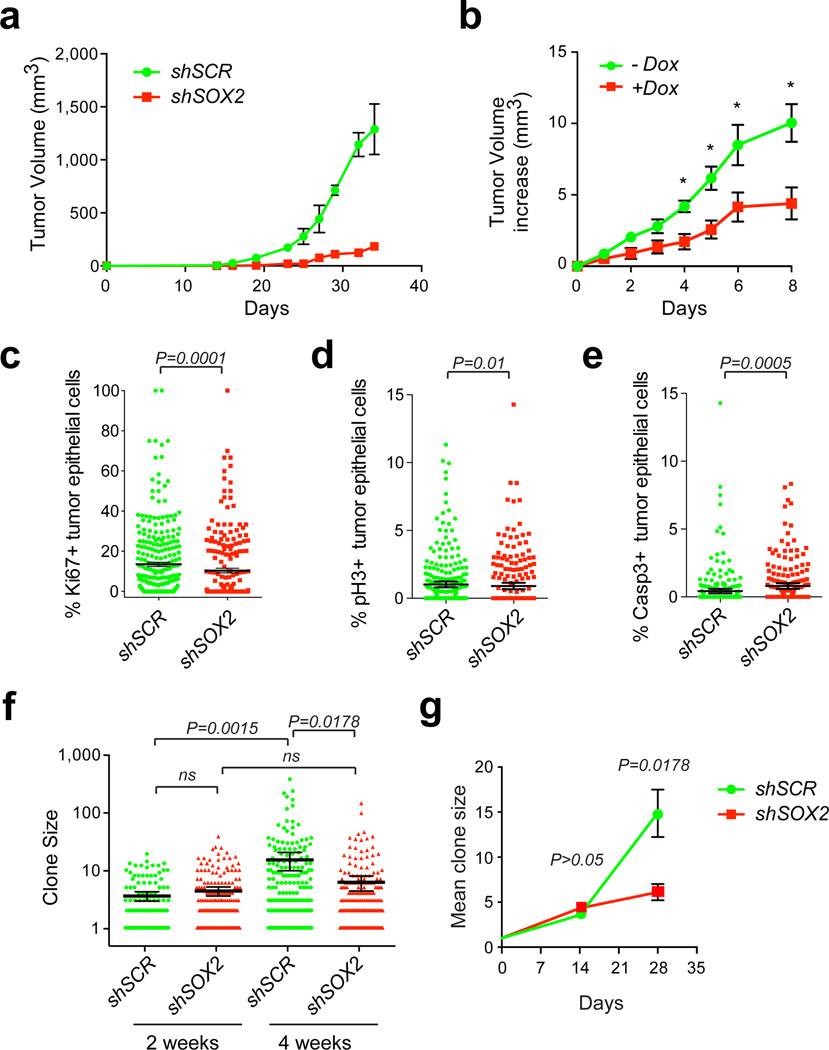
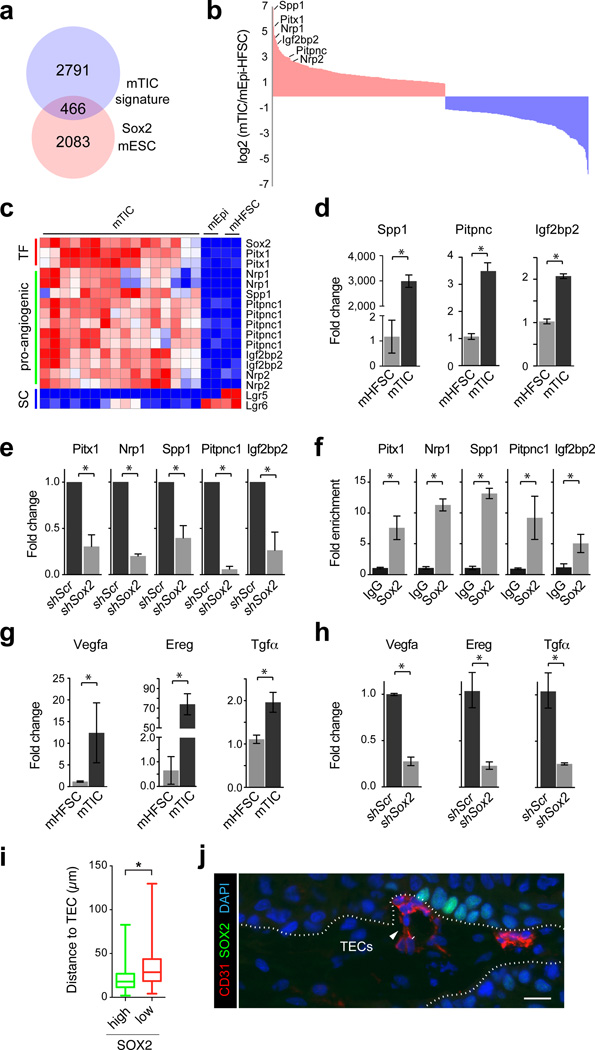
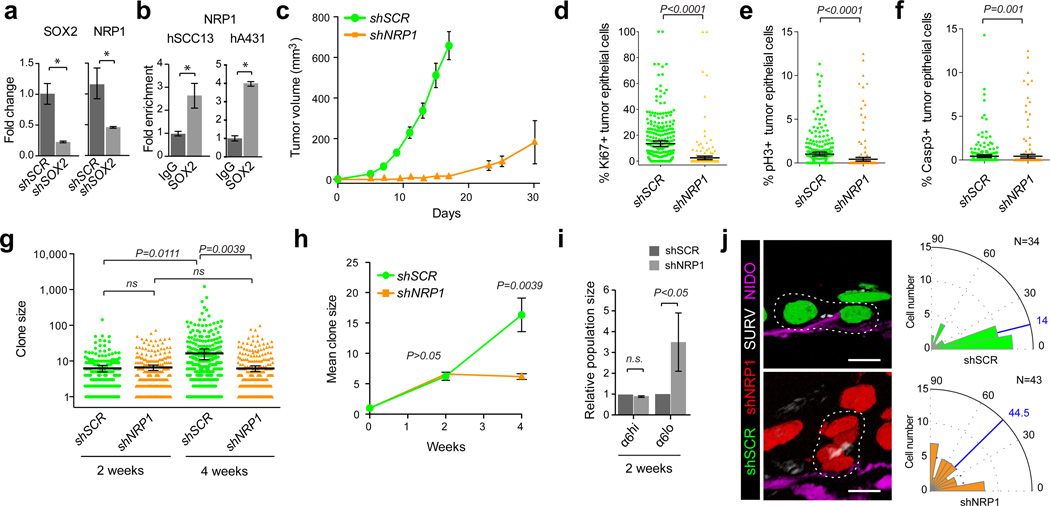
Although the principles that balance stem cell self-renewal and differentiation in normal tissue homeostasis are beginning to emerge, it is still unclear whether cancer cells with tumour initiating potential are similarly governed, or whether they have acquired distinct mechanisms to sustain self-renewal and long-term tumour growth. Here we show that the transcription factor Sox2, which is not expressed in normal skin epithelium and is dispensable for epidermal homeostasis, marks tumour initiating cells (TICs) in cutaneous squamous cell carcinomas (SCCs). We demonstrate that Sox2 is required for SCC growth in mouse and human, where it enhances Nrp1/Vegf signalling to promote the expansion of TICs along the tumour-stroma interface. Our findings suggest that distinct transcriptional programmes govern self-renewal and long-term growth of TICs and normal skin epithelial stem and progenitor cells. These programmes present promising diagnostic markers and targets for cancer-specific therapies.


Figures

Figure 1
Figure 1. SOX2 expression distinguishes TICs from normal skin epithelial cells
(a) Scatter plot illustrating gene expression values of 45,101 transcripts in tumor-initiating cells (TIC) of murine (m) cutaneous squamous cell carcinoma (SCC) compared to hair follicle stem cells (HFSCs). Red and green dots indicate highly enriched transcription factors in mTICs and mHFSCs, respectively. (b) qRT-PCR analyses of Sox2, Pitx1, and Twist1 on RNA from freshly sorted mTICs and mHFSCs. (c) qRT-PCR analysis of Sox2, Pitx1, and Twist1 on RNA from cultured mTICs and mHFSCs. (d) qRT-PCR analysis of SOX2, PITX1, and TWIST1 on RNA from human foreskin (FSK) and SCC13 cultures. (b–d) Data are represented as mean with error bars indicating ± s.d. (n=3, *P<0.05, Student’s t-test). (e–g) Western blot analyses of Sox2 on total protein extracts from mSkin and mSCC (e); cultured mHFSCs and mTIC (f); and human foreskin keratinocyte (FSK) and SCC13 cultures (g). β-Tubulin (Tub) was used as loading control. (h–k) Immunofluorescence microscopy of Sox2 (green) on benign mouse papillomas (h, Pap), primary mouse SCCs (i, SCC), orthotopic TIC transplants (j, TIC graft), and spontaneous lung metastases (k, Met). β4 integrin (red) demarcates the boundary between tumor epithelial cells and underlying stroma (Str). DAPI (blue) labels nuclear chromatin. (l–n) Immunohistochemistry of SOX2 on normal human skin (l), primary human patient SCC (m), and A431 xenograft (n). (o) Donut chart summarizing SOX2 expression analysis on human cutaneous SCC tissue microarray. Nuclear SOX2 staining was detected in 75% of SCCs (56/75) with variable staining intensity (5% strong, 20% medium, 49% weak). (h–n) Scale bars are 50µm.
Figure 2
Figure 2. SOX2 is required for cutaneous SCC initiation and growth
(a) Tumor growth curves of human SCCs infected with lentivirus expressing short hairpin RNA (shRNA) against SOX2 along with nuclear red fluorescent protein (H2B-RFP; shSOX2) or scrambled control shRNA along with nuclear green fluorescent protein (H2B-GFP; shSCR) followed by transplantation onto Nude recipient mice. Data are represented as mean with error bars indicating ± s.e.m. (n=6, *P<0.05, Student’s t-test). (b) Doxycycline-inducible knockdown of SOX2 in established human SCC xenografts. Data are represented as mean with error bars indicating ± s.e.m. (n=10, *P<0.05, Student’s t-test). (c–e) Quantitative analysis of proliferative Ki67 (c), mitotic phospho-Histone H3(Ser10) pH3 (d), and apoptotic activated Caspase-3 (Casp3) (e) positive cells in shSOX2;H2B-RFP or shSCR;H2B-GFP transduced A431 xenografts. Scatter plots illustrate the percentage of infected parenchymal cells that are positive for the respective marker in n>200 microscopic fields. Horizontal bars indicate mean ± 95% CI. (*P<0.05 Mann-Whitney non-parametric t-test). (f–g) Analysis of clonal growth competition assay at 2 and 4 weeks after intradermal transplantation when 1–2% of A431 cells have been transduced with shSOX2;H2B-RFP and shSCR;H2B-GFP (n=6). (f) Scatter plots illustrate clone size distributions. Horizontal lines represent mean with error bars indicating ± 95% CI. (g) Line graphs showing average clone size as a function of time (± s.e.m). (f–g) P values were obtained by Mann-Whitney non-parametric t-tests.
Figure 3
Figure 3. Sox2 promotes the expression of pro-angiogenic factors in tumor-initiating cells
(a) Venn diagram depicting overlap of 466 genes between the mouse TIC signature and a list of direct Sox2 targets in mouse ES cells. (b) Histogram illustrating the relative enrichment of 466 putative Sox2 target genes in mouse TICs compared to skin epithelial stem and progenitor cells. 254 genes are >2 fold upregulated (red) and 212 genes are >2-fold downregulated (blue). Pro-angiogenic molecules and Pitx1 are amongst the highest differentially expressed genes (c) Heat map exemplifying elevated expression of Pitx1 and pro-angiogenic factors, and the suppression of HFSC markers in TICs. d, qRT-PCR analysis of Spp1, Pitpnc, and Igf2bp2 on TIC and HFSC cultures. (e) qRT-PCR analysis of Pitx1 and pro-angiogenic factors on mTIC cultures transduced with shScr or shSox2. (f) qRT-PCR analyses on chromatin samples from cultured mTICs after immunoprecipitation with anti-Sox2 and IgG control antibodies. (g) qRT-PCR analysis of EGF and VEGF signaling pathway components on primary mTICs and mHFSC cultures. (h) qRT-PCR analysis of EGF and VEGF signaling pathway components on mTIC cultures transduced with shScr or shSox2. (d–h) Bar graphs showing mean with error bars indicating ± s.d. (n=3, *P<0.05 Student’s t-test) (i) Box and whisker plots describing measurements of the closest distance between TICs, expressing high or low levels of SOX2, and tumor endothelial cells (TECs). Bar indicates median, box indicates 25 and 75 percentile and whiskers indicate minimum and maximum measurements. (j) Representative image showing high-level SOX2-positive cells (green), TECs (CD31, red) and nuclear chromatin (DAPI, blue). White dotted line indicates tumor-stroma interface. Scale bar indicates 20 µm.
Figure 4
Figure 4. NRP1 expression is regulated by SOX2 and required for SCC growth
(a) qRT-PCR analysis of SOX2 and NRP1 on human SCC13 cells transduced with shSCR and shSOX2. (b) qRT-PCR analyses on chromatin samples from cultured human SCC13 and A431 cells after immunoprecipitation with anti-Sox2 and IgG control antibodies. (a–b) Bar graphs show mean with error bars indicating ± s.d (n=3, *P<0.05 Student’s). (c) Tumor growth curves of A431 cells grafted onto Nude recipient mice after transduction with shNRP1;H2B-RFP or shSCR;H2B-GFP. Data are represented as mean with error bars indicating ± s.e.m. (n=6, *P<0.05, Student’s t-test). (d–f) Quantitative analysis of proliferative Ki67 (d), mitotic phospho-Histone H3(Ser10) pH3 (e), and apoptotic activated Caspase-3 (Casp3) (f) positive cells in shNRP1;H2B-RFP or shSCR;H2B-GFP transduced A431 xenografts. Scatter plots illustrate the percentage of infected parenchymal cells that are positive for the respective marker in n>200 microscopic fields. Horizontal bars indicate mean ± 95% CI. (*P<0.05, Mann-Whitney non-parametric t-test). (g,h) Analysis of clonal growth competition assays at 2 and 4 weeks after intradermal transplantation when 1–2% of A431 cells have been transduced with shNRP1;H2B-RFP and shSCR;H2B-GFP (n=6). (g) Scatter plots illustrate clone size distributions. Horizontal lines represent mean with error bars indicating ± 95% CI. (h) Line graphs show average clone size as a function of time (± s.e.m). (g–h) P values were obtained by Mann-Whitney non-parametric t-tests. (i) Flow cytometric analyses of basement membrane-associated clones (integrin α6hi) in clonal competition assays two weeks after transplantation. Bar graphs show mean population size of shNRP1;H2B-RFP and shSCR;H2B-GFP expressing cells within the α6-integrin-high and α6-integrin-low gates. Error bars indicate ± s.d (n=6, *P<0.05, Student’s t-test). (j) Projections of representative three-dimensional immunofluorescence micrographs (left) and radial histograms (right) indicating the orientation of basal cell divisions relative to the tumor-stroma interface in shSCR;H2B-GFP control (top, n=34) and shNRP1;H2B-RFP (bottom, n=43) human A431 SCC grafts. Survivin marks the spindle mid-body (SURV, white) and Nidogen (NIDO, magenta) demarcates the basement membrane. Scale bars indicate 10 µm. Blue lines indicate median division angles. Statistical significance P<0.01 was determined by Mann-Whitney non-parametric t-test.
Figure 5
Figure 5. SOX2 expression promotes TIC divisions along the tumor-stroma interface
(a) Confocal sections of human SCCs stained with SOX2 (green), Survivin (SURV, red), α6-integrin (α6, white) and DAPI (blue). Scale bars indicate 10 µm. (b–c) Radial histograms indicating the orientation of basal cell divisions relative to the tumor-stroma interface expressing high (green) or low (red) levels of SOX2 in human (b) and mouse (c) SCCs. Blue lines indicate median division angles. (d) Projections of representative three-dimensional immunofluorescence micrographs of shSCR;H2B-GFP and shSOX2;H2B-RFP clones in A431 xenografts stained with Survivin (SURV, white), α6-integrin (blue). Scale bars indicate 10 µm. (e–f) Radial histograms describe the orientation of basal cell divisions relative to the tumor-stroma interface in shSCR;H2B-GFP (green) and shSOX2;H2B-RFP (red) clones in human (e) and mouse (f) SCC transplants. Blue lines indicate median division angles. (g–h) Flow cytometric analyses of shSCR;H2B-GFP and shSOX2;H2B-RFP clonal competition assays two weeks after transplantation. (g) Scatter plots illustrate the relative abundance of shSCR;H2B-GFP and shSOX2;H2B-RFP cells within the α6/β1-integrin high and low gates. (h) Bar graphs show mean population size of shSOX2;H2B-RFP and shSCR;H2B-GFP expressing cells within the α6-integrin-high and α6-integrin-low gates with error bars indicating ± s.d (n=6, *P<0.05, Student’s t-test).

References

    1. Clarke MF, et al. Cancer stem cells--perspectives on current status and future directions: AACR Workshop on cancer stem cells. Cancer Res. 2006;66:9339–9344. - PubMed
    1. Clarke MF, Fuller M. Stem Cells and Cancer: Two Faces of Eve. Cell. 2006;124:1111–1115. - PubMed
    1. Jaks V, Kasper M, Toftgard R. The hair follicle-a stem cell zoo. Exp. Cell Res. 2010;316:1422–1428. - PubMed
    1. Blanpain C, Fuchs E. Epidermal homeostasis: a balancing act of stem cells in the skin. Nat. Rev. Mol. Cell Biol. 2009;10:207–217. - PMC - PubMed
    1. Mascre G, et al. Distinct contribution of stem and progenitor cells to epidermal maintenance. Nature. 2012 - PubMed

Publication types

MeSH terms

Associated data