. 2014 Aug;41(4):375-87.
doi: 10.1007/s10928-014-9372-2. Epub 2014 Jul 31.

Incorporating target-mediated drug disposition in a minimal physiologically-based pharmacokinetic model for monoclonal antibodies

Affiliations

Incorporating target-mediated drug disposition in a minimal physiologically-based pharmacokinetic model for monoclonal antibodies

Yanguang Cao et al. J Pharmacokinet Pharmacodyn. 2014 Aug.

Abstract

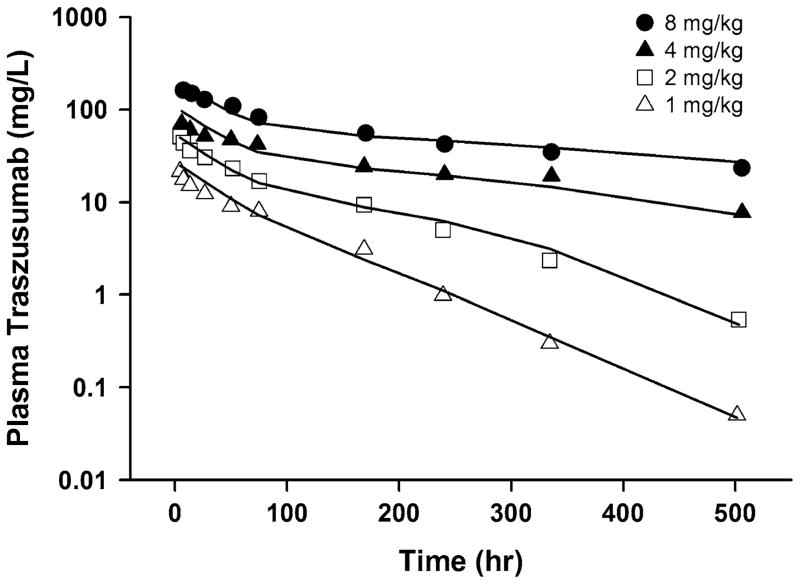
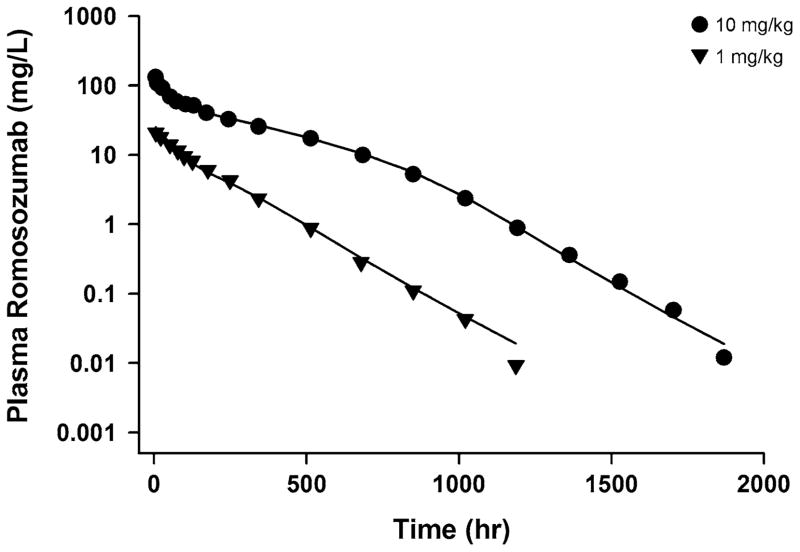
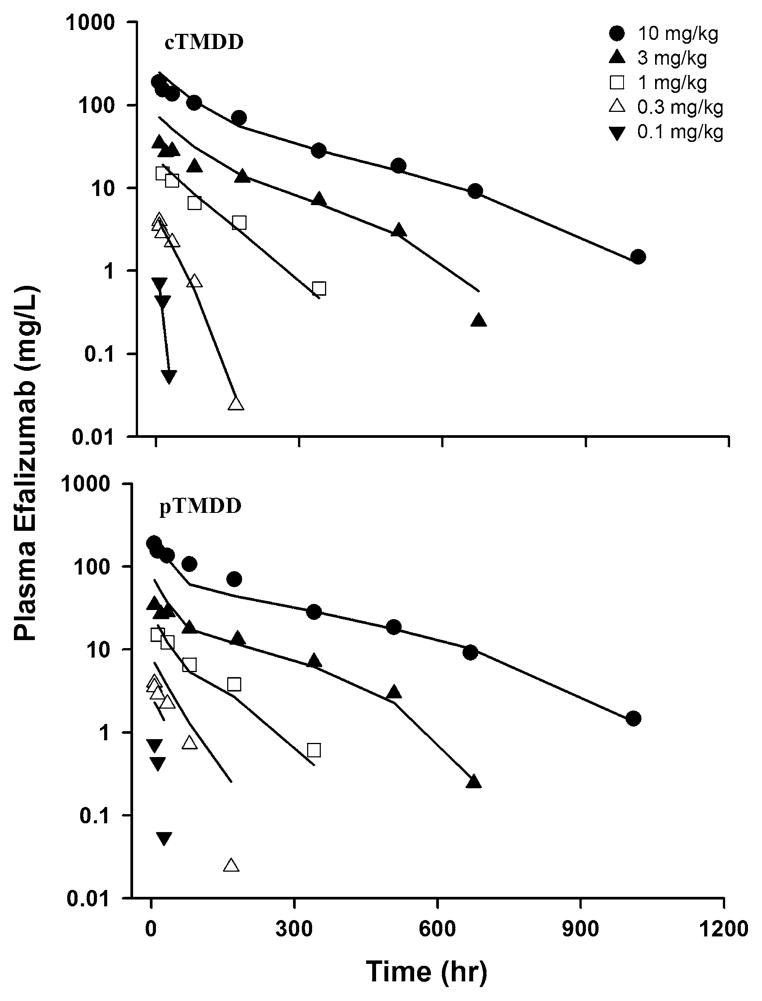
Target-mediated drug disposition (TMDD) usually accounts for nonlinear pharmacokinetics (PK) of drugs whose distribution and/or clearance are affected by their targets owing to high affinity and limited capacity. TMDD is frequently reported for monoclonal antibodies (mAb) for such reason. Minimal physiologically-based pharmacokinetic models (mPBPK), which accommodate the unique PK behaviors of mAb, provide a general approach for analyzing mAbs PK and predicting mAb interstitial concentrations in two groups of tissues. This study assessed the feasibility of incorporating TMDD into mPBPK models to consider target-binding in either plasma (cTMDD) or interstitial fluid (ISF) (pTMDD). The dose-related signature profiles of the pTMDD model reveal a parallel early decay phase, in contrast with the cTMDD model that exhibits a faster initial decline for low doses. The parallel early phase in the pTMDD model is associated with the slow perivascular extravasation of mAb, which restricts the initial decline regardless of interstitial target-mediated elimination. The cTMDD and pTMDD models both preserve the long terminal phase that is typically perceived in conventional two-compartment (2CM) and TMDD models. Having TMDD in ISF impacts the typical relationships between plasma concentrations and receptor occupancy, and between saturation of apparent nonlinear clearance and saturation of receptors. The vascular reflection coefficient (σ v ) was found to affect receptor occupancy in ISF. In the cTMDD model, saturation of nonlinear clearance is equivalent to saturation of receptors. However, in the pTMDD model, they are no longer equal and all parameters pertaining to receptors or receptor binding (R total , K D , K ss , k int ) shifts such relationships. Different TMDD models were utilized in analyzing PK for seven mAbs from digitized literature data. When the target is in plasma, the cTMDD model performed similarly to the 2CM and TMDD models, but with one less system parameter. When the target exists in ISF, the pTMDD functioned well in analyzing only plasma data to reflect interstitial target binding properties. Assigning TMDD consistent with target-expressing tissues is important to obtain reliable characterizations of receptors and receptor binding. The mPBPK model exhibits excellent feasibility in integrating TMDD not only in plasma but also in ISF.


Figures

Fig. 1
Fig. 1
Model structures of second-generation minimal PBPK models with target-mediated drug disposition in either plasma (cTMDD, Model A) or interstitial fluid (pTMDD, Model B). Symbols and physiological restrictions are defined in Eqs. (1)–(12). The plasma compartment in the left box represents the venous plasma as in full PBPK models but is not applied in this model
Fig. 2
Fig. 2
Plasma concentration versus time profiles for increasing doses from 2.6 to 1,300 nmol based on target-mediated drug disposition in either plasma (top), Vleaky (middle), or Vtight (bottom) in the mPBPK modeling framework. Differential equations for the simulations are shown in Supplementary Materials and parameter values are listed in Table 1
Fig. 3
Fig. 3
Simulated relationships between interstitial receptor occupancy (RO) and vascular reflection coefficient (σv) at given plasma antibody concentrations. The simulation is based on Eq. (16) and parameters listed in Table 1. Zone I indicates the range of σv for tissues with fenestrated or discontinuous vascular endothelium (Vleaky) and Zone II reflects the range for tissues with continuous vascular endothelium (Vtight)
Fig. 4
Fig. 4
Simulated relationships between saturation of plasma nonlinear clearance (1 − CLTM/CLTM-max) and saturation of targets (RO). When the target is in ISF, any parameters that are related to target and target binding contribute to the deviation of their relationship from that with target in blood. The simulation is based on Eq. (19) and parameters listed in Table 1
Fig. 5
Fig. 5
Pharmacokinetic profiles of zalutumumab in monkeys. Symbols are observations for the indicated doses and curves are model fittings based on the pTMDD model (solid line) or the cTMDD model (dashed line). Fitted parameters are listed in Table 2
Fig. 6
Fig. 6
Pharmacokinetic profiles of traszusumab in patients with metastatic breast cancer. Symbols are observations for the listed doses and curves are model fittings using the pTMDD model. Fitted parameters are listed in Table 2
Fig. 7
Fig. 7
Pharmacokinetic profiles of onartuzumab in monkey. Symbols are observations for the listed doses and curves are model fittings using the pTMDD model. Fitted parameters are listed in Table 2
Fig. 8
Fig. 8
Pharmacokinetic profiles of MEHD7945A in mice (top) and monkeys (bottom). Symbols are observations for the listed doses and curves are model fittings using the pTMDD model. Fitted parameters are listed in Table 2
Fig. 9
Fig. 9
Pharmacokinetic profiles of romosozumab in healthy men and postmenopausal women. Symbols are observations for the listed doses and curves are model fittings using the pTMDD model. Fitted parameters are listed in Table 2
Fig. 10
Fig. 10
Pharmacokinetic profiles of mavrilimumab in human subjects with rheumatoid arthritis. Symbols are observations for the listed doses and curves are model fittings using the cTMDD model. Fitted parameters are listed in Table 2
Fig. 11
Fig. 11
Pharmacokinetic profiles of efalizumab in humans. Symbols are observations for the listed doses and curves are model fittings based on the cTMDD model (top) or the pTMDD model (bottom). The inadequate prediction of the low dose profiles using the pTMDD model is associated with an important feature of the model that the apparent nonlinear clearance (CLTM) (Eq. (17)) is always smaller than distribution clearance (ΣL·(1 − σv)). Fitted parameters are listed in Table 2

References

    1. Buss NA, Henderson SJ, McFarlane M, Shenton JM, de Haan L. Monoclonal antibody therapeutics: history and future. Curr Opin Pharmacol. 2012;12:615–622. - PubMed
    1. Reichert JM. Marketed therapeutic antibodies compendium. MAbs. 2012;4:413–415. - PMC - PubMed
    1. Wang W, Wang EQ, Balthasar JP. Monoclonal antibody pharmacokinetics and pharmacodynamics. Clin Pharmacol Ther. 2008;84:548–558. - PubMed
    1. Cao Y, Jusko WJ. Applications of minimal physiologically- based pharmacokinetic models. J Pharmacokinet Pharmacodyn. 2012;39:711–723. - PMC - PubMed
    1. Cao Y, Balthasar JP, Jusko WJ. Second-generation minimal physiologically-based pharmacokinetic model for monoclonal antibodies. J Pharmacokinet Pharmacodyn. 2013;40:597–607. - PMC - PubMed

Publication types