. 2014 Oct 31;289(44):30404-30416.
doi: 10.1074/jbc.M114.587295. Epub 2014 Jul 30.

MicroRNA regulation of mitogenic signaling networks in the human placenta

Affiliations

MicroRNA regulation of mitogenic signaling networks in the human placenta

Farkhondeh Farrokhnia et al. J Biol Chem. .

Abstract

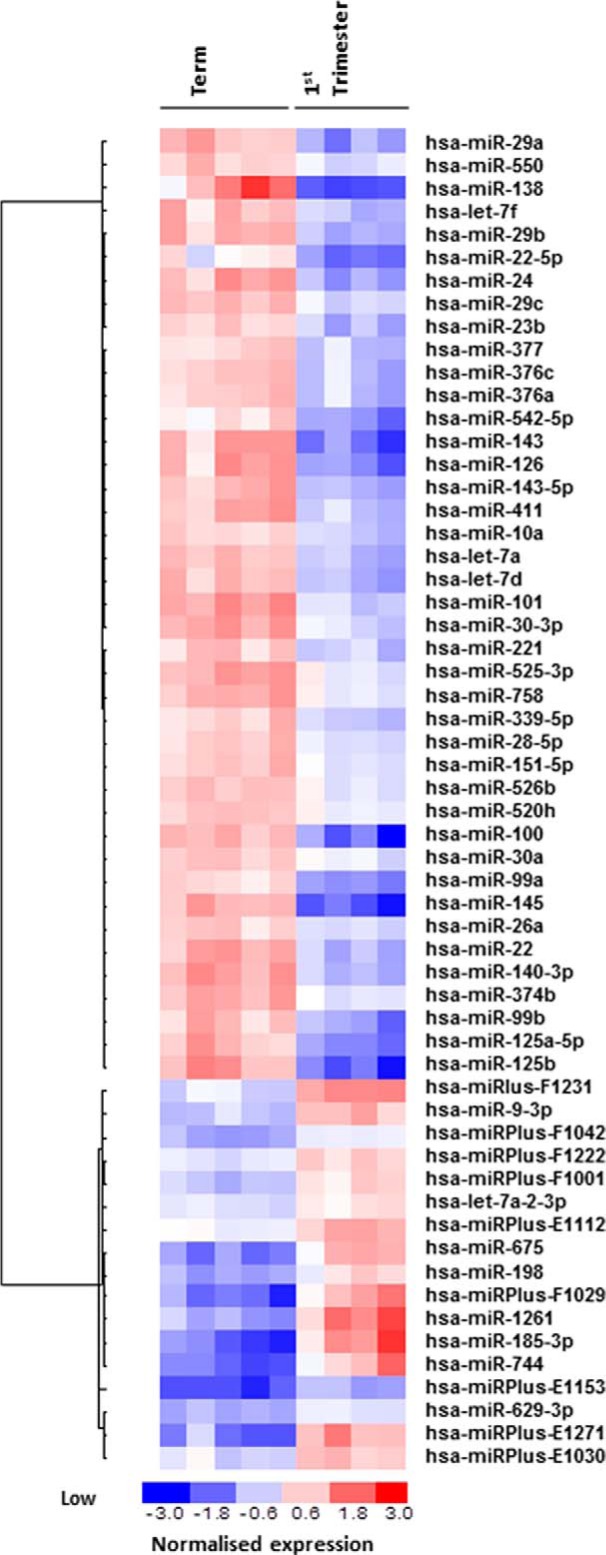
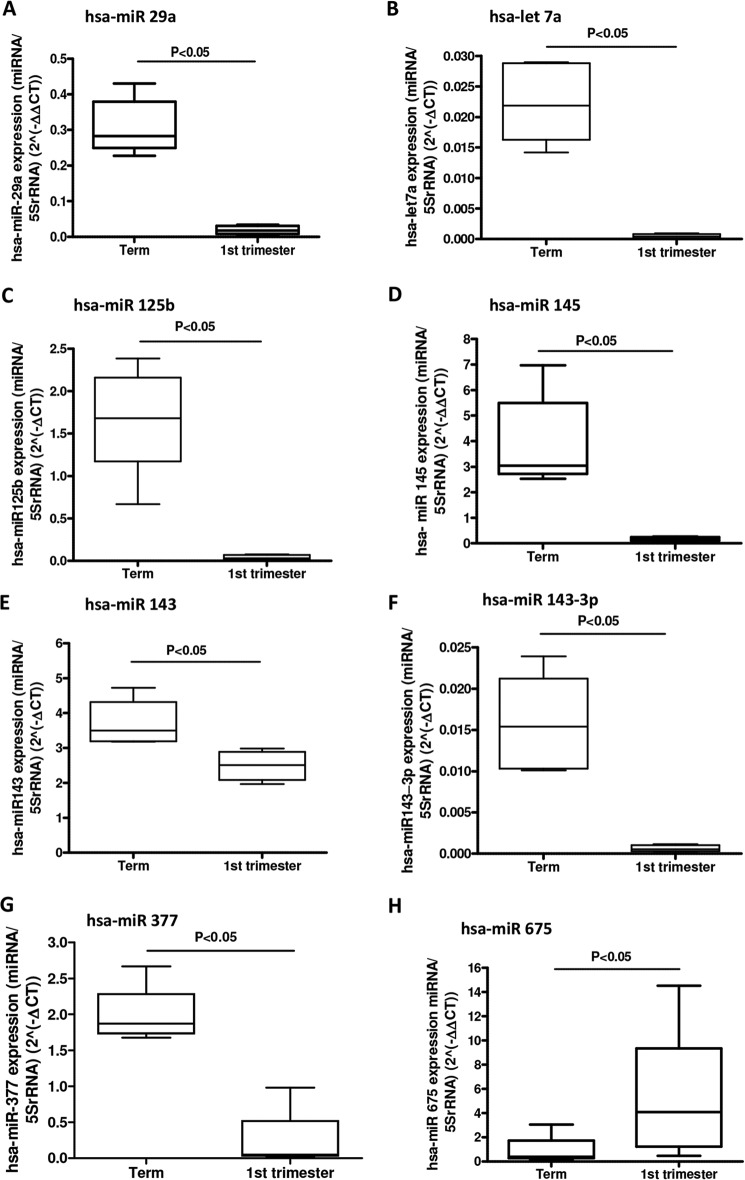
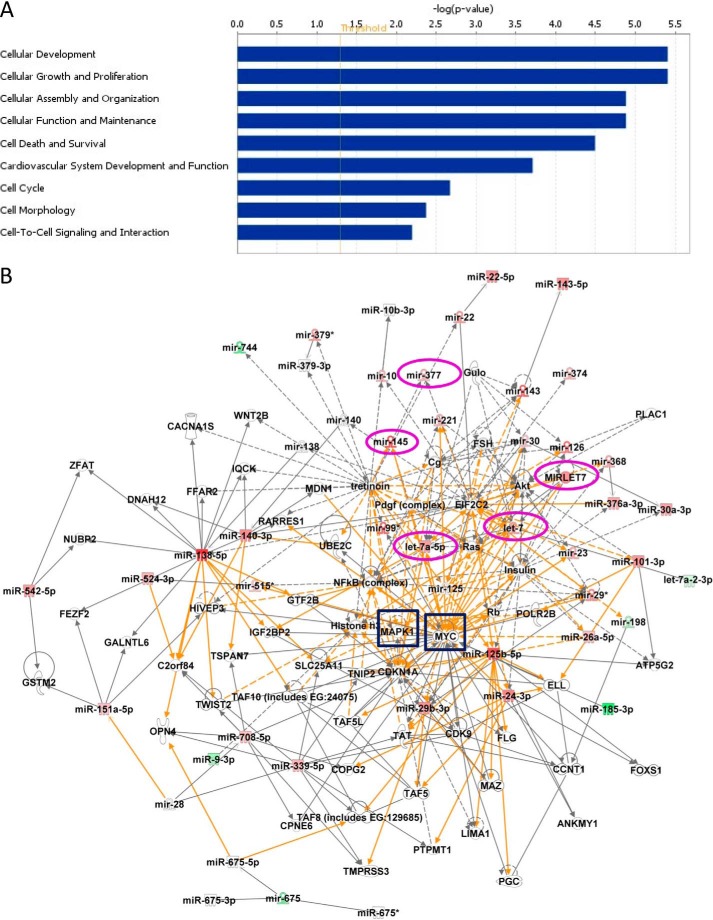
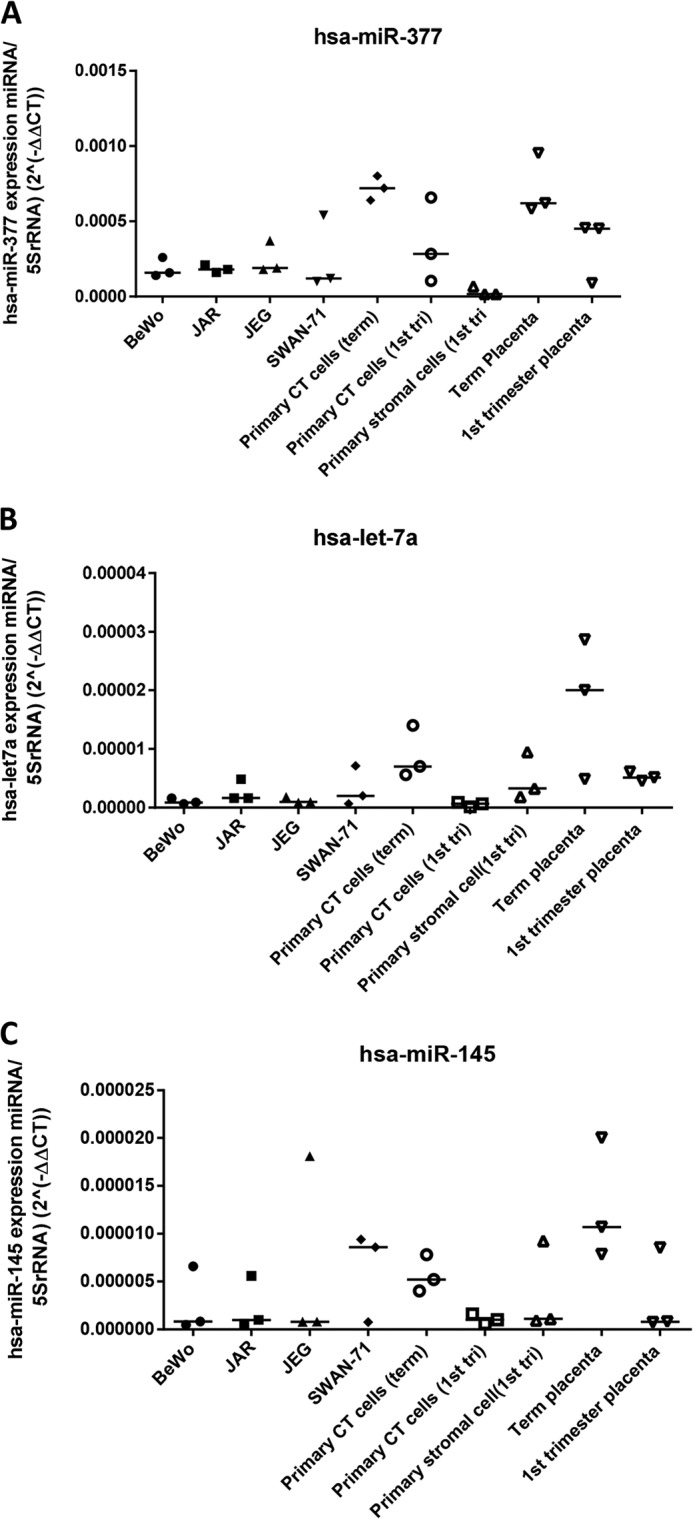
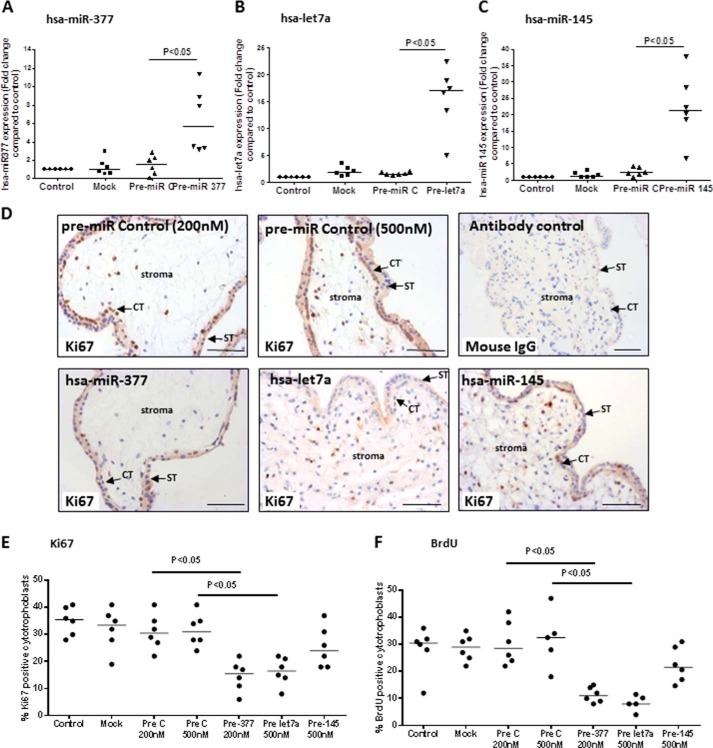
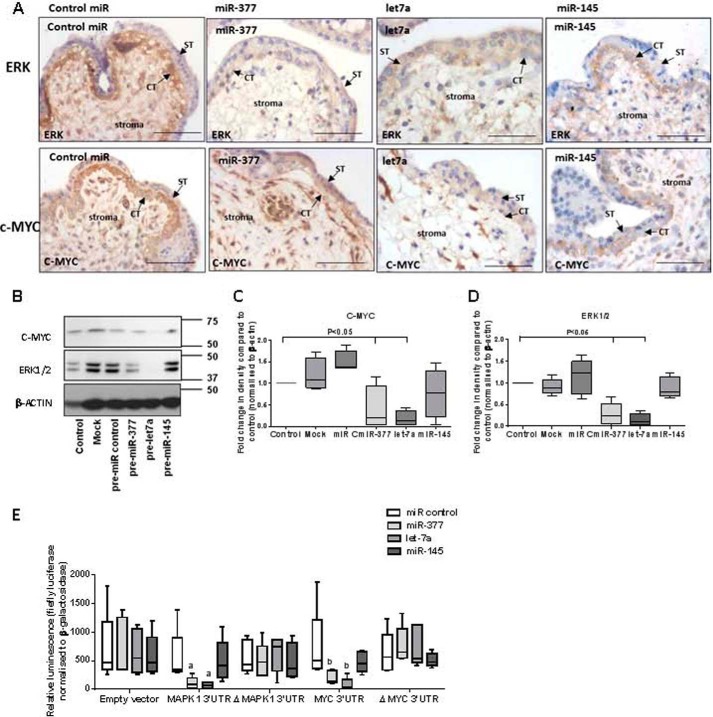
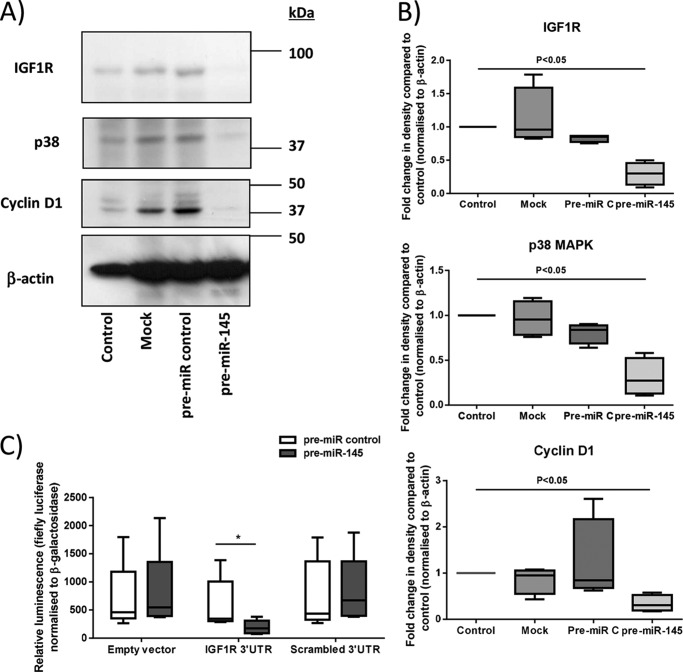
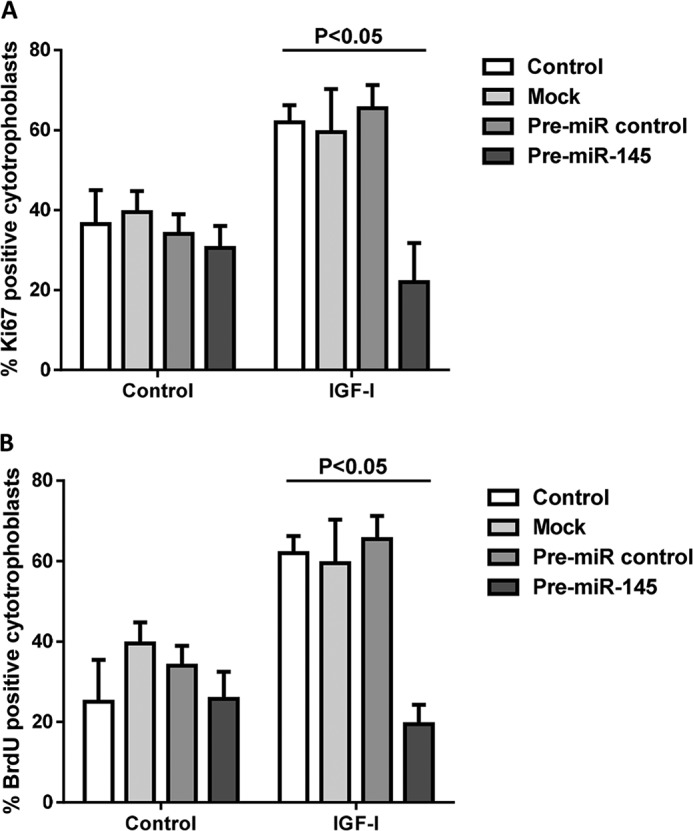
Placental cell growth depends on an adaptable combination of an endogenous developmental program and the exogenous influence of maternal growth factors, both of which may be influenced by microRNA (miR)-dependent effects on gene expression. We have previously shown that global miR suppression in placenta accelerates proliferation and enhances levels of growth factor signaling mediators in cytotrophoblast. This study aimed to identify miRs involved in regulating placental growth. An initial array revealed 58 miR species whose expression differs between first trimester, when cytotrophoblast proliferation is rapid, and term, by which time proliferation has slowed. In silico analysis defined potential growth-regulatory miRs; among these, hsa-miR-145, hsa-miR-377, and hsa-let-7a were predicted to target known placental growth genes and were higher at term than in the first trimester, so they were selected for further analysis. Overexpression of miR-377 and let-7a, but not miR-145, in first trimester placental explants significantly reduced basal cytotrophoblast proliferation and expression of ERK and MYC. PCR arrays, in silico analysis, Western blotting, and 3'-UTR luciferase reporter assays revealed targets of miR-145 within the insulin-like growth factor axis. Analysis of proliferation in placental explants overexpressing miR-145 demonstrated its role as a mediator of insulin-like growth factor-induced trophoblast proliferation. These findings identify miR-377 and let-7a in regulation of endogenous cell growth and miR-145 in the placental response to maternal stimulation and will aid the development of therapeutic strategies for problem pregnancies.

Keywords: Developmental Factor; Gene Regulation; Insulin-like Growth Factor (IGF); MicroRNA (miRNA); Placenta; Proliferation; Reproduction; Trophoblast.


Figures

FIGURE 1.
FIGURE 1.
Differential expression of miRs between first trimester and term human placental tissue. Total RNA was isolated from fresh first trimester (n = 5) and term (n = 5) human placental tissue and applied to a miRCURYTM LNA array (version 11.0 hsa; Exiqon). The heat map diagram shows the result of the two-way hierarchical clustering of miRs and samples. Each row represents a miR, and each column represents a sample. The color scale shown at the bottom illustrates the relative expression level of a miR across all samples; red represents an expression level above the mean, and blue represents expression lower than the mean. The analysis was performed on log2(Hy3/Hy5) signal intensity ratios (where Hy3 represents the sample and Hy5 represents the pool control consisting of equal aliquots of RNA from each sample) that passed the filtering criteria on variation across samples; p < 0.005. miRPlus sequences are licensed (Exiqon) human sequences not yet annotated in miRBase.
FIGURE 2.
FIGURE 2.
Validation of miRNA arrays. Total RNA was isolated from fresh first trimester and term human placental tissue, and qPCR analysis was performed, using individual miRNA primer sets for hsa-miR-29a (A), hsa-let-7a (B), hsa-miR-125b (C), hsa-miR-145 (D), hsa-miR-143 (E), hsa-miR-143–3p (F), hsa-miR-377 (G), and hsa-miR-675 (H). Data were normalized to 5 S rRNA expression and are presented as median and range mRNA and were analyzed by the Mann-Whitney U test. Data were considered significant if p < 0.05. Results shown are representative of at least five independent experiments.
FIGURE 3.
FIGURE 3.
Functional classifications and network generation of altered miRs and their potential targets. A, the data set containing the altered miRs obtained from miRCURYTM LNA array was uploaded into IPA software, and the altered miRs were classified into significantly enriched biological functions. y axis values represent an IPA network score (equal to the −log(p value), where a score of 1.3 (the threshold value; red line) is equivalent to p = 0.05) to indicate the probability that the miRs fall within these biological classifications; only cellular functions exceeding the threshold value were included. A right-tailed Fisher's exact test was used to determine the probability that each biological function identified is due to chance alone. B, networks of known (solid lines) and inferred (dashed lines) interacting molecules were created based on data within Ingenuity Knowledge Base. The color intensity of miR expression indicates the degree of up-regulated (red) or down-regulated (green) miRs. This figure depicts a large merged network composed of three individual networks bridged by two key molecules, MAPK1 (ERK2) and MYC (highlighted by blue boxes), that are known regulators of cellular proliferation. Mature miRs selected for further analyses and their precursors are circled in magenta.
FIGURE 4.
FIGURE 4.
miR-377, let-7a, and miR-145 are enriched in trophoblast cells. Levels of miR-377 (A), let-7a (B), and miR-145 (C) were assessed in a panel of placental trophoblast cell lines (BeWo, JAR, JEG, and SWAN-71), primary cells (primary cytotrophoblast (CT) and primary stromal cells), and fragments of whole placental tissue from term or first trimester placenta. Levels are expressed as levels of specific miR relative to 5 S rRNA. miR-377, let-7a, and miR-145 are all expressed in both primary cytotrophoblast and trophoblast cell lines, albeit at low levels.
FIGURE 5.
FIGURE 5.
miR-377 and let-7a negatively regulate trophoblast proliferation. Pre-miR precursors for miR-377, let-7a, and miR-145 or a pre-miR control (PreC) were transfected into first trimester placental explants (n = 6). The level of miR expression, quantified by qPCR, was significantly increased 24 h post-transfection (A–C). Cytotrophoblast proliferation, determined by counting the number of Ki67-positive cytotrophoblasts (D and E) or BrdU-positive cytotrophoblasts (F) in relation to total cytotrophoblast at 48 h post-transfection was reduced following overexpression of miR-377 and let-7a but not miR-145. D, arrows indicate cytotrophoblasts (CT) and syncytiotrophoblast (ST). One-way analysis of variance with planned contrasts was used to assess differences between sample groups; p < 0.05 was considered significant. Scale bars, 50 μm.
FIGURE 6.
FIGURE 6.
miRs alter expression of mitogenic signaling molecules in first trimester human placenta. A–D, after treatment with miR precursors for 48 h, the expression of the nodal signaling molecules, MAPK1/ERK and MYC, were examined by immunohistochemistry (A) and Western blotting (B). Note that ERK1/2 and c-MYC are present in the villous stroma but are most abundant in cytotrophoblast in tissue transfected with the negative control pre-miR (control pre-miR). C and D, densitometry analysis confirmed that ERK1/2 (C) and c-MYC (D) protein expression are significantly reduced following miR-377 and let-7a overexpression (p < 0.05; n = 4). E, first trimester placental explants were transfected with MAPK1 or MYC sense or mutated (ΔMAPK and ΔMYC) 3′-UTR luciferase reporter constructs or empty vector in the presence of non-targeting (control mimetic) or miR-specific precursors. 24 h later, luciferase activity (normalized to that of β-galactosidase) was assessed; overexpression of miR-377 and let-7a resulted in reduced luciferase activity of MAPK (a) or MYC (b) compared with tissue transfected with control mimetic (n = 5), demonstrating that these genes are direct targets of miR-377 and let-7a. All data are representative of at least four independent experiments. Scale bars, 50 μm. Error bars, median and range.
FIGURE 7.
FIGURE 7.
miR-145 regulates the expression of multiple components of the IGF axis in first trimester placenta. A and B, first trimester placental explants were transfected with a negative control pre-miR (Pre-C) or pre-miR-145 (500 nm) for 48 h, and then the expression of IGF1R, p38 MAPK, and cyclin D1 was assessed by Western blotting. Blots were stripped and reprobed for β-actin (as an internal control). B, densitometry revealed reduced expression of IGF1R, p38 MAPK, and cyclin D1 when miR-145 was overexpressed (p < 0.05; n = 4). C, first trimester placental explants were transfected with sense or mutated (ΔIGF1R) IGF1R 3′-UTR luciferase reporter constructs or empty vector in the presence of control or miR-145-specific mimetics. 24 h later, luciferase activity (normalized to β-galactosidase) was assessed; luciferase activity was significantly reduced in tissue with miR-145 overexpression compared with tissue transfected with control mimetic (p < 0.05; n = 5), demonstrating that IGF1R is a direct target of miR-145 in the placenta. Error bars, median and range.
FIGURE 8.
FIGURE 8.
miR-145 negatively regulates IGF-induced trophoblast proliferation. First trimester placental explants (n = 6) were transfected with pre-miR-145 (500 nm) or a negative control miR. IGF-I (10 nm) or vehicle and, in some experiments, BrdU (100 μm) were added after 48 h, and then cytotrophoblast proliferation was assessed after a further 24-h period by immunohistochemical analysis of Ki67 (A) or BrdU (B) incorporation. The level of proliferating cells was determined by counting at least 200 cytotrophoblasts per treatment and expressing the number of Ki67/BrdU-positive cells as a percentage of total nuclei. One-way analysis of variance with planned contrasts was used to compare differences between groups; p < 0.05 was considered significant. Error bars, median and range.

References

    1. Arnholdt H., Meisel F., Fandrey K., Löhrs U. (1991) Proliferation of villous trophoblast of the human placenta in normal and abnormal pregnancies. Virchows Arch. B Cell Pathol. Incl. Mol. Pathol. 60, 365–372 - PubMed
    1. Jansson T., Powell T. L. (2006) Human placental transport in altered fetal growth: does the placenta function as a nutrient sensor? a review. Placenta 27, 91–97 - PubMed
    1. Forbes K., Westwood M., Baker P. N., Aplin J. D. (2008) Insulin-like growth factor I and II regulate the life cycle of trophoblast in the developing human placenta. Am. J. Physiol. Cell Physiol. 294, C1313–C1322 - PubMed
    1. Forbes K., Souquet B., Garside R., Aplin J. D., Westwood M. (2010) Transforming growth factor-β (TGFβ) receptors I/II differentially regulate TGFβ1 and IGF-binding protein-3 mitogenic effects in the human placenta. Endocrinology 151, 1723–1731 - PubMed
    1. Forbes K., West G., Garside R., Aplin J. D., Westwood M. (2009) The protein-tyrosine phosphatase, SRC homology-2 domain containing protein tyrosine phosphatase-2, is a crucial mediator of exogenous insulin-like growth factor signaling to human trophoblast. Endocrinology 150, 4744–4754 - PubMed

Publication types

LinkOut - more resources