. 2014 Oct 2;514(7520):107-11.
doi: 10.1038/nature13483. Epub 2014 Jul 27.

DNA-damage-induced differentiation of leukaemic cells as an anti-cancer barrier

Affiliations

DNA-damage-induced differentiation of leukaemic cells as an anti-cancer barrier

Margarida A Santos et al. Nature. .

Abstract

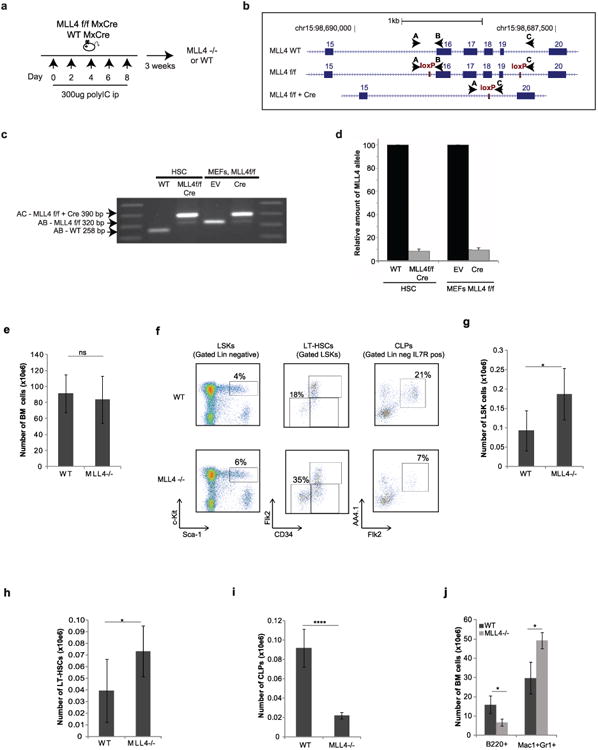
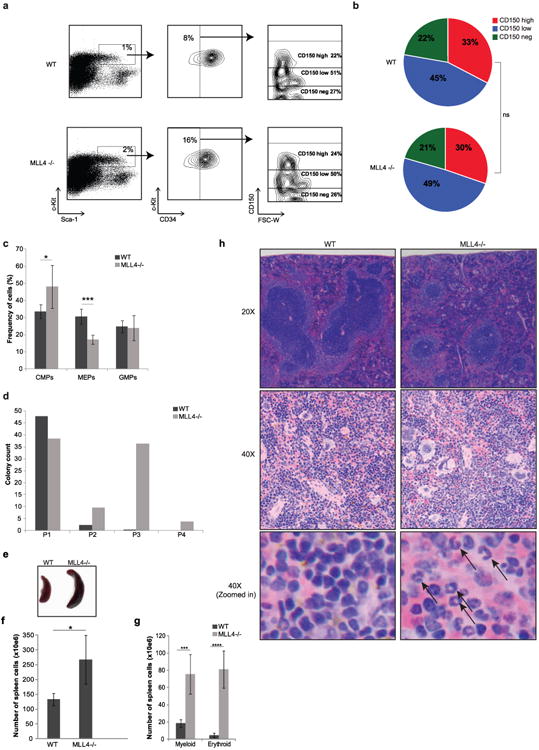
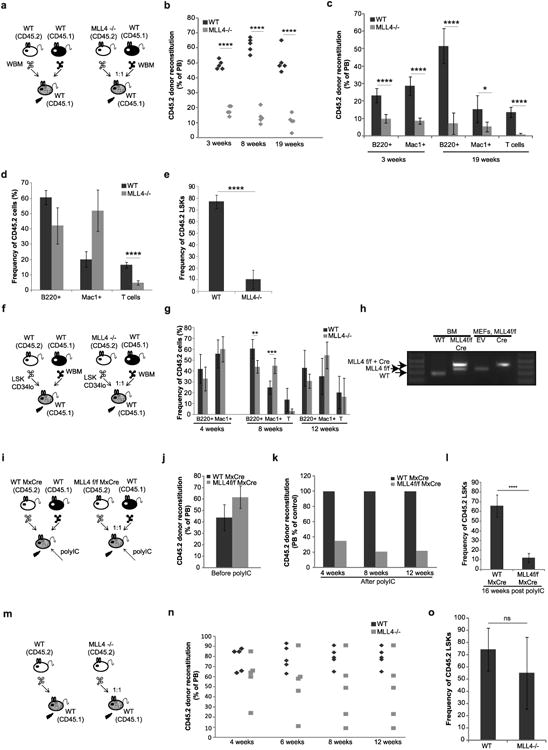
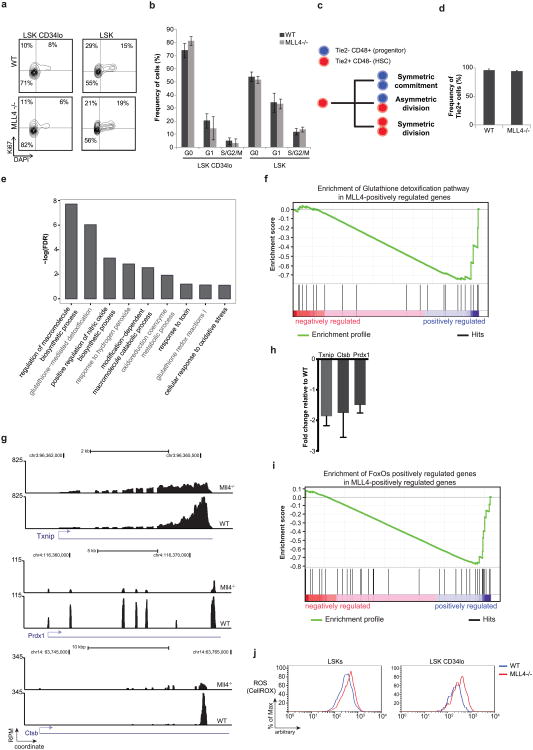
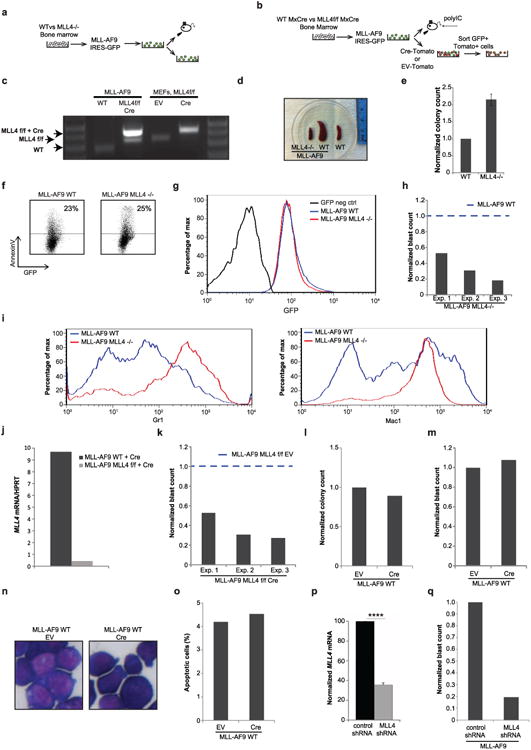
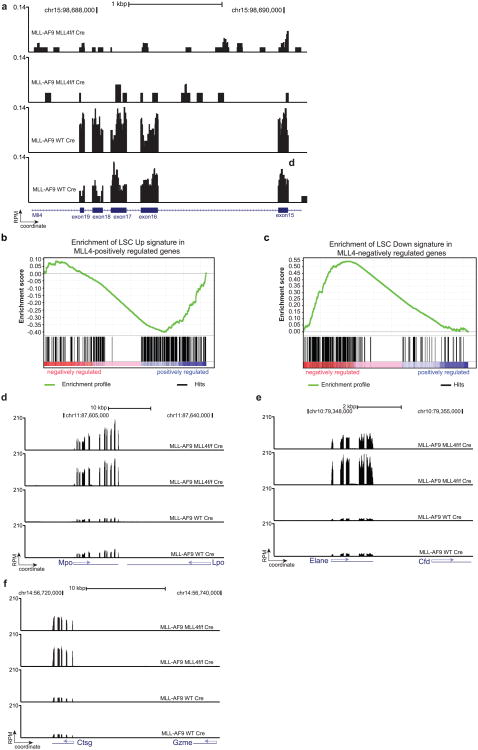
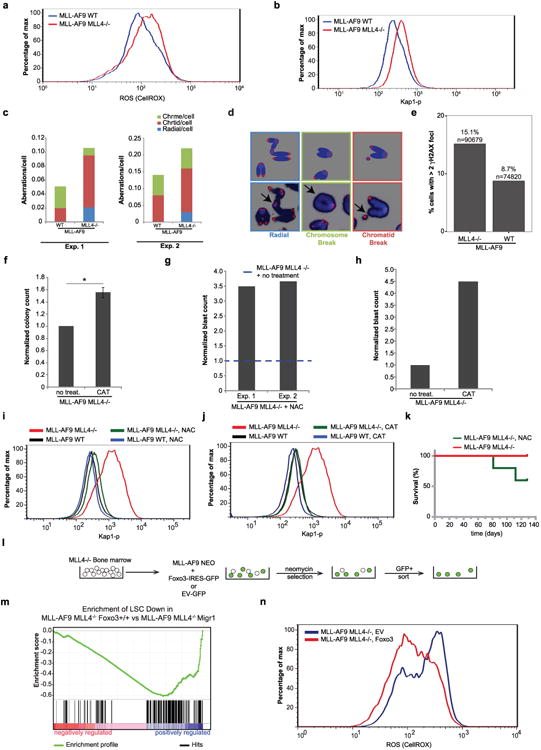
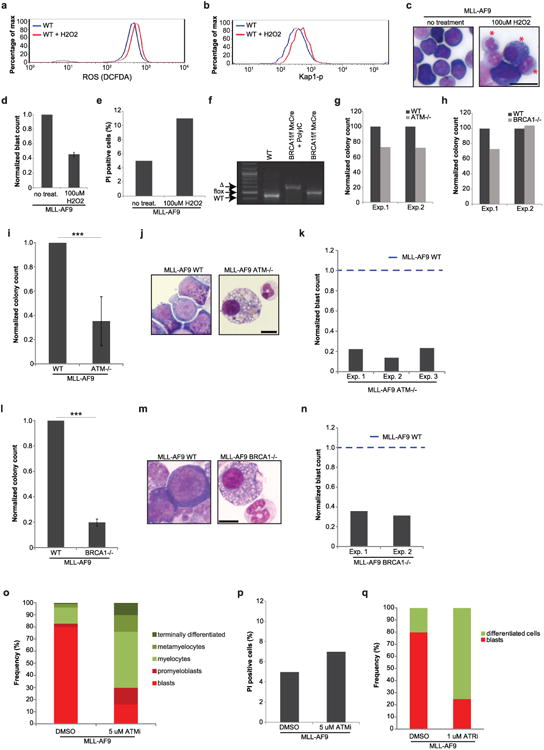
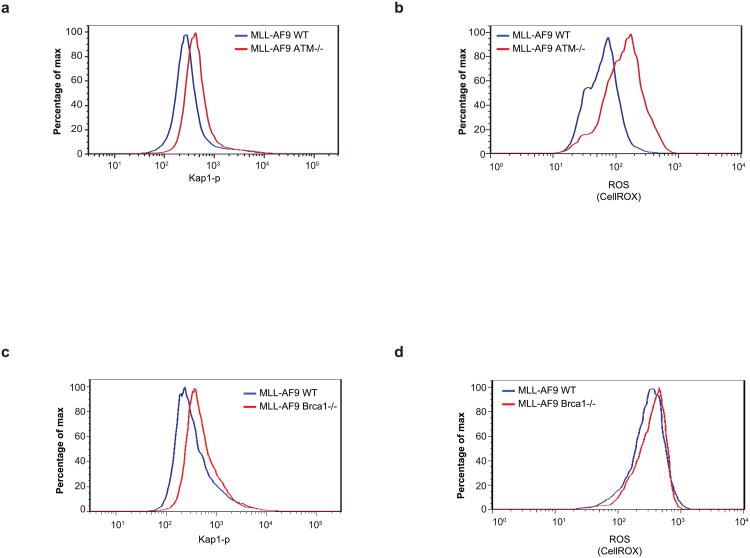
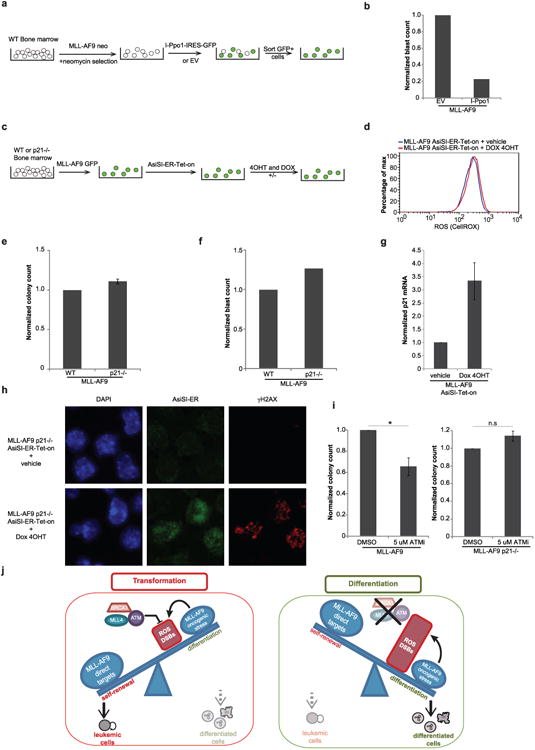
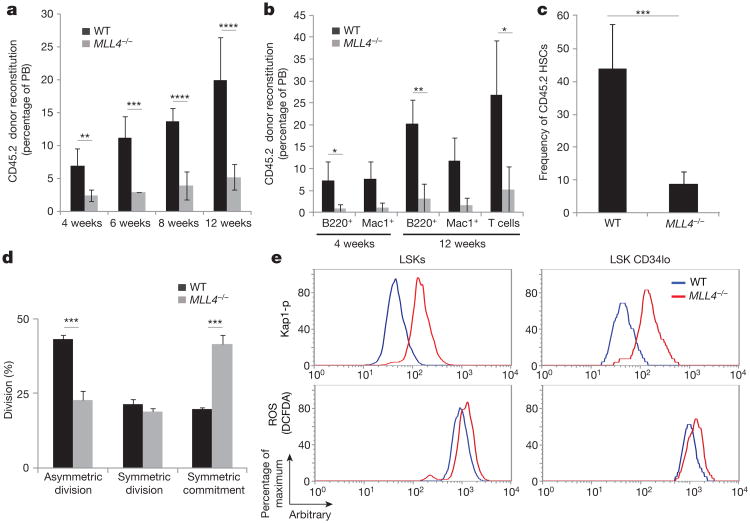
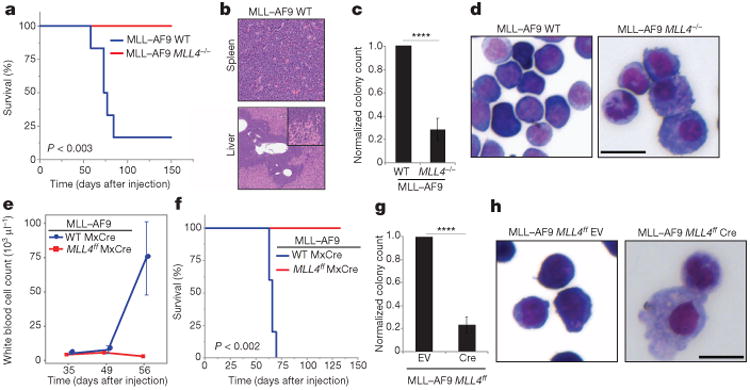
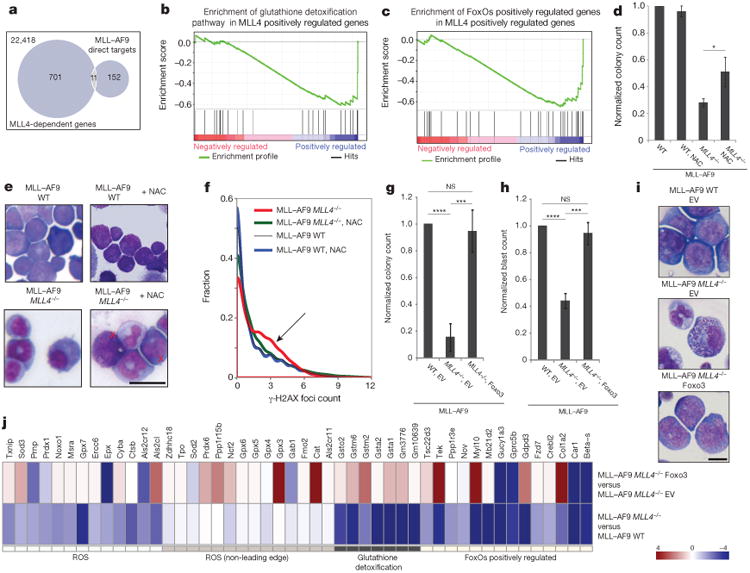
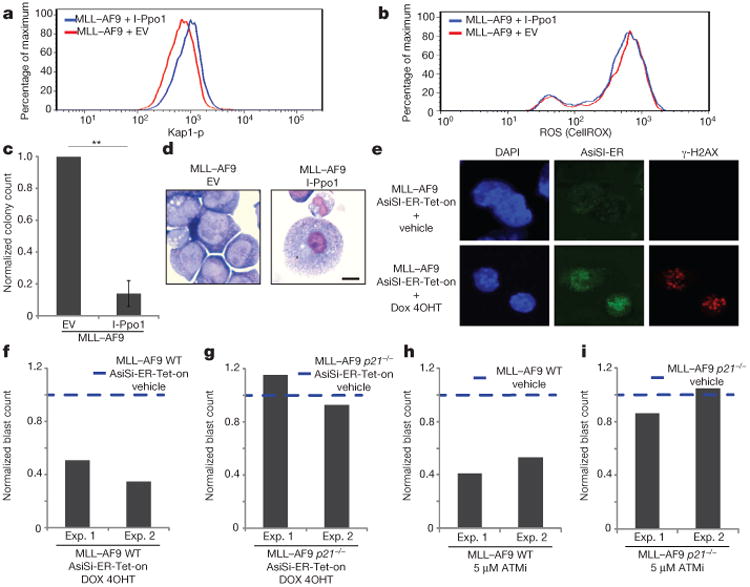
Self-renewal is the hallmark feature both of normal stem cells and cancer stem cells. Since the regenerative capacity of normal haematopoietic stem cells is limited by the accumulation of reactive oxygen species and DNA double-strand breaks, we speculated that DNA damage might also constrain leukaemic self-renewal and malignant haematopoiesis. Here we show that the histone methyl-transferase MLL4, a suppressor of B-cell lymphoma, is required for stem-cell activity and an aggressive form of acute myeloid leukaemia harbouring the MLL-AF9 oncogene. Deletion of MLL4 enhances myelopoiesis and myeloid differentiation of leukaemic blasts, which protects mice from death related to acute myeloid leukaemia. MLL4 exerts its function by regulating transcriptional programs associated with the antioxidant response. Addition of reactive oxygen species scavengers or ectopic expression of FOXO3 protects MLL4(-/-) MLL-AF9 cells from DNA damage and inhibits myeloid maturation. Similar to MLL4 deficiency, loss of ATM or BRCA1 sensitizes transformed cells to differentiation, suggesting that myeloid differentiation is promoted by loss of genome integrity. Indeed, we show that restriction-enzyme-induced double-strand breaks are sufficient to induce differentiation of MLL-AF9 blasts, which requires cyclin-dependent kinase inhibitor p21(Cip1) (Cdkn1a) activity. In summary, we have uncovered an unexpected tumour-promoting role of genome guardians in enforcing the oncogene-induced differentiation blockade in acute myeloid leukaemia.


Figures

Extended Data Figure 1
Extended Data Figure 1. Deletion of MLL4 in haematopoietic stem cells
a, MLL4f/f mice (see methods) were crossed with the interferon-inducible transgene MxCre to obtain MLL4f/f MxCre and WTMxCre mice. Animals were then treated with intraperitoneal (ip) injections of 300 μg of polyIC five times every other day and analysed 3 weeks after the last polyIC injection (generating WT and MLL4−/− mice). b, The MLL4 wild-type locus (WT) and the floxed exons locus before and after Cre excision. Exons are represented in numbered boxes. The loxP sites (red rectangles) and the MLL4 PCR primers (black arrows) are indicated. c, PCR analysis for conditional MLL4 knockout mice (exons 16, 17, 18, 19). Genomic DNA from sorted HSCs derived from WT and MLL4−/− mice (PolyIC treated as in a) and from mouse embryonic fibroblasts (MEFs) derived from MLL4f/f cells infected with a retrovirus expressing Cre or empty vector (EV) were analysed by PCR. The wild-type (258 base pairs (bp)) and floxed band (320 bp) were amplified with primers A and B, and the knockout band (390 bp) was amplified with primers A and C in different reactions. One of two independent genotyping experiments is shown. d, qPCR quantification of deletion efficiency in conditional knockout Cre-expressing cells. e, Whole bone-marrow cellularity 3 weeks after polyIC treatment of WTMxCre and MLL4f/f MxCre mice (referred to as WT and MLL4−/− respectively). f, Representative FACS profiles pre-gated on live cells showing LSKs, LT-HSCs and common lymphoid progenitors, and quantification of these bone-marrow populations (gi) as well as B cells and myeloid cells (j) in the bone marrow. All bar graphs show mean ± s.d. of at least three independent experiments.
Extended Data Figure 2
Extended Data Figure 2. Extramedullary haematopoiesis in the absence of MLL4
a, Representative FACS plot of LSKs separated based on CD34 and subsequently analysed by cell surface expression of CD150 (Slamf1). b, Pie charts summarize data from three independent mice of each genotype (χ2 test, P > 0.8). c, Frequency of cells determined by FACS analysis of LinSca1+c-Kit separated based on CD34 and FcγRII/III. CMPs, common myeloid progenitors; MEPs, megakaryocyte-erythroid progenitors; GMPs, granulocyte macrophage progenitors. Mean ± s.d. of three mice per group is shown. d, Quantification of colony numbers generated by WT and MLL4−/− myeloid progenitors (LSK) in serial colony forming assays; y axis, number of colonies; x axis, serial assay, primary to quaternary. eg, Splenomegaly and increased numbers of myeloid and erythroid cells in the spleens of MLL4−/− mice 3 weeks after polyIC treatment. Image of spleen representative of more than three independent experiments. h, Haematoxylin and eosin staining of spleen (upper panel, ×20; middle panel; ×40; lower panel, magnified picture of the middle panel to visualize details). Black arrows show presence of erythrocytes in MLL4-deficient spleens. Images were acquired in one experiment.
Extended Data Figure 3
Extended Data Figure 3. MLL4-deficient HSCs have impaired reconstitution capacity
a–e, Whole bone-marrow (WBM) cells from WT or MLL4−/− mice (CD45.2) were mixed in 1:1 ratio with WT WBM (CD45.1) and transplanted into irradiated recipients (CD45.1). Reconstitution levels were monitored for 19 weeks after transplantation in the peripheral blood (PB) (b, c). d, Lineage distribution (B cells, myeloid-Mac1-positive cells and T cells) among remaining CD45.2 cells analysed in the peripheral blood 19 weeks after transplant. The total percentage of reconstitution as well as the frequency of the various lymphoid and myeloid subpopulations are severely diminished in the absence of MLL4 (c). However, among the few remaining MLL4−/− CD45.2-positive cells (d), there was a relatively higher frequency of myeloid cells and a diminished frequency of lymphoid cells. e, The frequency of donor-derived LSKs was determined in the bone marrow at week 19. Bar graphs show mean ± s.d. calculated from five mice of each genotype. f, Two hundred sort-purified LSK CD34lo cells (HSCs) from WT or MLL4−/− mice (CD45.2) were mixed with 500,000 WT WBM (CD45.1) and transplanted into irradiated recipients (CD45.1). g, Lineage distribution (B cells, myeloid-Mac1-positive cells and T cells) among remaining CD45.2 cells analysed in the peripheral blood at indicated time points. h, Genomic DNA derived from sorted bone marrow 14 weeks after transplant or from MEFs derived from MLL4f/f cells infected with a retrovirus expressing Cre or empty vector (EV) were analysed by PCR for MLL4 deletion. Genotyping was performed once with CD45.2+ cells pooled from the animals in each group at the end of the experiment (12weeks). i, WBM from WTMxCre or MLL4f/f MxCre mice (CD45.2) were mixed in 1:1 ratio with WT WBM (CD45.1) and transplanted into irradiated recipient mice (CD45.1). j, Reconstitution levels were monitored in the peripheral blood at 5weeks after transplantation and 1day before the beginning of treatment with polyIC. k, Reconstitution levels were monitored in the peripheral blood at 4–12 weeks after polyIC treatment. l, The frequency of donor-derived LSKs was determined in the bone marrow at week 16. Bar graphs show mean ± s.d. calculated from five mice of each genotype. m, For non-competitive bone-marrow transplants, WBM cells (CD45.2) from WT or MLL4−/− mice (that is, WT MxCre and MLL4f/f MxCre mice 3weeks after polyIC treatment) were transplanted into irradiated recipient mice (CD45.1). n, Reconstitution levels were monitored for 12 weeks after transplantation in the peripheral blood and the frequency of donor-derived LSKs (o) was determined in the bone marrow at week 16. Bar graphs show mean ± s.d. of five mice per group.
Extended Data Figure 4
Extended Data Figure 4. MLL4 regulates the expression of genes in the glutathione- and FoxO-dependent pathways
a, Representative FACs plots showing Ki-67 versus DAPI profiles in LSK CD34lo cells (left panel) and LSK cells (right panel). b, Summary of the cell-cycle profiles as in a for three independent mice per group. c, Schematic of division patterns of HSCs. d, Tie2 expression in bone-marrow CD150+CD48CD41Flt3CD34 LSK cells from WT or MLL4−/− mice. e, Canonical pathways and biological processes over-represented within the 1,000 most downregulated genes in MLL4f/f MxCre (MLL4−/−) relative to WT MxCre (WT) sorted LSKs. f, GSEA shows enrichment of glutathione detoxification pathway in WT MxCre (WT) relative to MLL4f/f MxCre (MLL4−/−) LSKs (FDR < 0.1). g, RNA-seq read histograms at Txnip, Prdx1 and Ctsb. The x axis represents the linear sequence of genomic DNA; the y axis represents the reads per million aligned reads (RPM). The genomic scale in kilobase pairs (kbp) is indicated above the tracks. h, mRNA levels detected by qRT–PCR in purified HSCs of selected genes (Txnip, Prdx1 and Ctsb) that were downregulated in the absence of MLL4. i, GSEA plot shows downregulation of the FOXO1/3/4 positively regulated genes in MLL4f/f MxCre (MLL4−/−) LSKs (FDR < 0.1). j, LSK andLSK CD34locells from WT or MLL4−/− mice were stained with CellROX Deep Red Reagent to measure the levels of ROS. One representative of three experiments is shown.
Extended Data Figure 5
Extended Data Figure 5. MLL4 is required for MLL–AF9 transformation in vivo and in vitro
a, WT and MLL4−/− bone-marrow cells were transformed with MLL–AF9 and injected into irradiated recipients (650 rad) or maintained in culture for in vitro experiments. b, Non-polyIC-treated WTMxCre and MLL4f/f MxCre bone-marrow cells were transformed with MLL–AF9. Cells were subsequently infected with retrovirus containing Cre-recombinase (CRE-Tomato) or injected into mice that were administered polyIC 1 week later. c, PCR analysis of genomic DNA shows the extent of MLL4 deletion in MLL–AF9-infected cells. MLL4f/f and MLL4f/f Cre-infected MEFs were used as a control. Genotyping was performed once. d, Spleens from mice 29 days after injection with WT MLL–AF9 or MLL4−/− MLL–AF9 cells, and spleen from non-injected littermates (WT) (see also Fig. 2a–c). Photographs were taken in one experiment. e, Normalized colony counts scored 11 days after culture of WT or MLL4−/− whole bone marrow (non-transformed) in semi-solid media in the presence of IL3, IL6 and SCF. f, Representative FACS plots showing AnnexinV versus GFP staining in MLL–AF9 WT or MLL4−/− cells cultured in semi-solid media (as in a). g, Histogram of GFP expression 10 days after MLL–AF9 transformation. h, Frequency of cells identified as blasts evaluated from cytospin samples in Fig. 2d. Data are shown normalized to WT counts (dotted line) in three independent experiments. i, The morphological changes observed in MLL4-deficient MLL–AF9 cells are accompanied by increased expression of the myeloid markers Mac1 (right) and Gr1 (left). j, WT or MLL4f/f bone-marrow cells were transformed with MLL–AF9 and subsequently MLL4 was excised by retroviral expression of CRE as in b. Five days later, MLL4 mRNA levels were measured by qPCR. k, Frequency of cells identified as blasts in the cytospin samples in Fig. 2h. Data are shown normalized to WT counts (dotted line) in three independent experiments. lo, WT bone-marrow cells were transformed with MLL–AF9 and subsequently infected with retroviruses expressing CRE (as in b). Blast colony counts (l), frequency of blasts evaluated by May-Grünwald-Giemsa stained cytospins (m, n) and frequency of apoptotic cells determined by morphology (o) were calculated after culture in semi-solid media supplemented with SCF, IL3 and IL6. Images of cytospins were acquired once. p, WT MLL–AF9 cells were stably infected with a retrovirus encoding an shRNA to target and silence MLL4 expression. shRNA depletion of MLL4 mRNA was measured by qPCR and normalized to levels in non-target control shRNA-infected cells. q, Frequency of cells identified as blasts in the cytospin samples from MLL4 shRNA-infected cells compared with control shRNA-infected cells.
Extended Data Figure 6
Extended Data Figure 6. Genes associated with myeloid maturation are significantly upregulated after MLL4 deletion in cells transformed with MLL–AF9
a, RNA-seq read histograms at the MLL4 exons 16–19 in MLL–AF9 MLL4f/f Cre and MLL–AF9 WT Cre cells. b, LSC Up gene set constitutes genes upregulated in the MLL–AF9 ‘leukemic stem cell’ self-renewal associated signature. GSEA plot demonstrates downregulation of LSC Up gene set in MLL–AF9 MLL4f/f-Cre cells (FDR < 0.1). c, LSC Down gene set constitutes genes downregulated in the MLL–AF9 ‘leukemic stem cell’ self-renewal associated signature. GSEA plot demonstrates upregulation of LSC Down gene set in MLL–AF9 MLL4f/f-Cre cells (FDR < 0.1). df, Comparison of RNA-seq read histograms at the genes Mpo (myeloperoxidase), Elane/Ela2 (neutrophil elastase) and Ctsg (cathepsin G) in MLL–AF9 MLL4f/f-Cre and MLL–AF9 WT Cre cells. The x axis represents the linear sequence of genomic DNA; the y axis represents the reads per million aligned reads (RPM). The genomic scale in kilobase pairs (kbp) is indicated above the tracks.
Extended Data Figure 7
Extended Data Figure 7. Increased levels of DNA damage and ROS in MLL4-deficient cells transformed with MLL–AF9
a, WT and MLL4−/− cells were stained with CellROX Deep Red Reagent to measure the levels of ROS after MLL–AF9 infection. b, The levels of phosphorylated Kap1 were determined by flow cytometry. One representative of at least three independent measurements is shown. c, Levels of aberrations (chromosome breaks, chromatid breaks and radial chromosomes) in metaphase spreads in two independent experiments derived from MLL–AF9 WT and MLL4−/− cells. d, Examples of chromosome aberrations. One representative of two experiments. e, High-throughput microscopy imaging of MLL4−/− (n = 90,679) and WT (n = 74,820) quantifies the percentage of cells with at least three γ-H2AX foci. On average, 1.3 and 5.9 foci per cell were observed in WT and MLL4−/− MLL–AF9 cells, respectively. fj, After infection with MLL–AF9, MLL4-deficient cells were expanded in semi-solid media in the presence or absence of the antioxidants NAC or catalase. f, Normalized colony counts with or without catalase treatment. Data show mean ± s.d. of three independent experiments. g, Frequency of cells identified as blasts with or without NAC in the cytospins of Fig. 3e. Data are shown normalized to WT counts (dotted line) in two independent experiments. h, Frequency of blasts with or without catalase treatment were quantified on the basis of morphology. i, j, NAC or catalase treatment reduces the levels of phosphorylated Kap1 in MLL4-deficient MLL–AF9 cells. The two different treatments (NAC, catalase) and controls (red and black lines) were performed in the same experiment but controls are plotted separately in i and j for simplicity. k, Bone-marrow cells from MLL4f/f MxCre mice (without polyIC treatment) were collected 4 days after 5-FU treatment and infected with a retrovirus containing MLL–AF9. After expansion in semi-solid media, cells were injected into mice that were subsequently (1 week later) administered polyIC to excise MLL4 in vivo. One group of mice was fed with NAC in the drinking water starting 1 week before the injection of the transformed cells. Two out of five animals treated with NAC died (both animals displayed elevated white blood cell counts at time of death) and none of the untreated mice died (and all had normal white blood cell counts). Survival curves were determined at the indicated time points; n = 5 mice per group. ln, MLL4−/− bone-marrow cells were co-transformed with MLL–AF9-neo and either empty vector or retroviruses encoding FOXO3-IRES–GFP. One week after selection in G418, GFP+ cells were sorted, then cultured ex vivo. m, GSEA plot demonstrates that FOXO complementation reversed upregulation of LSC Down gene set in MLL4f/f-Cre MLL–AF9 cells (FDR < 0.1). n, Cells were stained with CellROX Deep Red Reagent to measure the levels of ROS. One representative of two independent measurements is shown.
Extended Data Figure 8
Extended Data Figure 8. H2O2 treatment, ATM-, BRCA1-deficiency or ATM and ATR inhibition leads to myeloid differentiation of cells transformed with MLL–AF9 ex vivo
a–e, WT cells transformed with MLL–AF9 (Extended Data Fig. 5a) and expanded in semi-solid media. Cells were treated with 100 μM H2O2 and the levels of ROS detected by DCF-DA staining (a) and phosphorylated Kap1 (b) were determined 48 h after treatment. One representative of two independent experiments is shown. The number of cells with blast morphology (c) was quantified 48 h after treatment (d). Red stars in (c) indicate cells with morphological changes characteristic of differentiation; images of one out of two independent experiments. The same WT controls were used in Fig. 2d. Bar graph shows mean ± s.d. of two independent measurements. e, Bar graph shows the frequency of propidium iodide (PI)-positive cells 48 h after 100 μM H2O2 treatment. f, Genomic DNA was extracted from WT and BRCA1f/f MxCre bone-marrow cells from mice treated or not with polyIC. Detection of the WT-, deleted- and floxed alleles of BRCA1 are indicated. g, h, Whole bone-marrow cells of the indicated genotypes were cultured in methylcellulose media supplemented with IL3, IL6 and SCF and the colony numbers were scored between days 8 and 10. WT or ATM−/− cells were transformed with MLL–AF9 as shown in Extended Data Fig. 5a, and blast colony counts (i) and morphology in methylcellulose, May-Grünwald–Giemsa stains (j) were determined 10 days later; images of one out of three experiments. Bar graph shows mean ± s.d. of four independent experiments. k, The frequency of cells identified as blasts in (j) was determined. Data are shown normalized to WT counts (dotted line) in three independent experiments. ln, Three weeks after polyIC treatment of WTMxCre and BRCA1f/f MxCre mice, bone-marrow cells were transformed with MLL–AF9, and blast colony counts (l) and colony morphology (m) were assessed at day 10 after transformation (images of one out of two experiments). Bar graph shows mean ± s.d. of three independent experiments. n, The frequency of cells identified as blasts is shown normalized to WT counts (dotted line) in two independent experiments. o, WT cells transformed with MLL–AF9 (as in Extended Data Fig. 5a) were expanded in semi-solid media, treated with 5 μM of ATMi or vehicle for 48 h, and the frequency of blasts and cells at different stages of differentiation was determined by morphology. p, Cells transformed with MLL–AF9 were treated with 5 μM of ATMi for 48 h, and the frequency of propidium iodide (PI)-positive cells is plotted. q, Cells transformed with MLL–AF9 were treated with 1 μM of ATRi for 24–48 h and the frequency of blasts was determined. One of two representative experiments is shown. Scale bars, 10 μm.
Extended Data Figure 9
Extended Data Figure 9. ROS and DNA damage in ATM- and BRCA1-deficient cells transformed with MLL–AF9
a, b, WT and ATM−/− cells were transformed with MLL–AF9 and the levels of phosphorylated Kap-1 (a) and ROS (detected by staining cells with CellROX Deep Red reagent) (b) were measured 10 days after expansion in semi-solid media. c, d, WT and BRCA1−/− bone-marrow cells were transformed with MLL–AF9 and the levels of phosphorylated Kap1 (c) and ROS (d) were measured 10 days after expansion in semi-solid media. One representative of two independent experiments is shown.
Extended Data Figure 10
Extended Data Figure 10. DNA damage induces p21-dependent differentiation of cells transformed with MLL–AF9
a, b, WT cells were transformed with MLL–AF9-neo. After 2 weeks of selection in neomycin-supplemented media, cells were infected with retroviruses expressing I-Ppo1 or empty vector. b, Eight to ten days after sorting GFP+ cells, the frequency of I-Ppo1 infected cells identified as blasts in the cytospins of Fig. 4d was determined and normalized to the frequency of blasts in empty vector infected cells. c, d, WT cells were transformed with MLL–AF9 and then were infected with a retrovirus containing the inducible restriction enzyme AsiSI-ER-Tet-on. After selection, cells were treated with 4OHT and doxocycline for 24 h and the levels of ROS were measured by CellROX staining. e, f, WT or p21−/− cells were transformed with MLL–AF9. Colony counts (e) and frequency of blasts (morphology in May-Grünwald–Giemsa stains) (f) were determined 8–10 days later. g, h, WT or p21−/− cells were transformed with MLL–AF9 and then infected with a retrovirus containing the restriction enzyme AsiSI. g, After selection, cells were treated with 4OHT and doxocycline for 24 h and the levels of p21 mRNA were measured in WT cells by RT–qPCR. h, p21−/− cells containing AsiSI were treated with 4OHT and doxocycline for 24 h, and γ-H2AX foci (red) and AsiSi-ER staining (green) were examined by immunofluorescence (images of one out of two experiments). i, The number of colonies in WT and p21−/− MLL–AF9 cells 5–7 days after treatment with ATMi. j, Model showing that genome caretakers MLL4, ATM and BRCA1 prevent differentiation by protecting against ROS and DSBs.
Figure 1
Figure 1. Defects in HSC function in the absence of MLL4
Purified HSCs were transplanted into irradiated recipients (details in Extended Data Fig. 3f). Reconstitution levels were monitored in the peripheral blood (PB) (a, b), and the frequency of donor-derived LSK CD34lo cells was determined in the bone marrow at week 14 (c). Bar graphs show mean ± s.d. of four and five WT and MLL4−/− mice, respectively. d, Division pattern of WT or MLL4−/− HSCs (n = 3 experiments, 40–77 randomly selected divisions per experiment, Extended Data Fig. 4c, d for details). e, LSK and LSK CD34lo cells from WT or MLL4−/− mice were stained with an antibody against phosphorylated Kap1 (top) and DCFDA (2′,7′-dichlorofluorescein diacetate; bottom). (*P < 0.05; **P < 0.01; ***P < 0.005; ****P < 0.0001).
Figure 2
Figure 2. MLL4 is required for MLL–AF9-induced leukaemia
a, Kaplan–Meier survival plots of mice injected with WT or MLL4−/− cells transformed with MLL–AF9 (details in Extended Data Fig. 5a). WT (n = 7), MLL4−/− (n = 6). b, Haematoxylin and eosin stain of WT mice at the time of death showing leukaemic cells in the spleen (top ×20) and liver (bottom ×4, zoomed-in for details). Data representative of at least three mice. c, Blast colony count and colony morphology in methylcellulose, May-Grünwald–Giemsa stain (d) of WT or MLL4−/− cells 10 days after MLL–AF9 transformation. Bar graph shows mean ± s.d. of four independent experiments and (d) is representative of three experiments. e, Peripheral blood white cell counts (mean ± s.d. of five mice) and (f) Kaplan–Meier survival plots of mice injected with MLL-AF9 WTMxCre or MLL–AF9 MLL4f/f MxCre cells and subsequently treated with polyIC injections (details in Extended Data Fig. 5b). Blast colony counts (g) (mean ± s.d. of four independent experiments) and colony morphology (h) of EV or CRE-infected MLL4f/f MLL-AF9 cells 10 days after sort (details in Extended Data Fig. 5b; images representative of three independent experiments); EV, empty vector. Scale bars, 10 μm.
Figure 3
Figure 3. MLL4 enforces the differentiation blockade in cells transformed with MLL–AF9 by protecting against ROS and DNA damage
a–c, RNA sequencing (RNA-seq) was performed on WT and MLL4f/f cells transformed with MLL–AF9 5days after CRE infection as in Extended Data Fig. 5b. a, Fewer than 7% of MLL–AF9 direct targets are deregulated in MLL4-deficient cells (FDR > 0.25). b, GSEA shows enrichment of the glutathione detoxification pathway in WT versus MLL4-deficient cells (FDR < 0.05) and (c) downregulation of the FOXO1/3/4 positively regulated genes in MLL4-deficient cells (FDR < 0.05). df, Cells transformed with MLL–AF9 were expanded with or without NAC. Blast colony counts (d) and colony morphology (e) were determined (images representative of two independent experiments). Red crosses show morphological changes characteristic of blasts. f, Distribution of γ-H2AX foci per cell measured by high-throughput microscopy. Arrow indicates that NAC treatment reduces the frequency of MLL4-deficient cells with high numbers of foci. g, Blast colony counts, frequency of blasts (h) and colony morphology (i) determined 10 days after sorting FOXO3- or empty-vector-expressing cells transformed with MLL–AF9 (details in Extended Data Fig. 7l; images representative of three independent experiments). Bar graphs show mean ± s.d. of three independent experiments. Scale bars, 10 μm. j, RNA-seq profile showing that FOXO3 complementation reversed some of the MLL4-dependent deregulated genes included in b and c. Experiments were performed three (gi) or two (j) independent times using the same MLL–AF9 cells expressing FoxO3 or the empty vector.
Figure 4
Figure 4. DNA damage directly induces differentiation of leukaemic cells
The levels of phosphorylated Kap1 (a) and ROS (b), blast colony counts (c) and colony morphology (d) were determined in cells transformed with MLL–AF9 expressing I-Ppo1 or an empty vector (details in Extended data Fig. 10a). Bar graph shows mean ± s.d. of three independent experiments. d, Images were acquired once. eg, WT or p21−/− cells transformed with MLL–AF9 were infected with a retrovirus containing the inducible restriction enzyme AsiSI-ER-Tet-on (details in Extended data Fig. 10c). e, γ-H2AX foci and AsiSI-ER (antibody to ER) staining in WT cells 24 h after treatment with doxocycline and 4OHT. Sixty-five per cent of cells were positive for γ-H2AX foci in WT and p21−/− cells (Extended data Fig. 10h; one representative of two experiments). Frequency of blasts in WT (f) and p21−/− (g) cells with or without the restriction enzyme. h, i, WT and p21−/− MLL–AF9 cells were treated with 5 μM of ATMi or vehicle for 48 h and the frequency of blasts was determined. fi, The frequency of blasts is normalized to vehicle-treated cells in independent experiments.

Comment in

Similar articles

Cited by

References

    1. Magee JA, Piskounova E, Morrison SJ. Cancer stem cells: impact, heterogeneity, and uncertainty. Cancer Cell. 2012;21:283–296. - PMC - PubMed
    1. Nijnik A, et al. DNA repair is limiting for haematopoietic stem cells during ageing. Nature. 2007;447:686–690. - PubMed
    1. Rossi DJ, et al. Deficiencies in DNA damage repair limit the function of haematopoietic stem cells with age. Nature. 2007;447:725–729. - PubMed
    1. Tothova Z, et al. FoxOs are critical mediators of hematopoietic stem cell resistance to physiologic oxidative stress. Cell. 2007;128:325–339. - PubMed
    1. Morin RD, et al. Frequent mutation of histone-modifying genes in non-Hodgkin lymphoma. Nature. 2011;476:298–303. - PMC - PubMed

Publication types

MeSH terms

Substances

Associated data