. 2014 Oct 2;514(7520):54-8.
doi: 10.1038/nature13556. Epub 2014 Jul 30.

Non-cell-autonomous driving of tumour growth supports sub-clonal heterogeneity

Affiliations

Non-cell-autonomous driving of tumour growth supports sub-clonal heterogeneity

Andriy Marusyk et al. Nature. .

Abstract

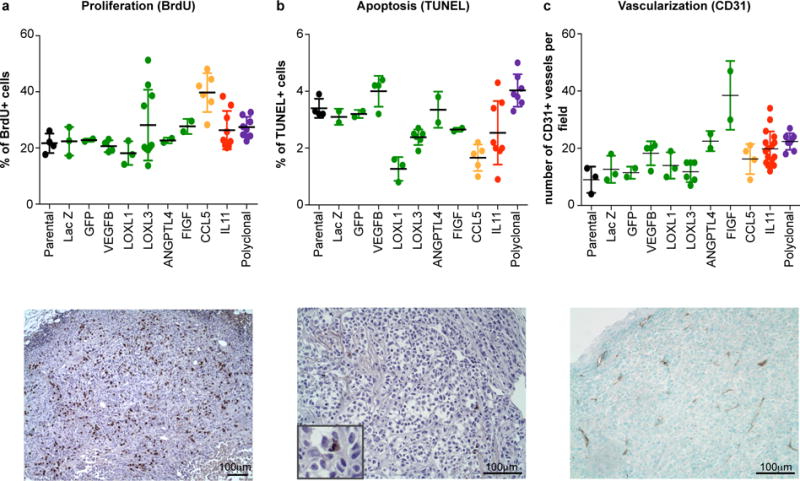
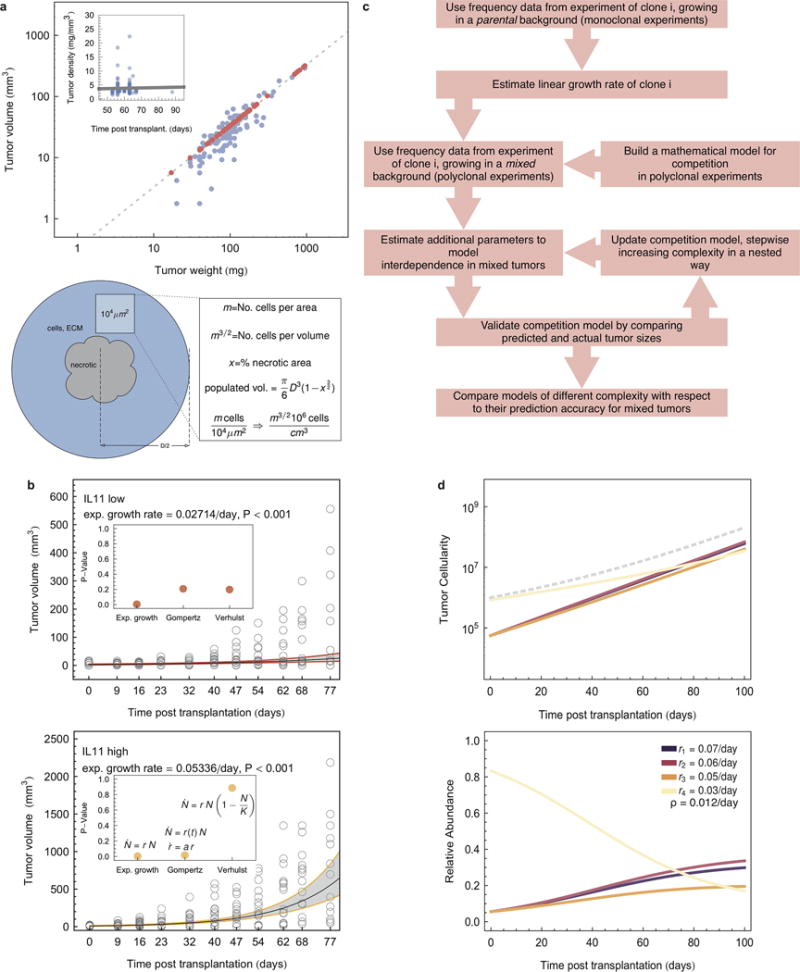
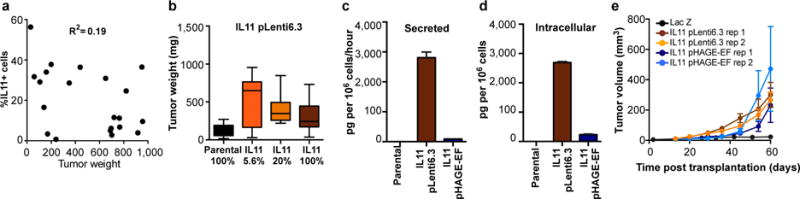
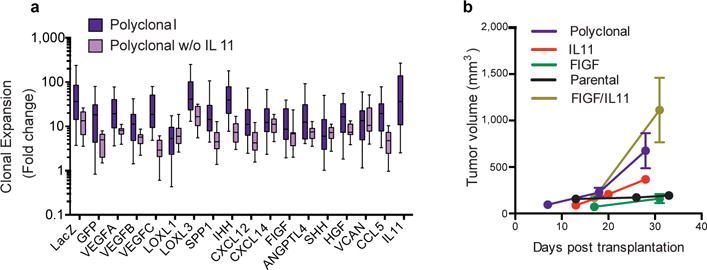
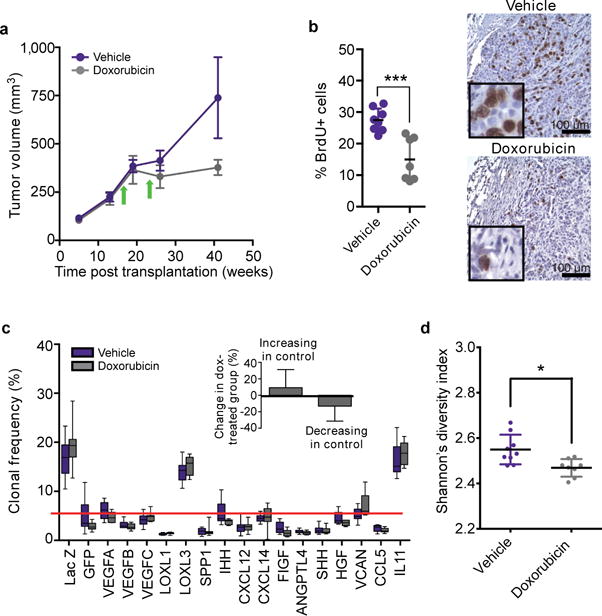
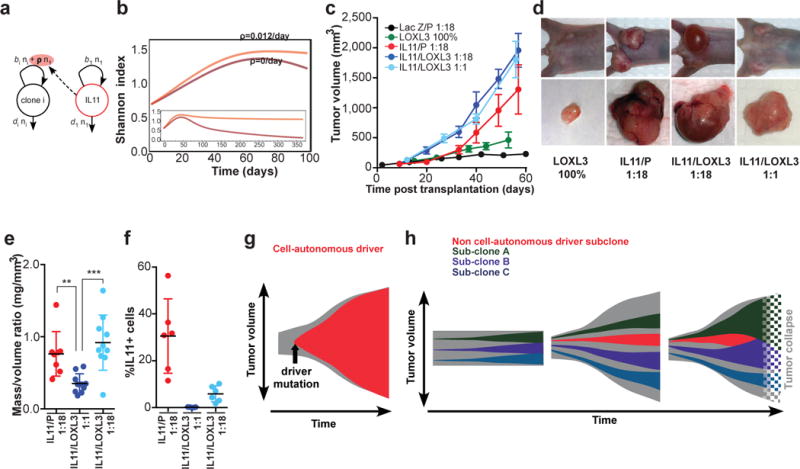
Cancers arise through a process of somatic evolution that can result in substantial sub-clonal heterogeneity within tumours. The mechanisms responsible for the coexistence of distinct sub-clones and the biological consequences of this coexistence remain poorly understood. Here we used a mouse xenograft model to investigate the impact of sub-clonal heterogeneity on tumour phenotypes and the competitive expansion of individual clones. We found that tumour growth can be driven by a minor cell subpopulation, which enhances the proliferation of all cells within a tumour by overcoming environmental constraints and yet can be outcompeted by faster proliferating competitors, resulting in tumour collapse. We developed a mathematical modelling framework to identify the rules underlying the generation of intra-tumour clonal heterogeneity. We found that non-cell-autonomous driving of tumour growth, together with clonal interference, stabilizes sub-clonal heterogeneity, thereby enabling inter-clonal interactions that can lead to new phenotypic traits.


Figures

Extended Data Figure 1
Extended Data Figure 1. Proliferation, apoptosis and vascularization in selected groups
Quantitation and representative pictures of immunohistochemical analysis for markers of a, proliferation, b, apoptosis, and c, vascularization. Each dot represents individual tumor, error bars indicate SD.
Extended Data Figure 2
Extended Data Figure 2. Estimations of clonal frequencies
a, Schematic outline of the quantification of clonal composition based on qPCR. Changes in clonal frequencies are determined based on changes in the ratios of clone-specific and a human-specific reference amplicon between initial mixtures and the resulting tumors. b, Reproducibility of clonality analysis between two different DNA preparations/qPCR from same tumor. c, Correlation between the results obtained using fluorescent cell sorting (FACS) and qPCR based determination of clonal frequency after 6 weeks in vitro culture. Green Fluorescent Protein (GFP) labeled parental cells were mixed with individual sub-clones at initial ratios of 20:1. R indicates goodness of fit of linear regression.
Extended Data Figure 3
Extended Data Figure 3. Mathematical model
a, Upper panel: estimation of tumor volume-density relation. The line represents a linear regression with slope 0.33 (P<0.01). Red dots are predictions for which one value of the pair was missing. Inset: tumor density over time from clone-vs-parental competition experiments (dots), The line represents the linear regression. Tumor density did not correlate with the time of harvest (slope 0.012, P=0.68). Lower panel: schematic of estimation of cell numbers in tumor samples from two dimensional slices. b, tumor volume over time from experimens (empty circles) and linear regression (exponential tumor growth law, black lines), with 0.95 confidence intervals (gray areas). Inset: comparison of P-values using differnt growth laws. c, flow chart of mathematical modeling approach. d, upper panel: growth dynamics under non-cell autonomous driving, according to mathematical model (Model B, see SI), estimated additional effect of IL11 was 0.012/day. Example of four individual sub-clones (e.g. IL11, LOXL3, slow growing CCL5, LACZ), total tumor size indicated by dashed line, lower panel: frequency dynamics for the same set.
Extended Data Figure 4
Extended Data Figure 4. Reproducibility and frequency-independence of tumor-growth promoting effects of IL11
a, Relation between tumor weight and fraction of IL11 sub-clone cells upon tumor harvest. b, Final weights of tumors initiated from the indicated mixtures of IL11 expressing and parental cells using pLenti6.3 backbone; n=21 for the 5.6% IL11, n=10 for the other groups. c, Secreted (pg per 106 cells per hour) and d, Intracellular (pg per 106 cells) levels of IL11 protein determined by ELISA in parental cells and in the IL11-expressing clones derived using the indicated lentiviral constructs. e, Growth kinetics of tumors initiated by transplantation of mixtures containing IL11-expressing cells from the indicated backbones competing with the parental cells.
Extended Data Figure 5
Extended Data Figure 5. IL11 in clonal cooperation
a, Expansion (fold change over initial number of cells) of indicated sub-clones in the polyclonal tumors initiated with/without IL11 sub-clone, n=10/group. b, Growth curves of the tumors initiated by transplantation of the indicated groups, IL11+FIGF indicates tumors initiated by 1:1 mixtures of IL11 and FIGF sub-clones.
Extended Data Figure 6
Extended Data Figure 6. The effects of doxorubicin on tumor growth and clonal composition
a, Tumor growth. b, assessment of cell proliferation by BrdU staining, and c, clonal composition of tumors initiated by polyclonal mixtures followed by treatment of the animals bearing established tumors with vehicle control or doxorubicin, arrows mark intraperitoneal injections of doxorubicin (5mg/kg) or vehicle. The insert in c quantifies changes in frequency of clones expanding and shrinking compared to the initial frequencies. Interaction factor for 2-way ANOVA between control and doxorubicin groups is statistically significant (p=0.0059). d, Shannon index for clonal diversity of vehicle and doxorubicin treated tumors, * indicates p<0.05 in two-sample Kolmogorov-Smirnov test.
Extended Data Figure 7
Extended Data Figure 7. Validation of IL11Rα shRNA
Since the commercially available IL11Rα antibodies are not sufficiently sensitive to detect endogenous IL11Rα protein in the MDA-MB-468 cells, we tested the ability of shRNA to down-regulate the expression of exogenously expressed IL11Rα. Cells overexpressing IL11Rα were stably transduced with IL11Rα-targeting shRNAs and the expression of IL11Rα and -actin (loading control) were analyzed by immunoblotting.
Extended Data Figure 8
Extended Data Figure 8. The effects of IL11 on the tumor microenvironment
a, Collagen organization in parental and IL11 expressing tumors. Representative images of collagen structure (blue) in the indicated tumors as determined by tri-chrome staining. b, Smooth muscle actin positive (SMA) stromal cells in control and Il11 expressing tumors. Representative images of immunohistochemical staining for SMA.
Extended Data Figure 9
Extended Data Figure 9. IL11 cells are not specifically eliminated in IL11/LOXL3 tumors
a, Immunofluorescence analysis of apoptosis in 1:1 IL11/LOXL3 tumors. Apoptotic marker cleaved Caspase 3 (yellow) indicates lack of increase in apoptosis in IL11 (red, V5+) cells bordering LOXL3 (V5−, as LOXL3 cDNA has a stop codon prior to the tag). Grey dashed line demarcates the border of the necrotic area, where most of cell death occurs. b, Occasional IL11+ cells (indicated by arrows) could still be detected in the remnants of 1:18 IL11/LOXL3 tumors.
Figure 1
Figure 1. Experimental system
a, Growth of tumors upon fat pad transplantation of indicated cell lines, n=10/group, error bars indicate SEM. b, Representative images of indicated staining. Arrows indicate necrotic areas. c, Experimental scheme.
Figure 2
Figure 2. Polyclonality affects tumor phenotypes
a, Tumor growth kinetics. b, Tumor weights. c, Sub-clones frequencies within tumors. Red line indicates initial frequency. d, Expansion (fold change over initial cell number) of sub-clones and parental cells from monoclonal tumors shown in c. e, Tumor growth kinetics and weights (inset). f, Representative images of tumors. g, Live fluorescent microscopy images of tumor cells (mCherry+) in tissues.*, ** and *** indicate p<0.05, p<0.01 and p<0.001, respectively of Student’s t test (a, c, e) or ANOVA multiple group comparison against parental (b) or LacZ (d) with Dunnet’s connection. Error bars indicate SEM.
Figure 3
Figure 3. IL11 drives tumor cell proliferation via microenvironmental changes
a, Quantitation and representative images of anti-BrdU immunohistochemical staining in control and IL11-driven tumors. b, Tumor volumes 31 days post transplantation of parental MDA-MB-468 cells, cells over-expressing or down-regulated IL11Rα n=5/group c, Tumor weights of contra-lateral parental and IL11 expressing tumors formed by indicated cell lines. d, Levels of expression of IL11Rα mRNA in indicated cell lines, normalized to MDA-MB-468. e, Quantitation of average number of CD31+ vessels/field and tumor volumes. f, Representative images of anti-CD31 immunohistochemical staining. *, ** and *** indicate p<0.05, p<0.01 and p<0.001, respectively of unpaired (a, b, e) or paired (c) student’s t-test. Error bars indicate SEM.
Figure 4
Figure 4. Impact of IL11 on clonal dynamics
a, Outline of the linear model that best explains polyclonal dynamics (see SI): b, Prediction of diversity over time without (dark) or with (light) non-cell autonomous driver. c, Rumor growth kinetics n=10/group, d, Representative images e, Weight/volume ratios of tumors in c–e excluding cyst fluid, each dot represents individual tumor. ** and *** indicate p<0.01 and p<0.001, respectively; error bars indicate SEM, f, Final population frequencies of IL11+ cells in the indicated tumors. g, Models of cell-autonomous and, h, non-cell autonomous driving of tumor growth.

Comment in

  • Minor clone may drive cancer growth.
    [No authors listed] [No authors listed] Cancer Discov. 2014 Oct;4(10):1109-10. doi: 10.1158/2159-8290.CD-NB2014-126. Epub 2014 Aug 14. Cancer Discov. 2014. PMID: 25274666 No abstract available.

References

    1. Greaves M, Maley CC. Clonal evolution in cancer. Nature. 2012;481:306–313. - PMC - PubMed
    1. Nowell PC. The clonal evolution of tumor cell populations. Science. 1976;194:23–28. - PubMed
    1. Fearon ER, Vogelstein B. A genetic model for colorectal tumorigenesis. Cell. 1990;61:759–767. - PubMed
    1. Gerlinger M, et al. Intratumor heterogeneity and branched evolution revealed by multiregion sequencing. N Engl J Med. 2012;366:883–892. - PMC - PubMed
    1. Landau DA, et al. Evolution and impact of subclonal mutations in chronic lymphocytic leukemia. Cell. 2013;152:714–726. - PMC - PubMed

Publication types