. 2015 Jan 7;4(1):87-97.
doi: 10.1002/adhm.201400264. Epub 2014 Jul 31.

A pharmacokinetic model of a tissue implantable insulin sensor

Affiliations

A pharmacokinetic model of a tissue implantable insulin sensor

Gili Bisker et al. Adv Healthc Mater. .

Abstract

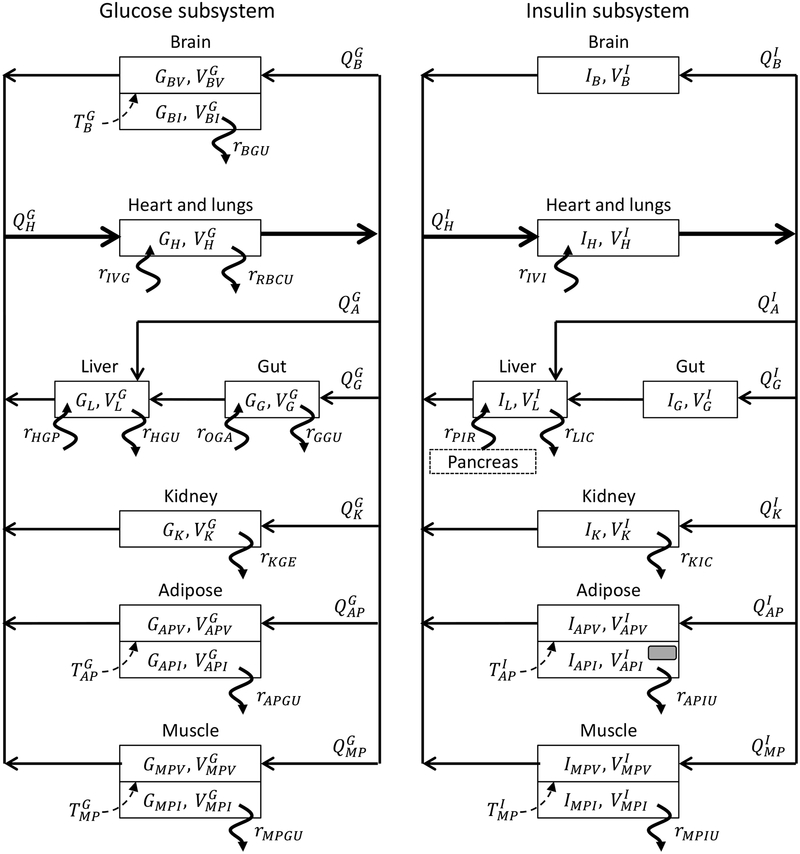
While implantable sensors such as the continuous glucose monitoring system have been widely studied, both experimentally and mathematically, relatively little attention has been applied to the potential of insulin sensors. Such sensors can provide feedback control for insulin infusion systems and pumps and provide platforms for the monitoring of other biomarkers in vivo. In this work, the first pharmacokinetic model of an affinity sensor is developed for insulin operating subcutaneously in the limit of where mass transfer across biological membranes reaches a steady state. Using a physiological, compartmental model for glucose, insulin, and glucagon metabolism, the maximum sensor response and its delay time relative to plasma insulin concentration, are calculated based on sensor geometry, placement, and insulin binding parameters for a sensor localized within adipose tissue. A design relation is derived linking sensor dynamics to insulin time lag and placement within human tissue. The model should find utility in understanding dynamic insulin responses and forms the basis of model predictive control algorithms that incorporate sensor dynamics.

Keywords: insulin sensors; single-walled carbon nanotubes.


Figures

Figure 1.
Figure 1.
Illustration of a prototypical optical sensor for insulin implanted in the interstitial subcutaneous adipose tissue. (a) The detection consists of a near infrared fluorescent sensor encapsulated in a hydrogel that is implanted within adipose tissue along with a dermal patch providing optical excitation and collection through the interposed tissue with detection read telemetrically. (b) The sensor is placed at a fixed depth into subcutaneous adipose tissue where (c) the external dermal patch provides optical excitation through the tissue, querying the sensor for insulin concentration, and receiving a proportional emission signal back through the tissue for collection at the patch.
Figure 2.
Figure 2.
Compartmental model for glucose (left) and insulin (right) metabolism. The heart and lung compartment represents the cardiopulmonary blood and the major arteries and drain the entire circulatory loop. The arterial blood feeds the capillaries in the gut, liver, kidney, peripheral adipose and muscle tissues, while the liver also receives blood from the hepatic portal vein originating in the gut. The brain in the glucose subsystem and the peripheral adipose and muscle tissues in both the glucose and insulin subsystems, are divided into capillary and interstitial volumes to account for longer transcapillary diffusion times. The insulin sensor represented by a grey rectangle is embedded within the peripheral interstitial adipose volume. See Table 1 for an explanation of each variable.
Figure 3.
Figure 3.
Oral glucose absorption rate by the gut for Tmax > 0 (solid line), for Vmax′ = Vmax (dashed line) and for Vmax′ < Vmax (dashed-dotted line).
Figure 4.
Figure 4.
Implantable insulin sensor schematic. Blood flows in the peripheral adipose vasculature with rate QAPI from which insulin diffuses into the interstitial tissue of volume VAPII resulting in transient insulin concentration of IAPI within this volume. Insulin diffuses into the hydrogel of thickness L, resulting in transient insulin concentration of CIh within the gel. Insulin sensors are dispersed throughout, having total insulin binding site concentration of θT, and encapsulated in the hydrogel, where insulin is in equilibrium between free and bound state with a dissociation constant Kd.
Figure 5.
Figure 5.
Glucose, insulin and glucagon concentrations in the various body compartments following a 100 g glucose meal at t = 0 according to our model. (a) – (j) Glucose concentration in (a) Brain vasculature, (b) Brain interstice, (c) Heart and lungs, (d) Kidney, (e) Liver, (f) Gut, (g) Muscle periphery vasculature, (h) Muscle periphery interstice, (i) Adipose periphery vasculature, and (j) Adipose periphery interstice. (k) – (s) Insulin concentration in (k) Brain, (l) Heart and lungs, (m) Kidney, (n) Liver, (o) Gut, (p) Muscle periphery vasculature, (q) Muscle periphery interstice, (r) Adipose periphery vasculature, and (s) Adipose periphery interstice. (t) Normalized glucagon concentration in plasma.
Figure 6.
Figure 6.
(a) Insulin concentration within hydrogel encapsulating SWNT insulin sensors, implanted in the subcutaneous adipose tissue, for gel thickness of L = 0.5 mm, Thiele modulus ϕ = 50, diffusion coefficient D = 1×10⁻⁶ cm2s−1, dissociation constant Kd = 8.3μM, and rate constant k = 1×10⁵ M−1s−1 following a 100 g glucose meal according to our model. (b) Averaged insulin concentration within the hydrogel (dashed blue curve), averaged bound insulin concentration (blue curve), and sensor response (green curve).
Figure 7.
Figure 7.
Insulin sensor delay time (blue curve) with respect to the surrounding tissue concentration and the maximum sensor response (green curve) as a function of (a) the hydrogel thickness, (b) the dissociation constant of the insulin – sensor reaction, and (c) the rate constant of the insulin – sensor reaction, following a 100 g glucose meal according to our model. The arrows direct each curve to its corresponding y-axis.

References

    1. Bascones-Martinez A, Matesanz-Perez P, Escribano-Bermejo M, Gonzalez-Moles MA, Bascones-Ilundain J, Meurman JH, Med Oral Patol Oral Cir Bucal 2011, 16, e722–729. - PubMed
    1. Binder C, Lauritzen T, Faber O, Pramming S, Diabetes Care 1984, 7, 188–199; - PubMed
    2. Li J, Kuang Y, Math Biosci Eng 2009, 6, 41–58. - PMC - PubMed
    1. Bergenstal RM, Tamborlane WV, Ahmann A, Buse JB, Dailey G, Davis SN, Joyce C, Peoples T, Perkins BA, Welsh JB, Willi SM, Wood MA, New England Journal of Medicine 2010, 363, 311–320. - PubMed
    1. Bennett CM, Guo M, Dharmage SC, Diabetic Medicine 2007, 24, 333–343. - PubMed
    1. Battelino T, Conget I, Olsen B, Schütz-Fuhrmann I, Hommel E, Hoogma R, Schierloh U, Sulli N, Bolinder J, Diabetologia 2012, 55, 3155–3162; - PMC - PubMed
    2. Gifford R, ChemPhysChem 2013, 14, 2032–2044. - PubMed

Publication types