

Quantifying hypoxia-induced chemoreceptor sensitivity in the awake rodent
- PMID: 25080926
- PMCID: PMC4187053
- DOI: 10.1152/japplphysiol.00484.2014
Quantifying hypoxia-induced chemoreceptor sensitivity in the awake rodent
Abstract
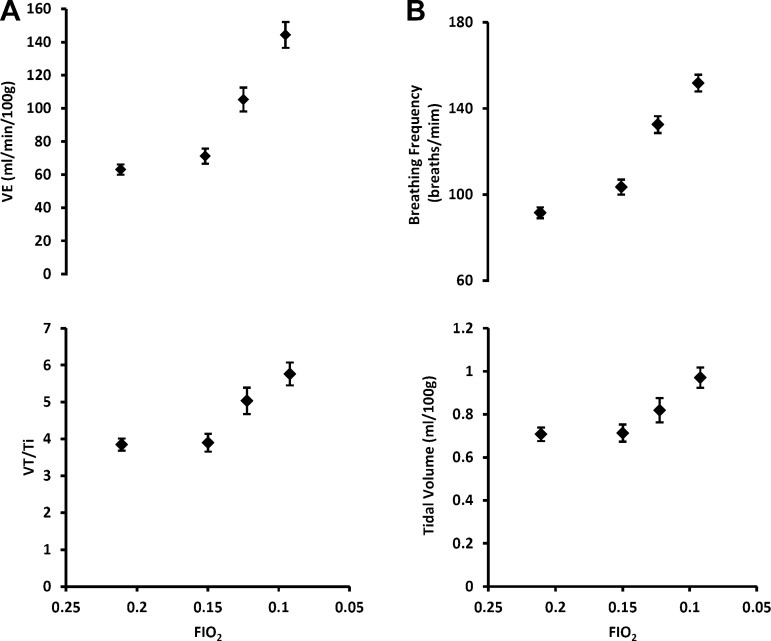
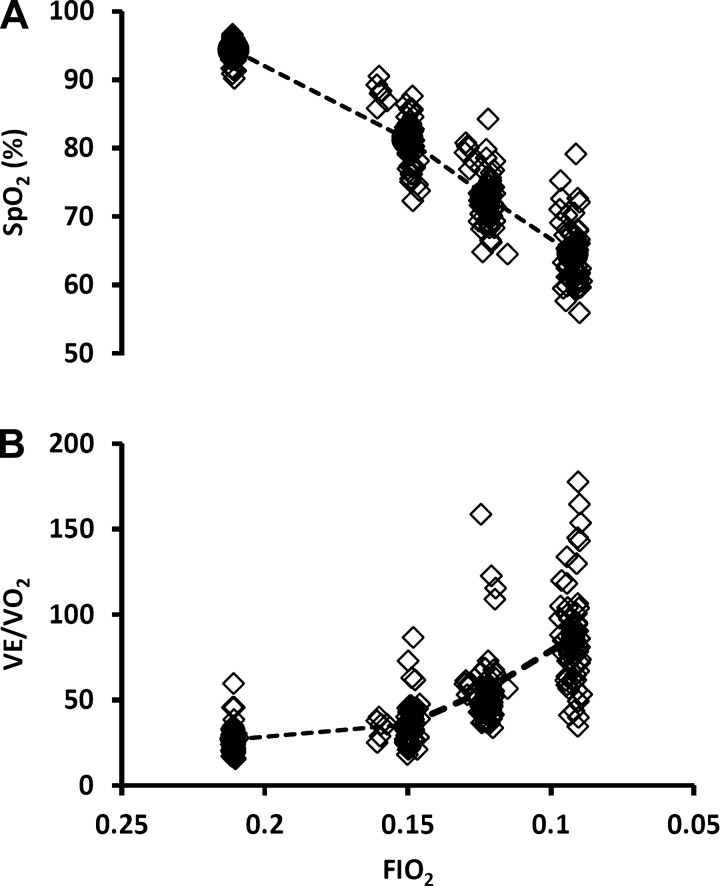
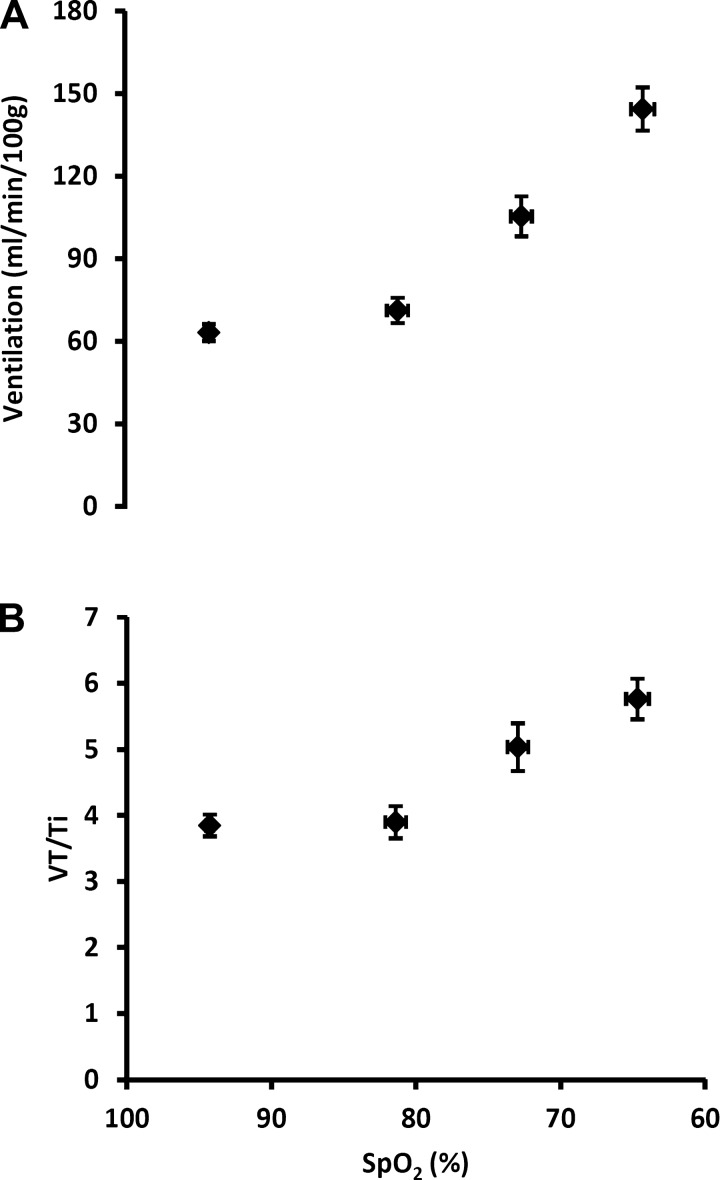
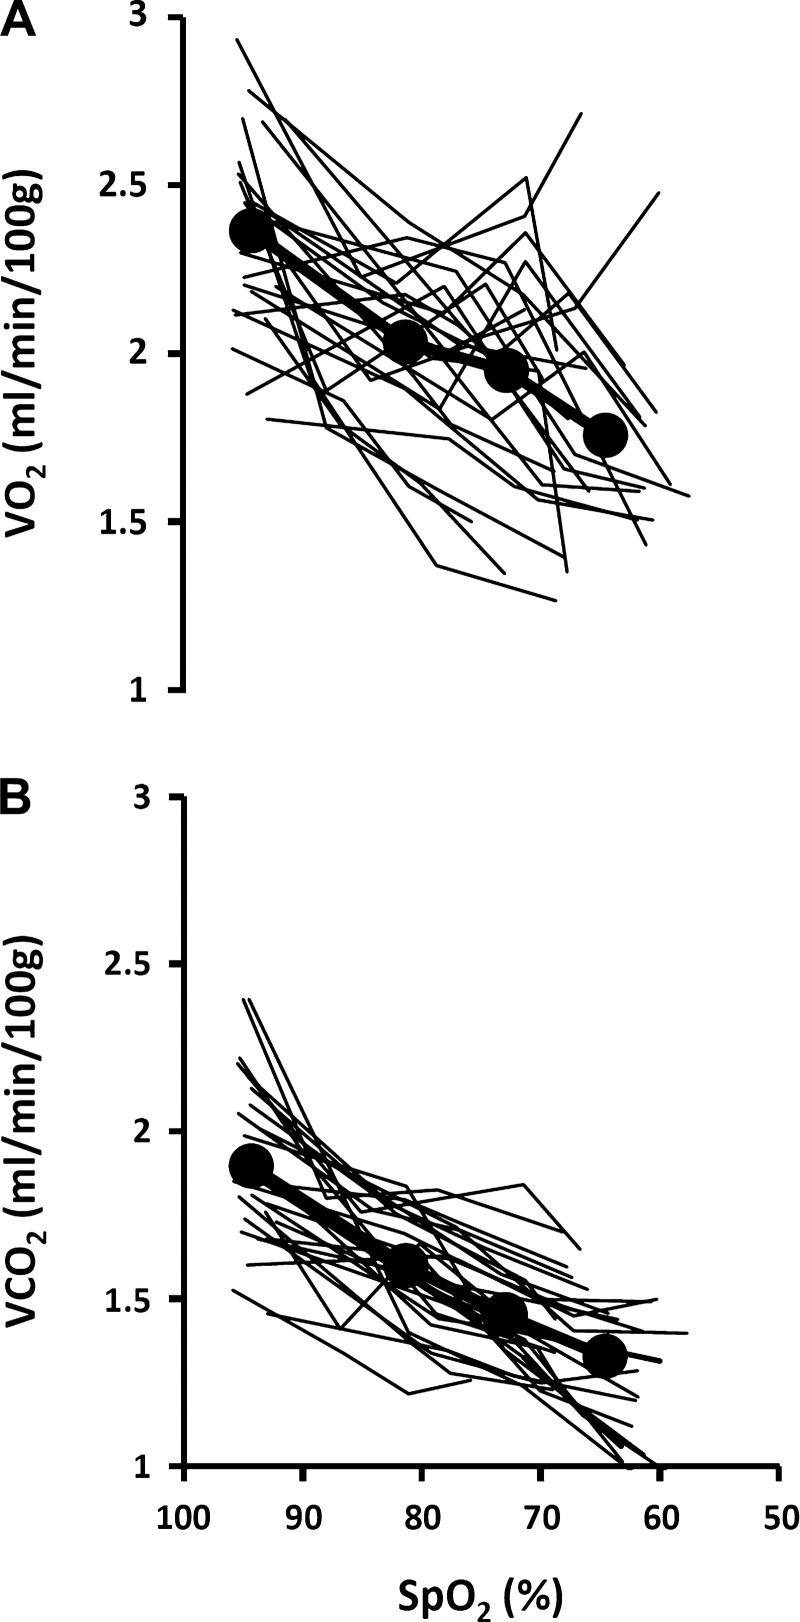
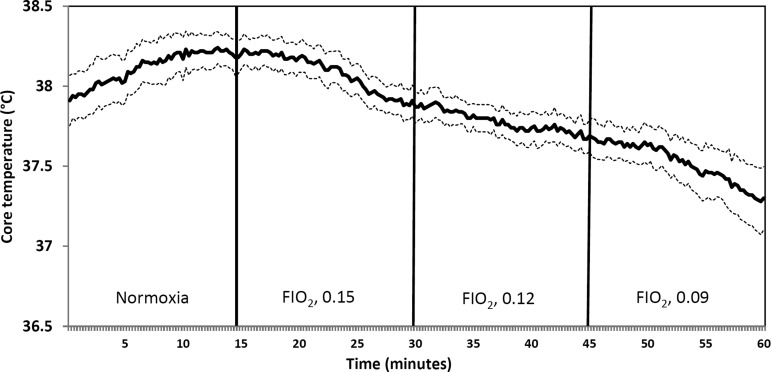
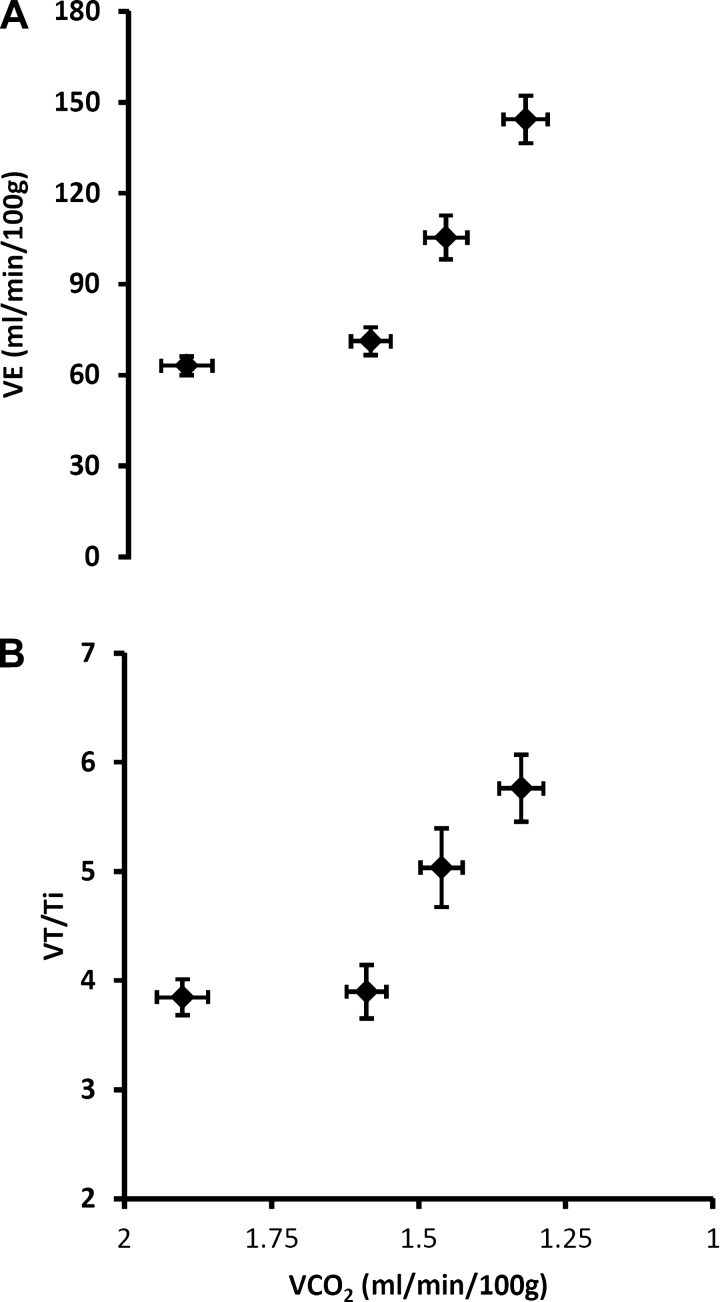
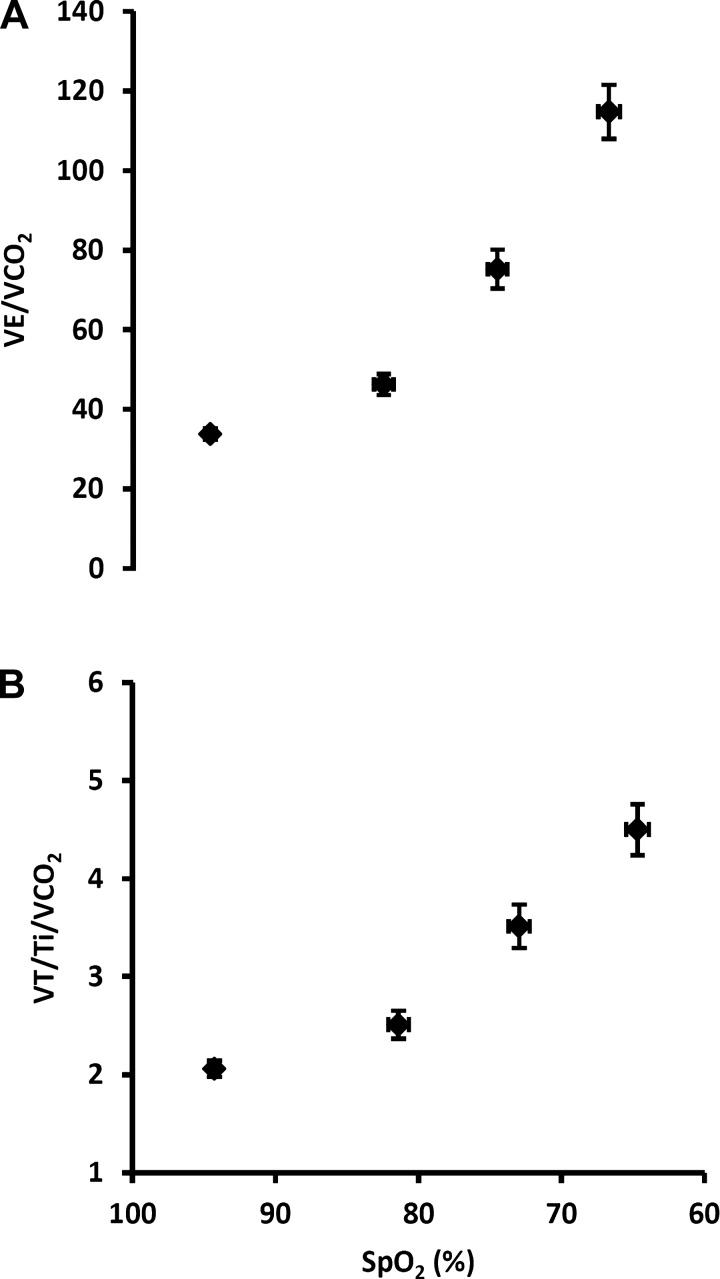
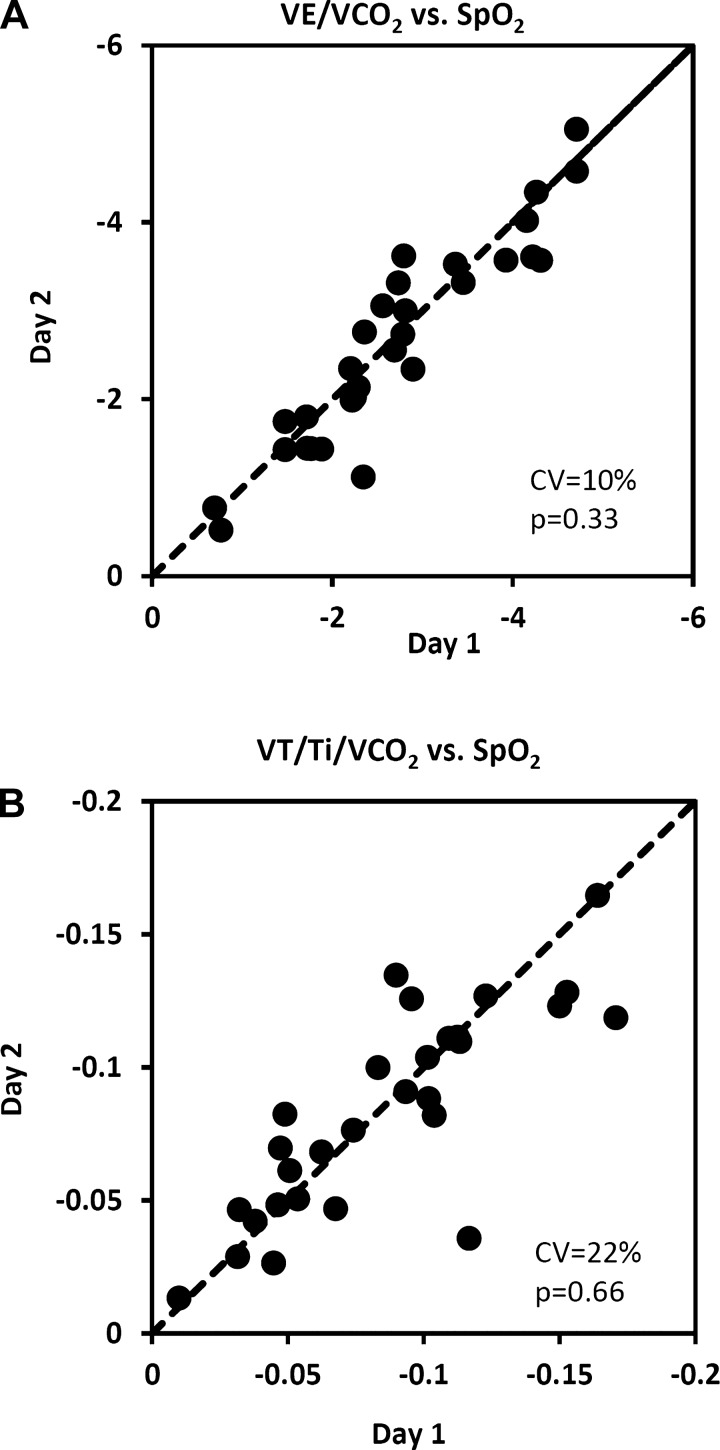
We evaluated several methods for characterizing hypoxic chemosensitivity in the conscious rat. Adult Sprague-Dawley rats (n = 30) were exposed to normobaric hypoxia [inspired oxygen fraction (Fio2) 0.15, 0.12, and 0.09]. We measured ventilation (V̇e; barometric plethysmography), arterial oxygen saturation (SpO2; pulse oximeter), and oxygen consumption and carbon dioxide production (V̇o2 and V̇co2; analysis of expired air). Linear regression analysis was used to define stimulus-response relationships. Testing was performed on 2 days to assess day-to-day reproducibility. Exposure to graded, steady-state hypoxia caused progressive reductions in SpO2 that were, for any given Fio2, quite variable (SpO2 range, 20-30%) among individuals. Hypoxia produced progressive increases in V̇e caused by increases in both tidal volume (VT) and breathing frequency. Hypoxia also increased the VT:inspiratory time (Ti) ratio, an indicator of central respiratory "drive." Hypoxia caused consistent, progressive declines in V̇o2, V̇co2, and core temperature (>20% at the lowest SpO2). We propose that optimal quantification of carotid chemoreceptor hypoxic sensitivity in the unanesthetized rodent should employ SpO2 [a surrogate for arterial Po2 (PaO2 )] as the stimulus variable and the ventilatory equivalent for V̇co2 (V̇e/V̇co2) and/or mean inspiratory flow rate (VT/Ti) normalized for V̇co2 as the response variables. Both metrics take into account not only the important influence of a falling metabolic rate, but also SpO2, which represents the hypoxic stimulus at the carotid body. Because of the somewhat curvilinear nature of these responses, exposure to multiple levels of graded hypoxia provides the most complete characterization of hypoxic chemosensitivity.
Keywords: chemoreflex; hypoxic ventilatory response; metabolic rate.
Copyright © 2014 the American Physiological Society.
Figures
Comment in
-
Comments on "Quantifying hypoxia-induced chemoreceptor sensitivity in the awake rodent" by Morgan et al.J Appl Physiol (1985). 2014 Dec 15;117(12):1524. doi: 10.1152/japplphysiol.00887.2014. J Appl Physiol (1985). 2014. PMID: 25512068 No abstract available.
-
Reply to Joseph.J Appl Physiol (1985). 2014 Dec 15;117(12):1525. doi: 10.1152/japplphysiol.00893.2014. J Appl Physiol (1985). 2014. PMID: 25512069 No abstract available.
References
-
- Bisgard GE, Forster HV, Orr JA, Buss DD, Rawlings CA, Rasmussen B. Hypoventilation in ponies after carotid body denervation. J Appl Physiol 40: 184–190, 1976 - PubMed
-
- Brunner MJ, Sussman MS, Greene AS, Kallman CH, Shoukas AA. Carotid sinus baroreceptor reflex control of respiration. Circ Res 51: 624–636, 1982 - PubMed
-
- Cannon B, Nedergaard J. Brown adipose tissue: function and physiological significance. Physiol Rev 84: 277–359, 2004 - PubMed
-
- Casaburi R, Whipp BJ, Wasserman K, Beaver WL, Koyal SN. Ventilatory and gas exchange dynamics in response to sinusoidal work. J Appl Physiol 42: 300–301, 1977 - PubMed
Publication types
MeSH terms
Grants and funding
LinkOut - more resources
Full Text Sources
Other Literature Sources