Review
. 2014 Aug 1:77:29.10.1-29.10.30.
doi: 10.1002/0471140864.ps2910s77.

Tetra detector analysis of membrane proteins

Affiliations
Review

Tetra detector analysis of membrane proteins

Larry J W Miercke et al. Curr Protoc Protein Sci. .

Abstract

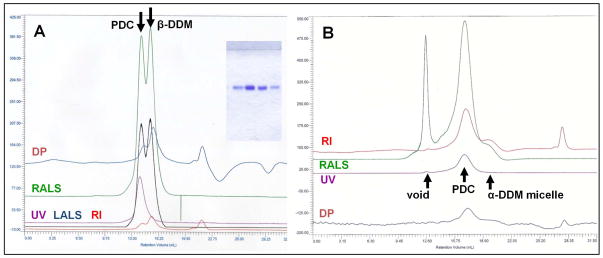
Well-characterized membrane protein detergent complexes (PDC) that are pure, homogenous, and stable, with minimized excess detergent micelles, are essential for functional assays and crystallization studies. Procedural steps to measure the mass, size, shape, homogeneity, and molecular composition of PDCs and their host detergent micelles using size-exclusion chromatography (SEC) with a Viscotek Tetra Detector Array (TDA; absorbance, refractive index, light scattering, and viscosity detectors) are presented in this unit. The value of starting with a quality PDC sample, the precision and accuracy of the results, and the use of a digital benchtop refractometer are emphasized. An alternate and simplified purification and characterization approach using SEC with dual absorbance and refractive index detectors to optimize detergent and lipid concentration while measuring the PDC homogeneity is also described. Applications relative to purification and characterization goals are illustrated as well.

Keywords: differential pressure viscometer; intrinsic viscosity; membrane proteins; refractive index; tetra detector array and analysis.


Figures

Figure 1
Figure 1
Workflow from membranes to quality membrane protein. Following over-expression, the production of quality membrane protein starts with Membrane Preparation, and moves through Solubilization, Purification & Characterization and protein Concentration. In addition to purification, SEC with ion exchange (or other binding matrices) serves a crucial role in systematically working through the seven Key Parameters (top right) to find buffer conditions that maintain a single Gaussian peak shape at low and high protein concentrations. Since PDC oligomerization is one of the major problems encountered during purification, key to this approach is analyzing all protein fractions generated throughout the purification by SEC. Absorbance (200–600 nm) detection is used initially for purification, and is followed by dual absorbance and refractive index detection to optimize the micelle concentration while following PDC homogeneity. Dual and Tetra Detector Analysis is used during purification post SEC and/or ion exchange (IE), and during Concentration. Once the sample is pure, homogenous and stable with minimized detergent it goes to Function and Crystallization experiments. Thin layer chromatography (TLC) is used for lipid and detergent analysis, and mass spectrometry (MS) is used to measure protein molecular weights. Three chromatography workstations with computer interfaces are simultaneously used: 1) an affinity (usually Ni-NTA) station with absorbance detector, manual fraction collection and gravity flow; 2) a dual pump SE and IE station with diode array absorption and refractive index detectors, auto sampler and fraction collector; and 3) a TDA station.
Figure 2
Figure 2
Description of Viscotek’s Tetra Detector Array. Tetra Detection is composed of an absorbance detector for quantifying protein weight concentration (CUV) according to their extinction coefficient (dA/dc) and absorbance (UV), and a differential refractometer for quantifying concentration of all molecules (CRI) at 660 nm according to their specific refractive index increment (dn/dc) and refractive index (RI), and the solvent refractive index (RIsol). The weight averaged mass (Mavg) detector uses a 670 nm LED laser to measure static light scattering (LS) at 90° (Right Angle LS) and/or 7° (Low Angle LS); however, due to lower sensitivity and S/N at 7°, LALS is usually not used. Kopt is an optical constant and is dependent on the laser wavelength λ and Avogadro’s number NA. The RALS detector, which is valid for essentially all proteins and PDCs, can accurately measure molar Mavg for molecules that have an averaged diameter of less than ~30 nm (< 1/20 of λ670nm = 33 nm). Detector response or calibration factors (KUV, KLS and KRI) are measured using a stable protein with defined M, dn/dc and dA/dc. The fourth detector is an absolute differential viscometer for measuring differential pressure (DP) and calculating molecular shape or intrinsic viscosity (IV). For proteins, IV can vary from 0.017 dl/g for globular shapes to 0.355 dl/g for elongated shapes to 0.499 dl/g for denatured or random shapes (Scheraga & Mandelkern 1953, Dutta et al 1991, Chenal et al 2009).
Figure 3
Figure 3
TDA equations used by OmniSEC for the analysis of a two-component, single scattering particle. Summary of the (A) required input parameters and (B) broken down equations used by Viscotek’s OmniSEC software to analyze a two-component, single scattering molecule like a PDC. Equations for the results are based on each 5 Hz slice i (left side), and then integrated throughout the whole or partial peak as a weighted average w (right side). (C) Polydispersity (Pd) in mass equals the weighted mass average (Mw) divided by the number mass average (Mn), with a value of 1.000 representing a 100% monodisperse or homogenous distribution.
Figure 4
Figure 4
Examples of OmniSEC output tables at different stages during the TDA analysis of the PDC presented in the Basic Protocol. (A) Calibrated and (B) Executed Individual mdHP K Method outputs for a single Ovalbumin injection (Step 2). (C) Executed RI mdHP Area Method output for a single DDM injection using the SEC measured dn/dc (Step 3). (D) Executed PDC mdCP Method output for a single PDC injection (Step 4). Types of output files or Reports are extensive, and are at the discretion of the user.
Figure 5
Figure 5
Measuring TDA detector calibration factors. Five different column injections of Ovalbumin where performed to measure averaged detector response factors K, and Ovalbumin’s IV, Rh and Mw/Mn. (A) TDAgram of 0.6 mg (100 μl) Ovalbumin injected onto a TSK column using 20 mM Hepes, 100 mM NaCl, 1 mM DDM, pH 7.4 running buffer at 0.6 ml/min. Tables summarizing (A) Ovalbumin input parameters, (B) measured Ks and (C) Ovalbumin properties, respectively. The highly reproducible profiles (Ks have errors less than 0.3%, and shape and size errors are less than 1%) prove that the standard is stable with no column interactions in this buffer/column combination.
Figure 6
Figure 6
Measuring detergent dn/dc and micelle properties using TDA. DDM TDAgrams where collected as in Figure 4. (A) RI overlays of 10 out of 16 different DDM injections ranging from 20 to 100 μl and −0.05 to 1.970 mg DDM/injection. The second negative RI peak represents the inclusion limit and is due to a slight mismatch of Hepes and/or NaCl concentrations between the sample and column buffers. (B) Plot of DDM mass (g) verses RI area (mvml), and a calculated dn/dc (= slope × (RIsol/KRI)) of 0.130 ml/g (N = 16). (C) Table summarizing measured properties of DDM micelles. There is a good dn/dc fit and errors for micelle calculations are less than 3%. The micelle is spherical with a Mavg of 90,000 Da and perfectly homogenous.
Figure 7
Figure 7
Measuring PDC properties using TDA. (A) Table of PDC results averaged from five different column injections performed as in Figure 4. (B) PDC input parameters. (C) TDAgram of a 150 μl injection containing 0.71 mg PDC in column buffer. By comparing the RI retention time of the PDC and DDM micelle control (↓ and Figure 5), the concentrated sample contains no excess micelles. (D) RI peak (red) contained within integration limits overlaid with measured mass (black) at each 5hz data point. Since the final peak is a weighted average according to intensity, the mass averaged from the total peak of 5 different injections is precise to less than 0.5%. (E) SDS-PAGE profile of PDC used for the injections shows that it is a pure heterodimer; two different heavy loads on the left and two different light loads on the right flank the center lane of standards. Even though all of the data sets for this experiment are precise, the PDC mass maps to 1.19 dimers/PDC indicating a 19% error in accuracy due to the values of one or more PDC and calibration input parameters (Figure 3). For this pure, homogenous, stable and globular shaped PDC sample, each dimer is bound to 220 DDM molecules with minimized detergent. Such samples represent our Gold Standard for quality and well-characterized PDCs.
Figure 8
Figure 8
Dual UV and RI analysis of two PDCs and their host detergent OG. UV (purple traces) and RI (red traces) SDX chromatograms of (A) 40 μl concentrated tAqp4 and (B) 1.97 mg of it’s host detergent OG (75 μl, 90 mM). The tAqp4/OG PDC is highly homogenous (Gaussian UV and RI peaks) and contains 10.5 mM (0.122 mg) excess OG. The tAqp4 sample was concentrated to about 40 mg/ml using a 50 kDa cut-off filter, and then diluted two fold with identical buffer containing no detergent. Running buffer was 25 mM citrate, 50 mM NaCl, 5% (v/v) glycerol, 40 mM OG, pH 6.0, 2 mM DTT. Since the PDC and excess micelles are baseline resolved, the sample can be concentrated before running SEC and is ideal for a complete TDA experiment. Similar samples were ultimately used for complete TDA analysis (not shown), and for successful function and structure studies (Ho et al., 2009). SDX profiles of (C) 20 μl of ~ 16 mg/ml PDC and (D) 2.92 mg (100 μl, 100 mM) of its host detergent OG. The PDC is optical homogenous (Gaussian UV peak) and contains about 270 mM OG (1.6 mg), but since the micelle and PDC co-elute, it is not a good sample for TDA. The PDC sample was concentrated to about 16 mg/ml using a 50 kDa cut-off filter, and running buffer was 20 mM MES, 100 mM NaCl, 40 mM OG, pH 6.0, 2 mM DTT. Excess micelles were ultimately removed by ion exchange allowing for complete TDA analysis (not shown). Insets are the Coomassie stained SDS-PAGE profiles of each injected PDC showing that they are pure, and that their depicted oligomeric states (verified by antibody staining) are affected by the SDS assay conditions.
Figure 9
Figure 9
Refractive index (nD) of water verses temperature using a RXA156 refractometer. To test the capabilities of the Anton Paar Abbemat RXA156 (λ = 589.29 nm), water temperature profiles from 10 to 26°C in 2° increments were measured starting with 20° calibration shown in blue and 10°C calibration shown in green. For comparison and validity, the original 589.29 nm calibration data from is shown in red (Tilton and Taylor, 1938). The RXA156 was calibrated using water (1.333690/10°C; 1.332988/20°C). A single 150 μl water sample was used for each temperature curve, and re-equilibration time between temperatures was 2 min. 13–17 data points where automatically collected every 5 sec for each temperature, with standard deviations of 0.000001 for all temperatures. Data for all three curves fit well to a 2nd order polynomial: (red) y = −0.0000019x2 − 0.0000110x + 1.3339897, R2 = 0.9999305; (blue) y = −0.000002x2 − 0.000022x + 1.334188, R2 = 0.999905; (green) y = −0.000002x2 − 0.000018x + 1.334077, R2 = 0.999905. The water standards are valid, and for the most accurate results, the RXA156 should be calibrated with water at the temperature used for sample measurements.
Figure 10
Figure 10
Measuring dn/dc of Ovalbumin and detergent using a RXA150 refractometer at 10°C. (A) dn/dc measurements of Ovalbumin from 0–2 mg/ml in 20mm Hepes, 150 mM NaCl, pH 7.0 with (shown) and without (7 data points) 0.1 mM TFA-1. The detergent TFA-1 was provided by Pil Chae and Sam Gellman (Chae et al 2010). (B) dn/dc measurements of Ovalbumin from 0–2.5 mg/ml in 25 mM Na citrate and 50 mM NaCl, pH 6.0 (A) with (shown) and without (7 data points) 40 mM OG. Using the same solutions, the dn/dc plot with OG was repeated (+ OG repeat; 8 data points). 2 mg/ml and 2.5 mg/ml stocks were first made using the appropriate 1x buffers, and then diluted again with 1x buffer to make each Ovalbumin concentration. (C) OG dn/dc measurements from 0–29 mg/ml (11 data points) in 25 mM citrate and 50 mM NaCl, pH 6.0 buffer plus 5% (v/v) glycerol (shown), plain buffer and water. 100 mM (29.24 mg/ml) OG solutions where made from 400 mM OG in water, 2x buffer and water, and decreasing concentrations where made by mixing 100 mM OG with 1x buffer or water. (D) dn/dc measurements of DDM from 0–10 mg/ml in 20mm Hepes, 150 mM NaCl, pH 7.0 buffer (shown) and water (8 data points). 20 mM (102.12 mg/ml) DDM solutions where made from 200 mM DDM in water, 2x buffer and water, and decreasing concentrations where made by mixing 20 mM DDM with 1x buffer and water. The inset tables of each plot show the measured dn/dc (slope), y intercept (calculated solvent dn/c) and the measured dn/dc of the started solvent. The Anton Paar RXA150 refractometer was calibrated using water RI of 1.333690, equilibrated at each concentration for 3–5 min and 30–60 data points automatically collected every 5 sec. Sample volume was 130–150 μl and data collected every 5 sec for each concentration. The standard deviation of each data point was 0.000001.
Figure 11
Figure 11
Purification and quantitation of Ovalbumin Fraction VII used for detector calibration. SEC chromatograms of Ovalbumin Fraction VII in different buffers using a TSK column at 0.6 ml/min. (A) Chromatograms +/−TFA-1 using 20 mM Hepes, 150 mM NaCl, +/− 0.1mM TFA-1, pH 7.0. These Ovalbumin purifications where used to characterize the novel tandem facial amphiphile TFA-1 by TDA (Chae et al 2010, supplemental material). (B) SEC profiles +/− OG (green with OG; blue and red without OG) using 25mM Citrate, 50mM NaCl, +/− 40 mM OG, pH 6.0. Very similar chromatograms have been produced using other detergents such as octyl maltoside (OM), decyl maltoside (DM), DDM, Fos-Choline-12 (FC12) and Fos-Choline-14 (FC14). Four individual absorption spectra from each pooled fraction using dilution factors from 21–51 had differences less than or equal to 0.002 OD 280 nm/ml.
Figure 12
Figure 12
Using SEC absorbance detectors for estimating PDC homogeneity. (A) SEC chromatograms at 280 nm of a purified PDC using a SDX column and 20 mM Hepes, 100 mM NaCl, 10 % (v/v) glycerol, 2 mM DTT, pH 7.3 running buffer. The PDC remains monodisperse when dilute (black), concentrated 20x (blue) and concentrated after 1-month storage at 4° (red). (B) TSK 280 nm chromatograms of purified GlpF in 40 mM OG at pH 5 (red), 7 (blue) and 9 (green). Following detergent solubilization and affinity purification, GlpF is composed of two non-reversible oligomeric populations. Once the main peak at pH 5 is collected, it remains monodisperse at all concentrations, crystallized as a homo-tetramer and was used to solve its crystal structure (Fu et al 2000). (C) TSK chromatogram of a PDC in 1 mM alpha DDM using a diode array absorption detector. The normalized 280 nm peak due to absorption by aromatic residues (blue) and the 220 nm peak due to peptide backbone absorption (gray) overlay well. The inset for each panel shows that the injected samples consist of one Coomassie stained SDS-PAGE band. (D) Total peak purity from 200–400 nm shows that the peak is spectrally similar from 32–36 min. The threshold (red trace) defines the limits of integration and the similarity index (blue trace) shows the calculated purity relative to the reference spectrum at peak apex (gray line at 33.8 min).
Figure 13
Figure 13
Measuring Sample Homogeneity (Mw/Mn) to optimize peak collection. TDA analysis of a provided monomeric PDC in DDM. Following the last SEC step for purification, the sample was concentrated 25x using a 100 kDa spin filter with intermittent manual mixing during concentration. (A) TSK TDAgram of a 70 μl injection (at ~10 mg/ml) using 20mM NaCl, 100mM NaCl, 0.33 mM DDM, pH 7 column buffer at 0.5ml/min. The profile is composed of single UV peak with an insignificant aggregate (large LS, no DP, small RI, and very small UV) at ~11 ml retention. The sample is 85 % monodisperse (goal is >95%). Excess DDM located at the backside of the RI peak is estimated to be <0.1 mg/0.07ml or 2.8 mM. (B) MABi at every 5 Hz slice overlaid onto the RIABi trace. Integration limits (represented by solid black line) are progressively narrowed going from left to right panels, and represent the Whole complete protein UV peak profile, Large center portion of the complete UV protein profile without the tails and shoulders and Small center peak, respectively. (C) Table of the TDA results. The small centered fraction from 13.9 to 15.1 ml is homogenous. Using the provided dA/dc (method for determination unknown), which is 28% higher than the theoretical dA/dc, the oligomeric state is 1.03 monomers/PDC, as expected. If the theoretical dA/dc was used, the change in CA, CB, MAB, MA, MB, IV and Rh would change respectively by 41, −11, −3, 38, −12, 2 and 0 %. The % error in averaged Ks from 5 calibration standard injections ranged from 0.1 to 0.4. (D) dn/dc plot of DDM from 0–2 mg/ml (N = 10; 0–100 μl injections of 40 mM DDM). The measured dn/dc of DDM was 0.1460 ml/g.
Figure 14
Figure 14
Using TDA and cation exchange chromatography to minimize DDM detergent concentration while concentrating protein and maintaining homogeneity. All TDA profiles of this PDC were obtained using a SDX 200 10/300 GL column in 2 mM DDM. (A) TDAgram after being concentrated 58x using a 50kDa XM filter and stirred cell. The PDC remains homogenous (Gaussian UV, RI, LS and DP peak) and is pure (inset). The PDC sample contains 61 mM excess DDM micelles, which represent 47% theoretical removal; only 25% was removed using an YM 50kDa spin filter. It produced major detergent phase separation during crystallization experiments and yielded no crystals. (B) TDAgram after being concentrated using S cation exchange and 2 mM β-DDM buffer. The PDC eluted from S at 9 mg/ml (inset; red trace is the NaCl step gradient; blue trace is the 280 nm absorbance profile) and contains −1.5 mM DDM (negative RI peak). Due to a low detergent: protein ratio the PDC forms larger oligomers. No detergent phase separation or crystals were formed during crystallization trials. (C) TDAgram after being concentrated to 7.5 mg/ml using S cation exchange and 4 mM β-DDM buffer (inset). The PDC remains homogenous and contains no excess detergent micelles. No crystals or detergent phase separation were produced from the first round of crystallizations. This project is now worthy to enter comprehensive crystallization trials and functional studies. (D) Table of TDA results using 7 independent preparations (defined by number in column 1 and 8 comprehensive TDA experiments using whole (when possible) and partial peak analysis; C0, Cconc and Cfinal represent starting concentration, concentrated by Mwt cut-off filters, and concentrated plus dialyzed post SEC samples, respectively, and Sconc is post concentration using cation exchange. Measured DDM dn/dc values, which were dependent on running conditions, ranged from 0.133 to 0.157 ml/g and the micelle Mavg ranged from 80–90 kDa. For analysis of the protein component, the theoretical dA/dc of 1.30 OD280nm/mg and dn/dc of 0.185 ml/g were used.
Figure 15
Figure 15
Detergent concentration minimized using different detergent isomer. TDAgrams of a PDC in 0.5 mM DDM post 100 kDa spin concentration in β-DDM and α-DDM. (A) In β-DDM the PDC is homogenous (peak 1 with UV signal in purple), β-DDM micelles concentrate on 100 kDa (peak 2 with large RI in red and DP signal in blue), and extreme phase separation due to the ~ 20 mM excess β-DDM is obtained during crystallization trials. The LALS signal is shown in black. Interestingly, when repeated using a pure β-DDM control, β-DDM micelles did not concentrate. The inset shows that the protein is pure by SDS-PAGE. (B) When purified in α-DDM, α-DDM micelles barely concentrate (~ 2 mM excess) on a 100 kDa filter (peak 3; no UV and minimal RI and RALS), the PDC is mostly homogenous (peak 2) with a small void (peak 1, minimal 280 nm and maximum light scattering signal), and no phase separation dis observed during crystallization.
Figure 16
Figure 16
Working with anomalous sample baselines to determine oligomeric state and % bound detergent. Three identical back-to-back PDC samples were injected (black, green and red traces are respectively the 1st, 2nd and 3rd runs) onto a SDX column running 50 mM Tris, 50 mM NaCl, 2 mM βME, 2mM DM, pH 8.3 buffer. A normalized decyl maltoside (DM) injection (0.96 mg in water) is shown in blue. (A) Overlay of the three RI traces show good reproducibility and reasonable baselines. A minor excess DM peak (~ 0.002 μg) and then a broad peak representing the mismatch in column and sample buffer follow the first PDC peak. (B) Overlay of the three LS profiles with fitted and corrected baseline. The anomalous LS baselines from 6.5 to 12.5 ml have no RI signal and are declining. Using these 4 traces and 3 calibration standards, the PDC is a dimer with about 65% detergent by weight (monomers and % detergent for the runs are 2.05/35.7%, 2.04/35.6% and 1.89/33.2%, respectively. Without multiple runs, there would have been no confidence in the measured oligomeric state.
Figure 17
Figure 17
LCMS of purified Ovalbumin Fraction VII used for TDA calibration. Mass spectrometry (kindly provided by David Maltby at the Mass Spectrometry Facility at UCSF, Mission Bay) of the SEC purified protein was obtained on an ABI QSTAR XL mass spectrometer, interfaced with an ABI 140B HPLC system. The column used was a 1 × 150 mm Vydac C4, 5 um particle size, 300 angstrom pore size. Solvent A was 0.1 % formic acid in water and solvent B was 0.1 % formic acid in acetonitrile. The sample was injected with the column at 5 % solvent B and a gradient was run up to 70 % solvent B in 35 minutes. Data was averaged over the elution time of the protein peak using the standard Analyst software of the QSTAR. Deconvoluted mass data were also calculated using the Analyst software. Ovalbumin was prepared according to Supporting Protocol 2 using a TSK column, 50 mM Ammonium Acetate pH 7.0 column buffer and a 0.6 ml/min flow rate. Two 500 μl of 4.4 mg/ml was injected yielding a fraction of 1.7 mg/ml.

References

    1. Ball V, Ramsden JJ. Buffer dependence of refractive Index increments of protein solutions. Biopolymers. 1998;46:489–492.
    1. Barth HG, Boyes BE, Jackson C. Size exclusion chromatography. Analytical Chemistry. 1994;6(12):595R–620R. - PubMed
    1. Bohdanechy M, Kovar J. Viscosity of Polymer Solutions. Elsevier Scientific Publication; Amsterdam, Oxford, New York: 1982.
    1. Bohidar H. Light scattering and viscosity study of heat aggregation of insulin. Biopolymers. 1998;45:1–8. - PubMed
    1. Chae PS, Gotfryd K, Pacyna J, Miercke LJW, Rasmussen SG, Robbins RA, Rana RR, Loland CJ, Kobilka B, Stroud RM, Byrne B, Gether U, Gellman SH. Tandem facial amphiphiles for membrane protein stabilization. Journal of the American Chemical Society. 2010;132(47):16750–2. - PMC - PubMed

Publication types