. 2014 Aug 1;345(6196):578-82.
doi: 10.1126/science.1256942. Epub 2014 Jul 17.

Coinfection. Virus-helminth coinfection reveals a microbiota-independent mechanism of immunomodulation

Affiliations

Coinfection. Virus-helminth coinfection reveals a microbiota-independent mechanism of immunomodulation

Lisa C Osborne et al. Science. .

Abstract

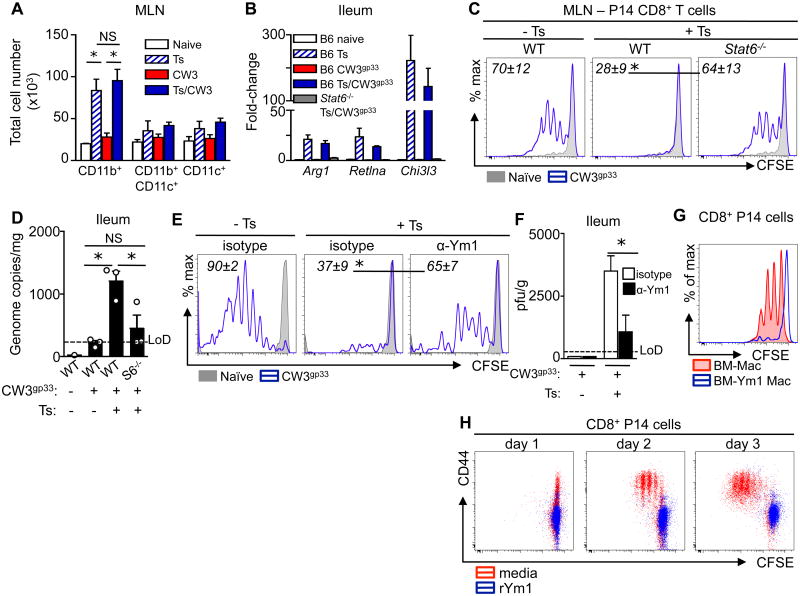
The mammalian intestine is colonized by beneficial commensal bacteria and is a site of infection by pathogens, including helminth parasites. Helminths induce potent immunomodulatory effects, but whether these effects are mediated by direct regulation of host immunity or indirectly through eliciting changes in the microbiota is unknown. We tested this in the context of virus-helminth coinfection. Helminth coinfection resulted in impaired antiviral immunity and was associated with changes in the microbiota and STAT6-dependent helminth-induced alternative activation of macrophages. Notably, helminth-induced impairment of antiviral immunity was evident in germ-free mice, but neutralization of Ym1, a chitinase-like molecule that is associated with alternatively activated macrophages, could partially restore antiviral immunity. These data indicate that helminth-induced immunomodulation occurs independently of changes in the microbiota but is dependent on Ym1.


Conflict of interest statement

The authors declare no other potential conflicts of interest.

Figures

Fig. 1
Fig. 1. Helminth co-infection impairs immunity to enteric viral infection
C57BL/6 mice were either left naïve or infected with 500 Trichinella spiralis (Ts) larvae per os (po). At day 12 post-Trichinella infection, mice were infected with 106 pfu MNV CW3 (po) and sacrificed at day 8 post-CW3 infection. (A to B) Flow cytometric detection of antigen-specific MNV CW3 P1519Y tetramer+ CD8+ T cells in naïve, Trichinella-infected (Ts), CW3-infected or Ts/CW3 co-infected mice in the (A) small intestine intraepithelial lymphocytes (IEL) and (B) spleen. Numbers in flow plots represent mean frequencies ± s.e.m. of CW3 Kb-P1519Y tetramer+ cells within the CD8+ lymphocyte gate of each group. (C) Splenocytes from CW3 and Ts/CW3 mice were stimulated with MNV CW3 P1519Y peptide and assayed for production of IFNγ, TNFα, CCL3, CD107a and Granzyme B. Pie charts show fractions of peptide-responsive CD8+ T cells producing any combination of these effector molecules. (D) Splenocytes from mono- and co-infected mice were stimulated with a pool of MHCII IAb-restricted MNV-specific peptides and assayed for production of IFNγ and TNFα. Numbers in flow plots represent mean frequencies ± s.e.m. of dual producing IFNγ+ TNFα+ cells within the CD4+ CD44hi lymphocyte gate of each group. (E) MNV genome copies in ileal tissue were quantified by RT-PCR. All data are representative of 2-4 independent experiments with a minimum of 3-5 mice per group. Statistics compare mono-infected versus co-infected groups using the Student's t-test. * P < 0.05. LoD: limit of detection.
Fig. 2
Fig. 2. Impaired virus-specific CD8+ T cell activation and proliferation in the presence of helminth co-infection
(A) CFSE dilution and CD69 expression of adoptively transferred gp33-specific P14 CD8+ T cells isolated from the MLN and spleen of MNV CW3gp33 mono- and Ts/MNV CW3gp33 co-infected mice. Red, mono-infected; blue, co-infected. Numbers in flow plots represent frequencies of cells in divisions 0, 1-5 or 6+ (right to left). (B) Quantification of total P14 cells in the MLN (top row) and spleen (bottom row) in mono- and co-infected mice. (C to E) C57BL/6 mice were infected with 500 Ts larvae po. At day 12 post-Ts infection, mice were infected with 105 TCID50 influenza X31gp33 intranasally (in) and sacrificed at day 7 post-X31 infection. (C) Lung lymphocytes from influenza X31gp33 mono-infected (X31) and co-infected (Ts/X31) mice were stimulated with gp33 peptide and assayed for production of IFNγ. Total gp33-specific IFNγ+ CD8+ T cells in the lung. (D) Frequency of gp33-specific CD8+ T cells in the lungs. Numbers in flow plots represent mean frequencies ± s.e.m. of Kb-gp33 tetramer+ cells within the CD8+ lymphocyte gate of each group. (E) Quantification of Influenza PA gene in lung tissue, normalized to Hprt1. (F to H) C57BL/6 mice were infected with 200 Heligmosomoides polygyrus bakeri (Hp) larvae po. At day 12 post-Hp infection, mice were infected with 106 pfu MNV CW3 po and sacrificed at day 7 post-CW3 infection. (F) Total splenic Kb-P1519Y tetramer+ CD8+ T cells from CW3 mono-infected and Hp/CW3 co-infected mice. (G) Splenocytes were stimulated with P1519Y peptide and assayed for production of IFNγ and TNFα. Numbers in flow plots represent mean frequencies ± s.e.m. of dual producing IFNγ+ TNFα+ cells within the CD8+ CD44hi lymphocyte gate of each group. (H) MNV genome copies in ileal tissue were quantified by RT-PCR. All data are representative of 2 independent experiments with a minimum of 3-5 mice per group. Graphs represent means ± s.e.m. Statistics compare mono-infected versus co-infected groups using a two-way ANOVA with Bonferroni's post-testing (B, C and E) or the Student's t-test (D, F to H). * P < 0.05. MLN, mesenteric lymph node.
Fig. 3
Fig. 3. Helminth-induced immuno-modulation of antiviral immunity is independent of changes in the microbiota
(A to D) Luminal contents of the small and large intestine isolated from naïve or day 12 Trichinella (Ts)-infected C57/BL6 mice were subjected to 16S sequencing using Illumina MiSeq. (A, B) Principal coordinate analysis of bacterial populations in the small intestine (A) and large intestine (B) of naïve and Ts-infected mice. Axes represent weighted UniFrac distances between naïve and Trichinella-infected groups, and are annotated with the percentage of total variation explained. Statistical analyses were performed on groups of 4 mice, using PERMANOVA to test for differences in community composition according to weighted UniFrac centroid position. A, P = 0.034; B, P = 0.037. (C, D) Family level phylogenetic analysis of bacterial sequences in the small (C) and large (D) intestine of naïve and Ts-infected mice. Legend on right: bold, italicized taxa exhibited differences in relative abundance between naïve and Ts-infected mice. (E to G) Naïve and Trichinella (Ts)-infected conventional (CNV) or germ-free (GF) C57BL/6 mice were infected with MNV CW3 and sacrificed at day 7 post-CW3. (E) MNV CW3 P1519Y-specific CD8+ T cells in the Peyer's patches of mono- and co-infected CNV and GF mice. (F) Frequency of MNV CW3 P1519Y-specific CD8+ T cells in the spleens of mono- and co-infected CNV and GF mice. Numbers in flow plots represent mean frequencies ± s.e.m. of CW3 Kb-P1519Y tetramer+ cells within the CD8+ lymphocyte gate of each group. (G) MNV genome copies in ileal tissue were quantified by RT-PCR. Data in (E to G) are representative of 3 independent experiments with a minimum of 3-5 mice per group. Statistical analyses in (E to G) were performed using two-way ANOVA with Bonferroni's post-testing. * P < 0.05. LoD, limit of detection. NS, not significant.
Fig. 4
Fig. 4. Helminth-induced STAT6-dependent alternatively-activated macrophages and Ym1 are associated with diminished virus-specific CD8+ T cell responses
(A) C57BL/6 mice were either left naive, mono-infected (Ts or CW3) or co-infected (Ts/CW3). MLN antigen presenting cell subsets were quantified ex vivo at day 15 post-Ts or day 3 post-CW3. All cells gated on live lineage-negative (CD3-CD19-NK1.1-Ly6G-CD49b-Siglec-F-) cells. Macrophages (CD11b+CD11c-); myeloid DCs (CD11b+CD11c+MHCIIhi); conventional DCs (CD11b-CD11c+MHCII+). (B to D) Naïve and Ts infected C57BL/6 (WT) and Stat6-/- mice received an adoptive transfer of P14 cells iv (day 11 post-Ts), were infected with MNV CW3gp33 (day 12 post-Ts), and sacrificed at day 3 post-CW3gp33 infection. (B) AAMac signature genes Arg1, Reltna, Chi3l3 in the ileum. (C) CFSE dilution of P14 cells in the MLN. (D) MNV genome copies in ileal tissue. (E and F) Naïve and Ts-infected mice received daily treatments of 300 μg isotype or anti-Ym1 mAb starting at day 11 post-Ts infection and were MNV CW3gp33 infected at day 12 post-Ts infection. (E) CFSE dilution of adoptively transferred P14 CD8+ T cells in the MLN at day 3 post-CW3gp33 infection. (F) Viral load in the ileum as determined by plaque assay at day 7 post-CW3gp33 infection. (G) BM-Mac were infected with CW3gp33 and cultured with CFSE-labeled P14 CD8+ T cells in the presence (blue trace) or absence (red fill) of rYm1 for 3 days. (H) Purified CFSE-labeled P14 CD8+ T cells were stimulated with plate-bound αCD3 and soluble αCD28 in the presence (red) or absence (blue) of rYm1. Data in A to F are representative of 1-3 independent experiments with a minimum of 3-5 mice per group. Graphs represent means ± s.e.m. C and E: Grey solid histogram, naïve mice; blue trace, CW3gp33-infected. Numbers in flow plots represent mean frequencies ± s.e.m. of CFSE-dividing P14 cells of each group. Data in G and H are representative of at least 2 independent experiments with technical replicates. Statistical analysis was performed using two way ANOVA with Bonferroni post-testing (A, F), Student's t-test (C, E) or one-way ANOVA with Tukey's post-test (D). *, P <0.05. LoD, limit of detection. NS, not significant.

Comment in

  • Immunology. How helminths go viral.
    Maizels RM, Gause WC. Maizels RM, et al. Science. 2014 Aug 1;345(6196):517-8. doi: 10.1126/science.1258443. Epub 2014 Jul 31. Science. 2014. PMID: 25082688 No abstract available.
  • What lies within: coinfections and immunity.
    Damania B, Dittmer DP. Damania B, et al. Cell Host Microbe. 2014 Aug 13;16(2):145-147. doi: 10.1016/j.chom.2014.07.014. Cell Host Microbe. 2014. PMID: 25121741 Free PMC article.
  • A helminth-mediated viral awakening.
    Veldhoen M, Heeney JL. Veldhoen M, et al. Trends Immunol. 2014 Oct;35(10):452-3. doi: 10.1016/j.it.2014.08.004. Epub 2014 Aug 28. Trends Immunol. 2014. PMID: 25174993

References

    1. Macpherson AJ, Harris NL. Interactions between commensal intestinal bacteria and the immune system. Nat Rev Immunol. 2004;4:478. - PubMed
    1. Hooper LV, Littman DR, Macpherson AJ. Interactions between the microbiota and the immune system. Science. 2012;336:1268. - PMC - PubMed
    1. Benson A, Pifer R, Behrendt CL, Hooper LV, Yarovinsky F. Gut commensal bacteria direct a protective immune response against Toxoplasma gondii. Cell Host Microbe. 2009;6:187. - PMC - PubMed
    1. Hall JA, et al. Commensal DNA limits regulatory T cell conversion and is a natural adjuvant of intestinal immune responses. Immunity. 2008;29:637. - PMC - PubMed
    1. Vaishnava S, Behrendt CL, Ismail AS, Eckmann L, Hooper LV. Paneth cells directly sense gut commensals and maintain homeostasis at the intestinal host-microbial interface. Proc Natl Acad Sci U S A. 2008;105:20858. - PMC - PubMed

Publication types

MeSH terms

Associated data

Grants and funding