. 2014 Sep 15;74(18):5057-69.
doi: 10.1158/0008-5472.CAN-13-3723. Epub 2014 Jul 31.

CSF1/CSF1R blockade reprograms tumor-infiltrating macrophages and improves response to T-cell checkpoint immunotherapy in pancreatic cancer models

Affiliations

CSF1/CSF1R blockade reprograms tumor-infiltrating macrophages and improves response to T-cell checkpoint immunotherapy in pancreatic cancer models

Yu Zhu et al. Cancer Res. .

Abstract

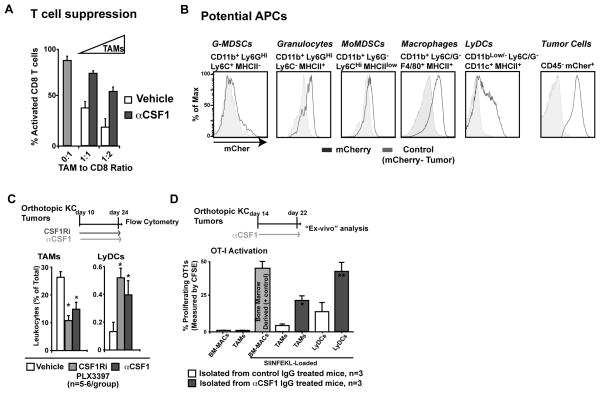
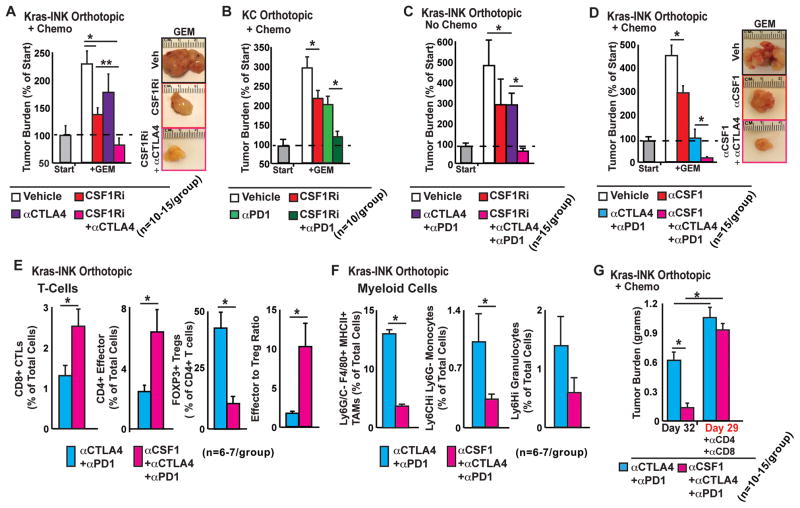
Cancer immunotherapy generally offers limited clinical benefit without coordinated strategies to mitigate the immunosuppressive nature of the tumor microenvironment. Critical drivers of immune escape in the tumor microenvironment include tumor-associated macrophages and myeloid-derived suppressor cells, which not only mediate immune suppression, but also promote metastatic dissemination and impart resistance to cytotoxic therapies. Thus, strategies to ablate the effects of these myeloid cell populations may offer great therapeutic potential. In this report, we demonstrate in a mouse model of pancreatic ductal adenocarcinoma (PDAC) that inhibiting signaling by the myeloid growth factor receptor CSF1R can functionally reprogram macrophage responses that enhance antigen presentation and productive antitumor T-cell responses. Investigations of this response revealed that CSF1R blockade also upregulated T-cell checkpoint molecules, including PDL1 and CTLA4, thereby restraining beneficial therapeutic effects. We found that PD1 and CTLA4 antagonists showed limited efficacy as single agents to restrain PDAC growth, but that combining these agents with CSF1R blockade potently elicited tumor regressions, even in larger established tumors. Taken together, our findings provide a rationale to reprogram immunosuppressive myeloid cell populations in the tumor microenvironment under conditions that can significantly empower the therapeutic effects of checkpoint-based immunotherapeutics.


Figures

Figure 1
Figure 1. PDAC tumors overexpress CSF1
A–B) Immunohistochemical analysis of CSF1 expression in normal pancreas and PDAC tissue. Representative immunofluorescent images are shown. C–D) Stratification of patient PDAC samples based on expression levels of CSF1 and CSF1R (n=4 normal and 77 PDAC).
Figure 2
Figure 2. CSF1/CSF1R blockade reprograms the tumor immune microenvironment
A) Leukocyte infiltration in KI tumors from mice treated with vehicle or CSF1Ri (PLX3397) for 8 days. The frequency of CD11b+CD3/19Ly6GLy6CLoF4/80HiMHCII+ macrophages, CD11b+Ly6GLy6CHi Mo-MDSC, and CD11b+Ly6GHiLy6C+MHCIIlow/− G-MDSC subsets is depicted as the mean percentage over total live cells. B) Cluster analysis of differential gene expression (Table S1) in vehicle- and CSF1Ri-treated tumors. C) Table of biologic processes enriched in “upregulated” or “downregulated” genes (DAVID analysis). D–E) Selected gene sets are displayed with associated biological activities. F) qRT-PCR analysis of orthotopic KI tumor tissue following treatment with vehicle or CSF1Ri for 8 days. Graph depicts mean fold change compared to vehicle. G) Kaplan Meier analysis of patient cohorts stratified by expression level of genes down-regulated from the analysis in (B). In all panels n=4–6 mice/group and * denotes p<0.05 (Mann-Whitney U-test), unless specified.
Figure 3
Figure 3. CSF1/CSF1R signaling blockade reprograms TAM response
A) Representative flow cytometry plots with gating strategy to identify mature granulocytes, G-MDSCs, Mo-MDSCs, and TAM subsets. B–D) Frequency of total, CD206Hi and CD206Low TAMs in orthotopic KI tumors treated with αCSF1 for 6 hours–8 days. Mean percentage of macrophages over total cells is depicted. C) Representative analysis of MHCII and CD206 expression in TAMs following 8-day treatment with vehicle or αCSF1. E) Analysis of dead (live/dead blue dye+) CD206Hi and CD206Low TAMs in PDAC tumors from (B). F) CSF1R expression by MFI in CD206Hi and CD206Low TAMs in vehicle-treated mice from (B). G) CD206 expression by MFI and CD206Hi TAM number following 8 days of αCSF1 treatment. H) qRTPCR analysis on CD11b+Ly6G/CF4/80+MHCII+ TAMs sorted from KI tumors following 8-day treatment with vehicle or αCSF1. I) MHCII expression by MFI in TAMs from (H). All graphs depict means values or normalized fold change +/−SEM, n=4–6 mice/group and * denotes p<0.05 by unpaired t-test or Mann-Whitney U-test.
Figure 4
Figure 4. CSF1/CSF1R signaling blockade enhances TAM support for CTL responses
A) Analysis of T cell suppression by TAMs from vehicle- or αCSF1-treated mice. TAMs were isolated by FACS and assayed for their ability to suppress splenic CD8+ T cell proliferation following anti-CD3/CD28 stimulation. The mean number of proliferation cycles is depicted after 70 hours. Representative data from two replicate experiments (n=3 mice/group). B) Flow cytometry analysis of tumor-derived mCherry fluorescence in tumor-infiltrating leukocytes. Representative plots from 5 mice are depicted. C) Frequency of CD11b+/Ly6G/Ly6CLo/F4/80Hi/MHCII+ TAMs and CD11bLow/−/Ly6GC/CD19/CD11c+/MHCII+ Lymphoid DCs in orthotopic KI tumors after 8 days of αCSF1 or CSF1Ri treatment. D) TAMs and LyDCs were isolated by FACS from mice in (C), loaded with SIINFEKL peptide, co-cultured with splenic OT1 cells for 18 hours. OT1 proliferation was measured by CFSE dilution. Results reflect two triplicate experiments using 3 mice/group. All graphs depict mean values +/− SEM. * denotes p<0.05 by unpaired t-test.
Figure 5
Figure 5. CSF1/CSF1R blockade bolsters T cell responses
A–C) Mice bearing established orthotopic KI or PAN02 tumors were treated with vehicle, CSF1Ri, or αCSF1. Tumor burden is displayed as mean tumor weight (n=10–15 mice/group), normalized to five mice sacrificed at the start of treatment (“RX Start”). D–E) Analysis of tumor-infiltrating CD3+CD8+CTLs, CD3+CD4+Foxp3 effector T cells, and CD4+Foxp3+ Treg from mice in (A–B) is depicted as mean percentage over total live cells (n=6 mice/group). The mean effector (CTL + CD4+ effector)-to- TReg ratio is also depicted. F) CD69, CD44, CTLA4, and PD1 expression in CD3+CD8+CTLs from mice in (A) is depicted as both MFI and percentage of positive cells. Representative plots are depicted. * denotes p<0.05 by Mann-Whitney and n=5–6 in all panels.
Figure 6
Figure 6. CSF1/CSF1R signaling blockade elevates PDL1 expression in tumor cells
A–B) qRT-PCR analysis of KI tumors following 8-day treatment with vehicle, CSF1Ri or αCSF1. C) PDL1 and PDL2 expression in denoted tumor-infiltrating myeloid cells from orthotopic KI tumors treated with vehicle or CSF1Ri. Representative FACS plots and MFI are depicted. D) Mean percentage of PDL1+ and PDL2+ TAMs and monocytes. E) Mean percentage of PDL1+ PDAC cells in orthotopic KI tumors from mice treated with vehicle, CSF1Ri, or αCSF1. PDAC cells were identified as CD45 mCherry+. F–G) PD1 expression in tumor-infiltrating myeloid cells following vehicle or CSF1Ri treatment. Representative expression plots, MFI and positive cells percentage data are depicted. All graphs depict means values +/−SEM, n=3–7 mice/group. * denotes p<0.05 by unpaired t-test.
Figure 7
Figure 7. CSF1/CSF1R signaling blockade enhances T cell checkpoint immunotherapy
A–D) Mice bearing orthotopic KI or KC tumors were treated with vehicle, CSF1Ri, or αCSF1, +/− GEM +/− αPD1, and +/−αCTLA4. The tumor burden is displayed as mean tumor weight (n=10–15 mice/group), normalized to five mice sacrificed at the start of treatment (“Start”). E) Frequency of tumor-infiltrating CD3+CD8+CTLs, CD3+CD4+Foxp3 T effectors, and Foxp3+ CD4+ TRegs from mice in (D) is depicted as mean percentage of total live cells (n=6 mice/group). Mean effector (CTL + CD4+ effector) to TReg ratio is depicted. F) Flow cytometric analysis of tumor-infiltrating CD11b+Ly6C/GF4/80+MHCII+ TAMs, CD11b+Ly6C+Ly6G Mo-MDSCs, and CD11b+ Ly6C+Ly6G+MHCII G-MDSCs from mice in (D) is depicted as mean percentage of total cells (n=6 mice/group). G) Mice bearing orthotopic KI tumors were treated with GEM, αPD1, αCTLA4, vehicle or αCSF1, +/− αCD4 and αCD8. The tumor burden is displayed as mean tumor weight (n=10–15 mice/group). All graphs depict mean values +/− SEM and * denotes p<0.05 by unpaired t-test and/or Mann-Whitney U-test.

Comment in

References

    1. Gunturu KS, Rossi GR, Saif MW. Immunotherapy updates in pancreatic cancer: are we there yet? Therapeutic advances in medical oncology. 2013;5:81–9. - PMC - PubMed
    1. Lutz E, Yeo CJ, Lillemoe KD, Biedrzycki B, Kobrin B, Herman J, et al. A lethally irradiated allogeneic granulocyte-macrophage colony stimulating factor-secreting tumor vaccine for pancreatic adenocarcinoma. A Phase II trial of safety, efficacy, and immune activation. Ann Surg. 2011;253:328–35. - PMC - PubMed
    1. Royal RE, Levy C, Turner K, Mathur A, Hughes M, Kammula US, et al. Phase 2 trial of single agent Ipilimumab (anti-CTLA-4) for locally advanced or metastatic pancreatic adenocarcinoma. Journal of immunotherapy. 2010;33:828–33. - PMC - PubMed
    1. Le DT, Lutz E, Uram JN, Sugar EA, Onners B, Solt S, et al. Evaluation of ipilimumab in combination with allogeneic pancreatic tumor cells transfected with a GM-CSF gene in previously treated pancreatic cancer. J Immunother. 2013;36:382–9. - PMC - PubMed
    1. Coussens LM, Pollard JW. Leukocytes in Mammary Development and Cancer. Cold Spring Harb Perspect Biol. 2010 - PMC - PubMed

Publication types

MeSH terms