Use of analytic morphomics of liver, spleen, and body composition to identify patients at risk for cirrhosis
- PMID: 25083565
- PMCID: PMC6907161
- DOI: 10.1016/j.cgh.2014.07.042
Use of analytic morphomics of liver, spleen, and body composition to identify patients at risk for cirrhosis
Abstract
Background & aims: A diagnosis of cirrhosis can be made on the basis of findings from imaging studies, but these are subjective. Analytic morphomics uses computational image processing algorithms to provide precise and detailed measurements of organs and body tissues. We investigated whether morphomic parameters can be used to identify patients with cirrhosis.
Methods: In a retrospective study, we performed analytic morphomics on data collected from 357 patients evaluated at the University of Michigan from 2004 to 2012 who had a liver biopsy within 6 months of a computed tomography scan for any reason. We used logistic regression with elastic net regularization and cross-validation to develop predictive models for cirrhosis, within 80% randomly selected internal training set. The other 20% data were used as internal test set to ensure that model overfitting did not occur. In validation studies, we tested the performance of our models on an external cohort of patients from a different health system.
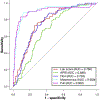
Results: Our predictive models, which were based on analytic morphomics and demographics (morphomics model) or analytic morphomics, demographics, and laboratory studies (full model), identified patients with cirrhosis with area under the receiver operating characteristic curve (AUROC) values of 0.91 and 0.90, respectively, compared with 0.69, 0.77, and 0.76 for aspartate aminotransferase-to-platelet ratio, Lok Score, and FIB-4, respectively, by using the same data set. In the validation set, our morphomics model identified patients who developed cirrhosis with AUROC value of 0.97, and the full model identified them with AUROC value of 0.90.
Conclusions: We used analytic morphomics to demonstrate that cirrhosis can be objectively quantified by using medical imaging. In a retrospective analysis of multi-protocol scans, we found that it is possible to identify patients who have cirrhosis on the basis of analyses of preexisting scans, without significant additional risk or cost.
Keywords: Advanced Technology; Fibrosis Progression; Noninvasive Markers; Prognostic Factor.
Copyright © 2015 AGA Institute. Published by Elsevier Inc. All rights reserved.
Conflict of interest statement
Conflicts of interest
These authors disclose the following: S.C.W. and G.L.S. have 2 patents pending regarding technology described in this article. The remaining authors disclose no conflicts.
Figures


References
-
- Udell JA, Wang CS, Tinmouth J, et al. Does this patient with liver disease have cirrhosis? JAMA, 307 (2012), pp. 832–842 - PubMed
-
- Huhdanpaa H, Douville C, Baum K, et al.Development of a quantitative method for the diagnosis of cirrhosis Scand J Gastroenterol, 46 (2011), pp. 1468–1477 - PubMed
-
- Leslie WD, Bernstein CN, Leboff MS, et al. AGA technical review on osteoporosis in hepatic disorders Gastroenterology, 125 (2003), pp. 941–966 - PubMed
-
- Montano-Loza AJ, Meza-Junco J, Prado CM, et al. Muscle wasting is associated with mortality in patients with cirrhosis Clin Gastroenterol Hepatol, 10 (2012), pp. 166–173 - PubMed
Publication types
MeSH terms
Grants and funding
LinkOut - more resources
Full Text Sources
Other Literature Sources
Medical

