. 2014 Jul 31;158(3):593-606.
doi: 10.1016/j.cell.2014.05.049.

Genome-wide mapping and characterization of Notch-regulated long noncoding RNAs in acute leukemia

Affiliations

Genome-wide mapping and characterization of Notch-regulated long noncoding RNAs in acute leukemia

Thomas Trimarchi et al. Cell. .

Abstract

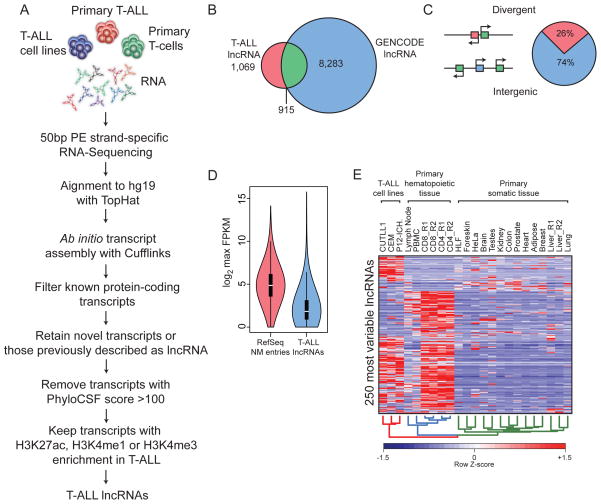
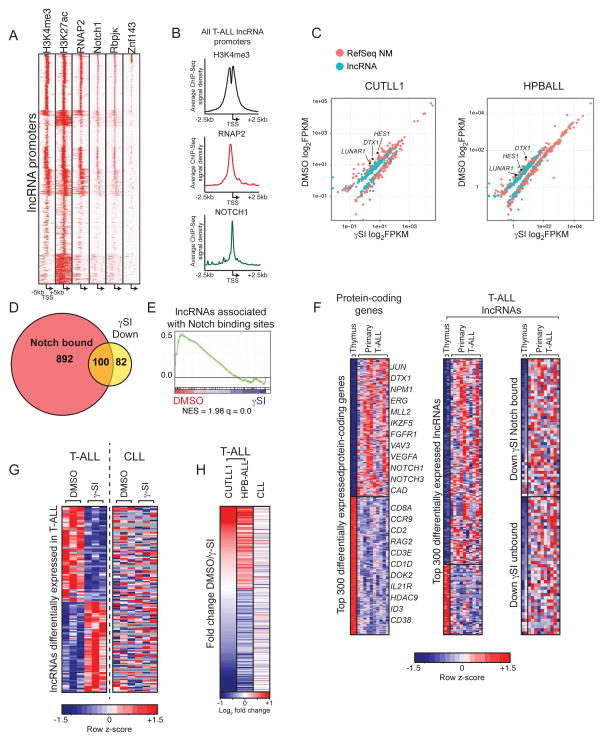
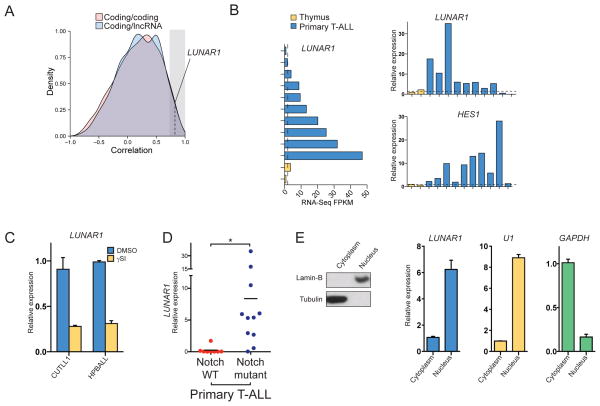
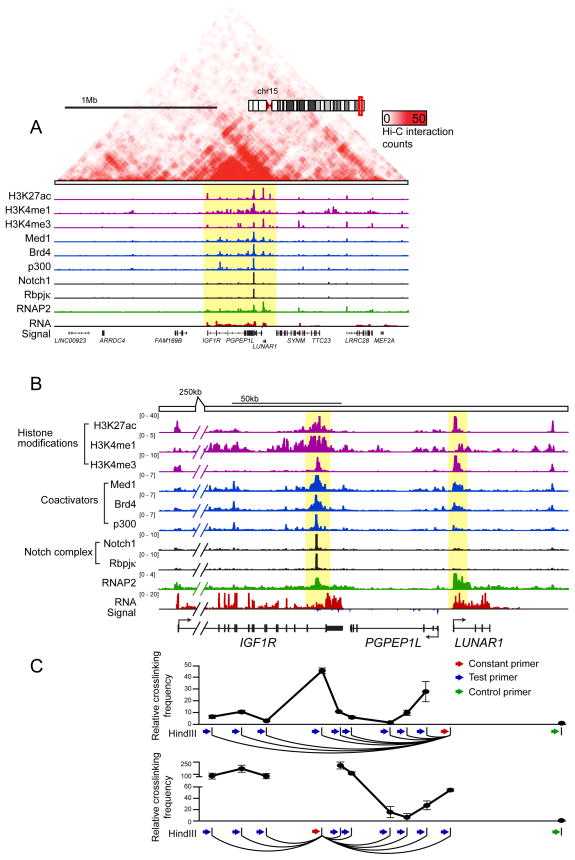
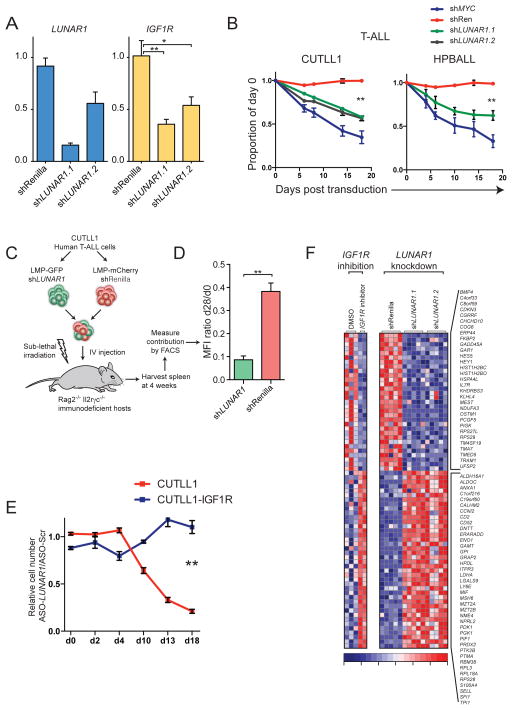
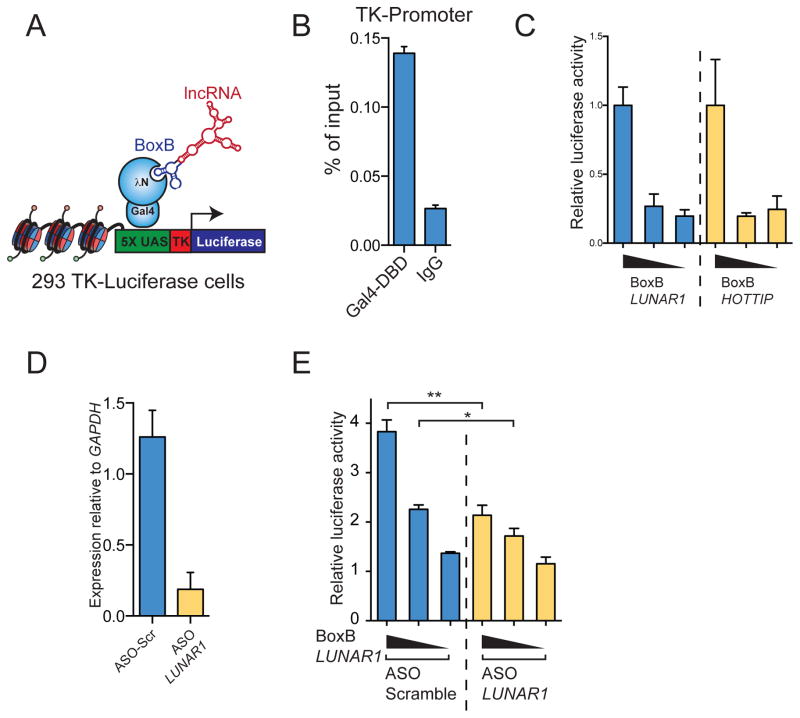
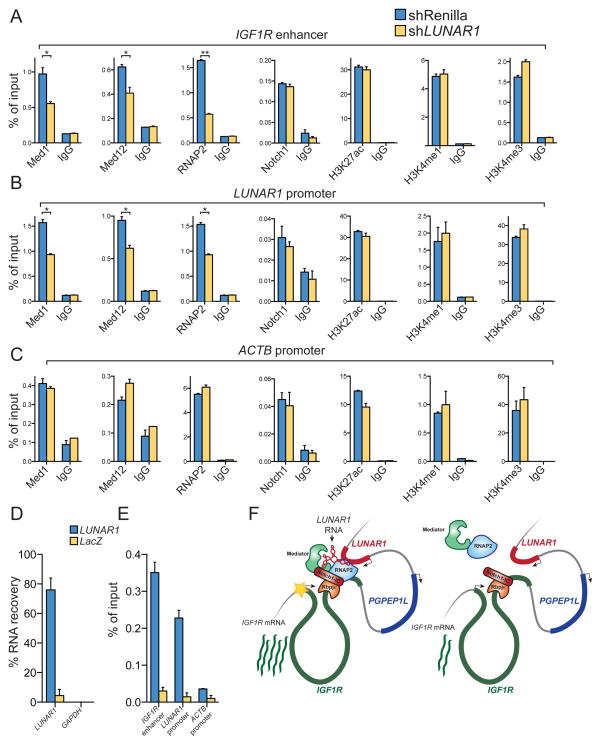
Notch signaling is a key developmental pathway that is subject to frequent genetic and epigenetic perturbations in many different human tumors. Here we investigate whether long noncoding RNA (lncRNA) genes, in addition to mRNAs, are key downstream targets of oncogenic Notch1 in human T cell acute lymphoblastic leukemia (T-ALL). By integrating transcriptome profiles with chromatin state maps, we have uncovered many previously unreported T-ALL-specific lncRNA genes, a fraction of which are directly controlled by the Notch1/Rpbjκ activator complex. Finally we have shown that one specific Notch-regulated lncRNA, LUNAR1, is required for efficient T-ALL growth in vitro and in vivo due to its ability to enhance IGF1R mRNA expression and sustain IGF1 signaling. These results confirm that lncRNAs are important downstream targets of the Notch signaling pathway, and additionally they are key regulators of the oncogenic state in T-ALL.


Figures

Figure 1
Figure 1. The long non-coding transcriptome in T-ALL
(A) A schematic illustration of the procedure used to discover and define lncRNAs in TALL. (B) Venn diagram depicting the overlap between our catalogue of T-ALL associated lncRNAs and those in the Gencode v18 lncRNA collection. (C) Pie chart representation showing the proportion of T-ALL associate lncRNAs that are transcribed in a divergent orientation (red) or intergenic (blue) with respect to protein-coding genes (green, diagram left). (D) Violin plot of log2 maximum expression values (FPKM) for protein coding (red) and T-ALL lncRNA (blue) genes. Boxes represent first and third quartile. Whiskers are 1.5 times the interquartile range. (E) A heat map representation of the 250 lncRNAs with the most variable (IQR/median) expression across T-ALL, normal T-cells and various other somatic tissues.
Figure 2
Figure 2. LncRNAs are a component of the Notch1 transcriptional network
(A) Heat map representation of ChIP-Seq signal density for H3K27ac, H3K4me3, RNAP2, NOTCH1, RBPJκ and ZNF143 centered on lncRNA TSSs +/− 5kb. All ChIP experiments are from CUTLL1 cells. (B) Histogram depicting ChIP-Seq signal density on all T-ALL lncRNA promoters for H3K4me3, RNAP2 and NOTCH1 (C) Scatterplots showing both lncRNA (green) and protein coding (orange) genes whose expression is significantly altered following addition of γSI in CUTLL1 (left) and HPBALL (right) cells. (D) Venn diagram showing the proportion of Notch-occupied lncRNAs whose expression is significantly down regulated in response to γSI treatment. (E) GSEA enrichment plot showing significant down regulation of lncRNAs associated with the top 1000 NOTCH1 peaks upon γSI treatment. (F) Heat maps showing top differentially expressed protein coding (left) and lncRNA (right) genes in primary T-ALL compared to thymic progenitors. (G) Expression profiles of lncRNAs that are differentially expressed in response to γ-SI treatment in T-ALL are shown in heat map either in T-ALL (left) or CLL (right). Gray indicates no detectable expression. (H) Expression fold change (DMSO/γ-SI) in T-ALL (CUTLL1 And HPBALL) and CLL of all lncRNAs consistently regulated upon Notch inhibition in T-ALL.
Figure 3
Figure 3. LUNAR1 is a novel lncRNA gene controlled by NOTCH1 in T-ALL
(A) Correlation density plot showing expression correlation of protein coding (red) or lncRNA (blue) genes with the nearest coding neighbor. (B) RNA-Seq expression values for LUNAR1 in primary T-ALL and thymic progenitors (left). Over expression was validated by qPCR (right, top) and over activation of Notch signaling was verified by measuring HES1 expression (bottom, right). (C) qPCR for LUNAR1 following treatment with vehicle (blue) or γSI (red) in CUTLL1 (left) and HPBALL (right) cells. (D) qPCR for LUNAR1 in Notch WT vs. Notch mutant tumors. (E) Immunoblot (left) for Lamin-B and Tubulin on cytoplasmic and nuclear fractions from CUTLL1 cells. qPCR (right) for LUNAR1, U1 and GAPDH from RNA extracted from cytoplasmic and nuclear fractions. * indicates p-value < 0.05.
Figure 4
Figure 4. LUNAR1 is physically associated with a nearby Notch-occupied enhancer
(A) Gene track of a 2Mb region surrounding the LUNAR1 locus including Hi-C interaction density heat map (red upper panel), ChIP-Seq tracks for H3K27ac, H3K4me1, H3K4me3, MED1, BRD4, P300, NOTCH1, RBPJκ, RNAP2 and RNA-Seq track. (B) Gene track view of an approximately 150kb region which contains LUNAR1 (highlighted yellow, right and a Notch-occupied enhancer in the last intron of IGF1R (highlighted yellow, left). (C) Relative cross-linking frequency as measured by 3C-qPCR using a constant primer in a HindIII fragment at the LUNAR1 TSS (top) or at the Notch-occupied enhancer (bottom). Crosslinking frequency is relative to a negative region (green). Error bars indicate the +/− SEM of three experiments.
Figure 5
Figure 5. LUNAR1 regulates T-ALL proliferation by enhancing IGF1R expression
(A) qPCR showing expression of LUNAR1 (blue) and IGF1R (yellow) in the presence of shRNAs targeting Renilla or LUNAR1. (B) Line graphs showing relative contribution from T-ALL cells expressing shRNAs against LUNAR1 grown in competition with cells expressing a non-targeting shRNA. (C) Illustration describing in vivo xenograft competition assay. (D) Ratio of MFI on day 28:day 0. (E) Line graphs showing relative cell number (targeting/Scr) for cells expressing exogenous IGF1R (blue) or empty vector (red) treated with ASO. (F) Genome-wide measurement of differentially expressed genes following pharmacological inhibition of IGF1R or LUNAR1 knockdown. Error bars represent +/− SEM of at least 3 experiments. * indicates p-value < 0.05. ** indicates p-value < 0.01.
Figure 6
Figure 6. LUNAR1 is able to stimulate transcription of a reporter gene
(A) Illustration describing the BoxB Gal4-λN RNA tethering system used. (B) ChIP assay for Gal4-DBD at the reporter gene promoter. (C) Luciferase reporter activity in experiments where BoxB tagged LUNAR1 (blue) or HOTTIP (yellow) were co-transfected with Gal4-λN. (D) qPCR following ASO knockdown of LUNAR1 in luciferase assay. (E) Reporter assay showing relative reporter gene activity when BoxB-LUNAR1 was co-transfected with either non-targeting (blue) or LUNAR1-specific (yellow) ASOs. Error bars represent SEM of at least 3 experiments. * indicates p-value < 0.05. ** indicates p-value < 0.01.
Figure 7
Figure 7. LUNAR1 modulates Mediator and RNA PolII binding at the IGF1R enhancer
ChIP assays for MED1, MED12, RNAP2, NOTCH1, H3K27ac, H3K4me1 and H3K4me3 in T-ALL cells harboring non-targeting (blue) or LUNAR1-specific shRNAs followed by locus-specific qPCR at (A) IGF1R enhancer, (B) LUNAR1 promoter or (C) ACTB promoter. (D) Percent recovery of LUNAR1 following ChIRP. (E)ChIRP assay using probes targeting LUNAR1 (blue) or LacZ (yellow) followed by qPCR at the IGF1R enhancer, LUNAR1 promoter and ACTB promoter. (F) A model for cis-regulation of gene expression by LUNAR1. Error bars represent SEM of at least 3 experiments. * indicates p-value < 0.05. ** indicates p-value < 0.01.

References

    1. Almada AE, Wu X, Kriz AJ, Burge CB, Sharp PA. Promoter directionality is controlled by U1 snRNP and polyadenylation signals. Nature 2013 - PMC - PubMed
    1. Boumil RM, Lee JT. Forty years of decoding the silence in X-chromosome inactivation. Hum Mol Genet. 2001;10:2225–2232. - PubMed
    1. Cabili MN, Trapnell C, Goff L, Koziol M, Tazon-Vega B, Regev A, Rinn JL. Integrative annotation of human large intergenic noncoding RNAs reveals global properties and specific subclasses. Genes & development. 2011;25:1915–1927. - PMC - PubMed
    1. Carninci P, Kasukawa T, Katayama S, Gough J, Frith MC, Maeda N, Oyama R, Ravasi T, Lenhard B, Wells C, et al. The transcriptional landscape of the mammalian genome. Science. 2005;309:1559–1563. - PubMed
    1. Chu C, Qu K, Zhong FL, Artandi SE, Chang HY. Genomic maps of long noncoding RNA occupancy reveal principles of RNA-chromatin interactions. Molecular cell. 2011;44:667–678. - PMC - PubMed

Publication types

MeSH terms

Associated data