. 2014 Sep;124(9):4123-33.
doi: 10.1172/JCI71048. Epub 2014 Aug 1.

Sexually dimorphic RB inactivation underlies mesenchymal glioblastoma prevalence in males

Sexually dimorphic RB inactivation underlies mesenchymal glioblastoma prevalence in males

Tao Sun et al. J Clin Invest. 2014 Sep.

Abstract

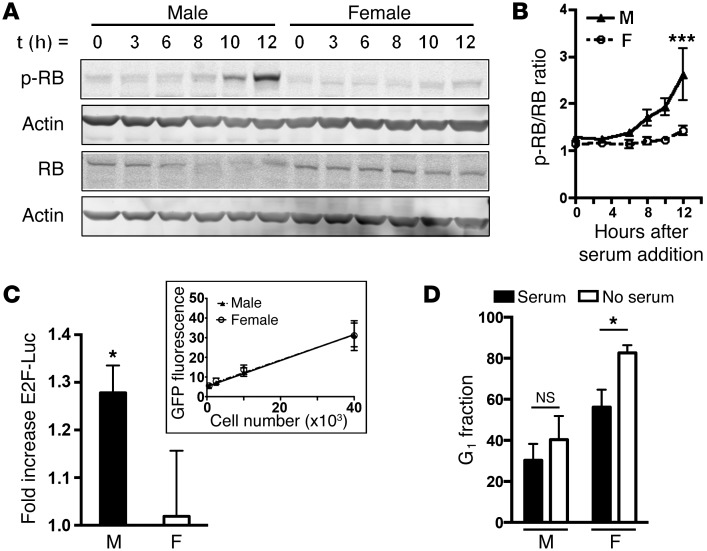
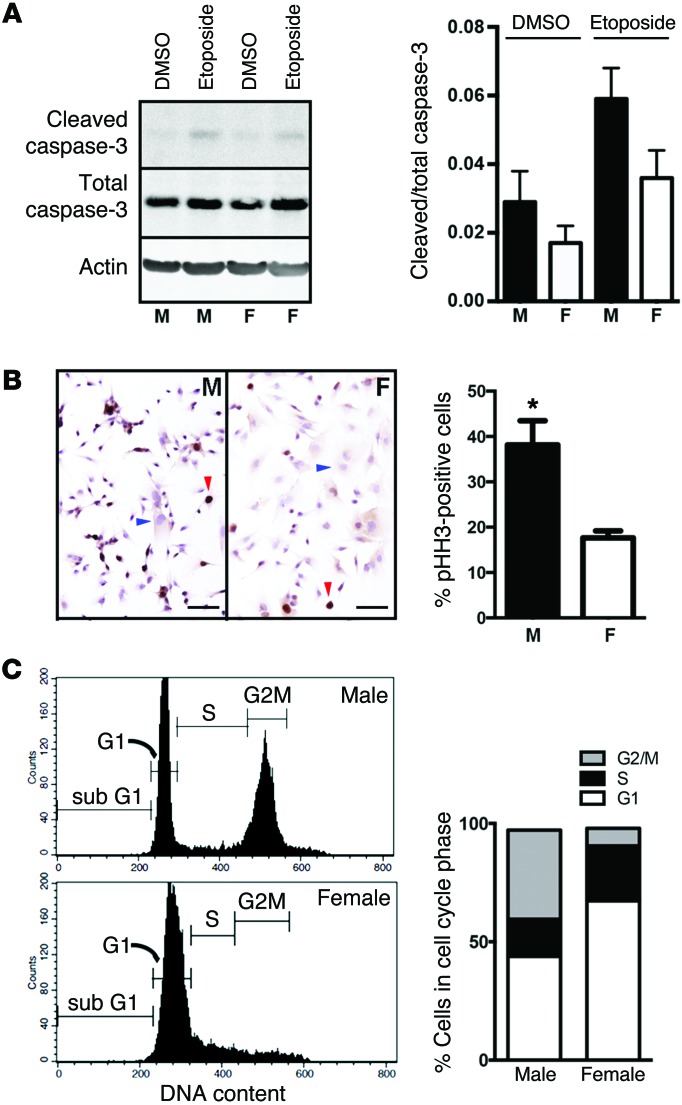
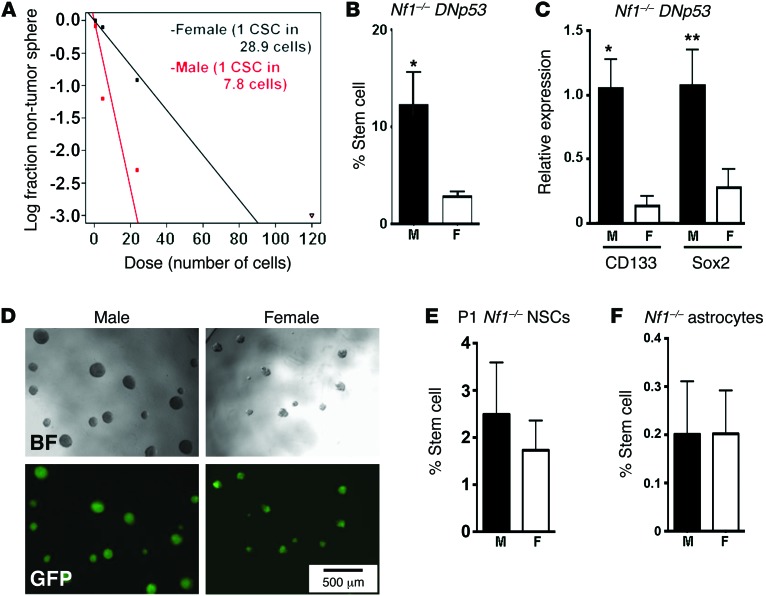
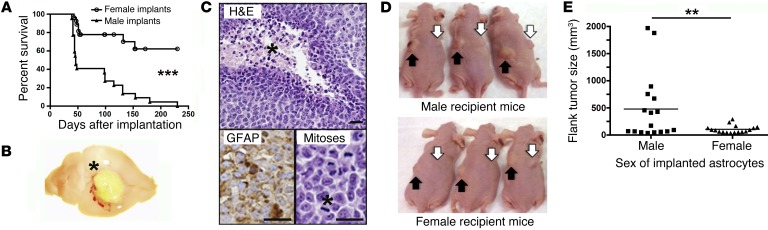
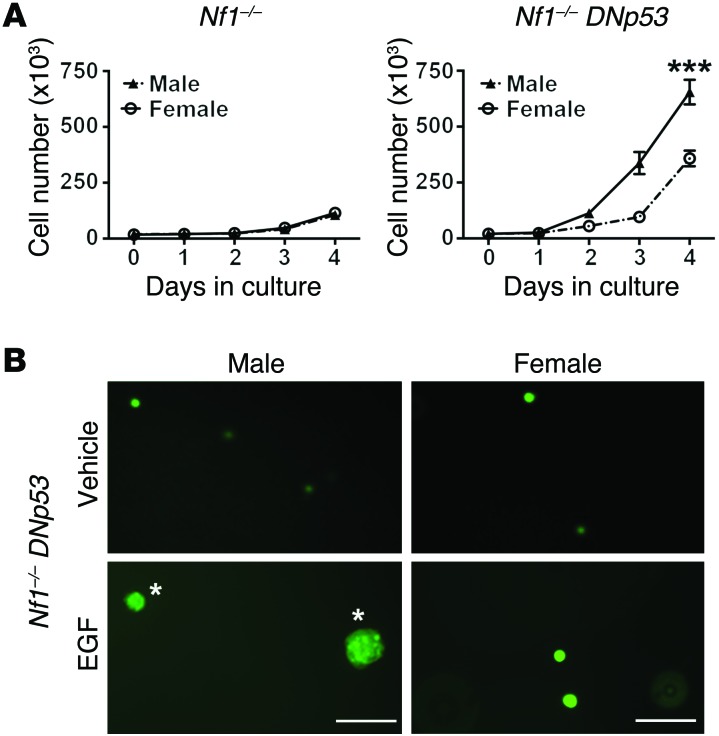
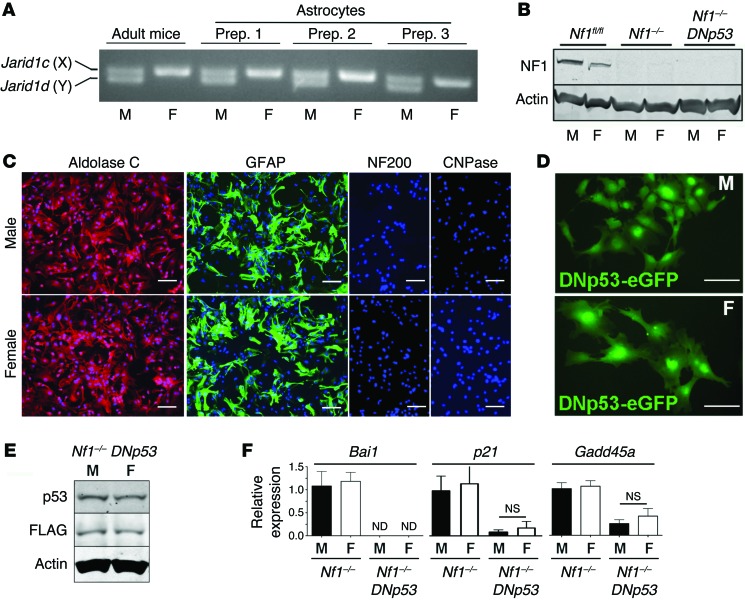
The prevalence of brain tumors in males is common but unexplained. While sex differences in disease are typically mediated through acute sex hormone actions, sex-specific differences in brain tumor rates are comparable at all ages, suggesting that factors other than sex hormones underlie this discrepancy. We found that mesenchymal glioblastoma (Mes-GBM) affects more males as the result of cell-intrinsic sexual dimorphism in astrocyte transformation. We used astrocytes from neurofibromin-deficient (Nf1(-/-)) mice expressing a dominant-negative form of the tumor suppressor p53 (DNp53) and treated them with EGF as a Mes-GBM model. Male Mes-GBM astrocytes exhibited greater growth and colony formation compared with female Mes-GBM astrocytes. Moreover, male Mes-GBM astrocytes underwent greater tumorigenesis in vivo, regardless of recipient mouse sex. Male Mes-GBM astrocytes exhibited greater inactivation of the tumor suppressor RB, higher proliferation rates, and greater induction of a clonogenic, stem-like cell population compared with female Mes-GBM astrocytes. Furthermore, complete inactivation of RB and p53 in Mes-GBM astrocytes resulted in equivalent male and female tumorigenic transformation, indicating that intrinsic differences in RB activation are responsible for the predominance of tumorigenic transformation in male astrocytes. Together, these results indicate that cell-intrinsic sex differences in RB regulation and stem-like cell function may underlie the predominance of GBM in males.


Figures

Figure 7
Figure 7. Male and female astrocytes are equally transformed upon inactivation of both p53 and RB by SV40-TAg.
(A) Quantitative PCR for SV40-TAg, the p53 transcriptional targets p21 and Gadd45a, and the E2F targets Cdc6 and Bcl2. (B) Representative images from tumorsphere cultures of male and female Nf1–/– SV40-TAg astrocytes. Scale bar: 200 microns. (C) Male and female Nf1–/– SV40-TAg astrocytes yielded equal numbers of equivalently sized tumors upon flank implantation. Each symbol represents an individual tumor.
Figure 6
Figure 6. Sex differences in RB inactivation in Nf1–/– DNp53 astrocytes.
(A) Western blot analysis for RB and phospho-RB (p-RB) in protein lysates from cultures of male and female Nf1–/– DNp53 astrocytes serum starved for 48 hours (t = 0) and after addition of serum for the indicated times. Actin served as loading control. Shown are representative blots from 1 of 3 independent experiments. (B) Quantification of Western blot analysis of RB phosphorylation. Shown is the ratio of p-RB/RB as a function of time in serum (***P = 0.0001, ANOVA). (C) RB inactivation was mesured with an E2F-Luc reporter in 4 independent cultures of male and female Nf1–/– DNp53 astrocytes. For each measurement, bioluminescence was normalized to EGFP fluorescence, which was linearly related to cell number in both male and female astrocytes (inset). Male values were normalized to female values within each experiment (*P < 0.05, t test). (D) G1 fraction obtained from cell cycle analysis of male and female Nf1–/– DNp53 astrocytes cultured in serum or serum starved for 48 hours. Quantitation of 4 independent experiments is shown (*P = 0.028, t test).
Figure 5
Figure 5. Sex differences in proliferation of Nf1–/– DNp53 astrocytes.
(A) Protein lysates of male and female Nf1–/– DNp53 astrocytes treated with DMSO or etoposide (10 μg/ml, 24 hours) were analyzed by Western blot for cleaved caspase-3 and total caspase-3. Actin served as loading control. A single representative blot and quantitation from the 3 independent experiments are shown. (B) Representative fields from cultures of male and female Nf1–/– DNp53 astrocytes stained with hematoxylin and for the presence of the nuclear proliferation marker pHH3 (brown). Blue arrowheads identify examples of nuclei negative for pHH3. Red arrowheads identify examples of nuclei positive for pHH3. Scale bar: 100 microns. Quantification of the percentage of positive nuclei is shown (*P < 0.05, t test). (C) Representative histograms from male and female Nf1–/– DNp53 astrocyte cell cycle analysis of asynchronously growing serum-supplemented cultures. Quantified areas for each phase of the cell cycle are as indicated. Means for cell cycle distribution from 3 independent cultures are shown.
Figure 4
Figure 4. Sex differences in induction of a stem-like cell subpopulation in Nf1–/– DNp53 astrocytes.
(A) Frequency of clonogenic (stem-like) cells was measured by ELDA in Nf1–/– DNp53 cells (3,000, 600, 120, 24, 5, and 1 cell per well; 10–12 replicates per dilution), with 3 independent astrocyte preparations. Shown is a representative ELDA analysis from one of the three cell preparations. CSC, clonogenic (stem-like) cell. (B) Male Nf1–/– DNp53 cells have a significantly higher stem-like cell frequency (12.2% ± 3.4%) than female (2.77% ± 0.6%) counterparts, as derived from the ELDA analysis (*P = 0.03, t test). (C) Sex differences in expression of stem cell markers CD133 and Sox2 (*P = 0.018 and **P = 0.03 for CD133 and Sox2 respectively, 2-tailed t test). (D) Representative images of neurospheres from male and female Nf1–/– DNp53 cells (3,000 cells per well) 1 week after plating. Scale bar: 500 microns. (E) The frequency of clonogenic stem-like cells, as determined by ELDA, was equal in male (2.49% ± 1.1%) and female (1.73% ± 0.63) Nf1–/– NSCs. (F) The frequency of clonogenic stem-like cells, as determined by ELDA, was equally low (0.2%) in both male and female Nf1–/– astrocytes.
Figure 3
Figure 3. Male predominant in vivo tumorigenesis occurs irrespective of recipient mouse sex.
(A) Intracranial implantation of EGF-treated male (n = 22) and female (n = 22) Nf1–/– DNp53 astrocytes from 3 independent litters resulted in death of 100% of mice receiving male cell implants and 36% of mice receiving female cell implants (***P < 0.0001, log-rank test). (B) Intracranial tumors were recognizable in situ by their EGFP expression (asterisk). (C) Intracranial tumors exhibited features of GBM, including nuclear pleomorphism and pseudopalisading necrosis (asterisk, top row), GFAP positivity, and abundant mitoses (asterisk, bottom row). Scale bar: 20 microns. (D) Male (black arrows) and female (white arrows) EGF-treated Nf1–/– DNp53 astrocytes were implanted into the flanks of male and female mice. Male cells gave rise to more tumors regardless of the recipient mouse sex. (E) Flank tumor volumes measured by calipers at 6 weeks. Each symbol represents an individual tumor. Mean volumes were significantly different (**P = 0.001, Wilcoxon rank test).
Figure 2
Figure 2. Male predominant in vitro transformation of mouse astrocytes with inactivation of NF1 and p53.
(A) In vitro growth of male and female Nf1–/– astrocytes and Nf1–/– DNp53 astrocytes over 4 days. Shown are best fits of an exponential growth curve to all data points (***P = 0.0004, ANOVA). (B) EGF treatment (50 ng/ml) supported colony formation (asterisks) in soft agar with male but not female Nf1–/– DNp53 astrocytes. Scale bar: 200 μm.
Figure 1
Figure 1. Preparation of male and female Nf1–/– DNp53 astrocytes.
(A) Sex determination of isolated mouse astrocytes by PCR for X- and Y-encoded paralogs Jarid1c and Jarid1d. Shown are results with genomic DNA isolated from adult mouse brain and from 3 independent litters of postnatal day 1 pups. (B) Western blot analysis of NF1 expression in male and female Nf1fl/fl, Nf1–/–, and Nf1–/– DNp53 astrocytes. Actin served as loading control. (C) Purity of astrocyte cultures was assessed by immunofluorescence detection of the astrocyte markers aldolase C (red) and GFAP (green) and the absence of neuronal (NF200) and oligodendrocyte (CNPase) marker expression. Nuclei were counterstained blue with DAPI. (D) Direct fluorescence microscopy of FACS-sorted cells indicated 100% EGFP expression in male and female Nf1–/– DNp53 astrocytes. (E) Western blot analysis indicated equal expression of endogenous p53 and the flag-tagged DNp53 construct (FLAG). Actin served as loading control. (F) PCR for p53 transcriptional targets Bai1, p21, and Gadd45a indicates equal loss of expression in Nf1–/– DNp53 astrocytes. ND, not detected; NS, not significant; M, male; F, female. Scale bar: 100 microns.

References

    1. Ober C, Loisel DA, Gilad Y. Sex-specific genetic architecture of human disease. Nat Rev Genet. 2008;9(12):911–922. doi: 10.1038/nrg2415. - DOI - PMC - PubMed
    1. Sun T, Warrington NM, Rubin JB. Why does Jack, and not Jill, break his crown? Sex disparity in brain tumors. Biol Sex Differ. 2012;3:3. doi: 10.1186/2042-6410-3-3. - DOI - PMC - PubMed
    1. Kool M, et al. Molecular subgroups of medulloblastoma: an international meta-analysis of transcriptome, genetic aberrations, and clinical data of WNT, SHH, Group 3, and Group 4 medulloblastomas. Acta Neuropathol. 2012;123(4):473–484. doi: 10.1007/s00401-012-0958-8. - DOI - PMC - PubMed
    1. Taylor MD, et al. Molecular subgroups of medulloblastoma: the current consensus. Acta Neuropathol. 2012;123(4):465–472. doi: 10.1007/s00401-011-0922-z. - DOI - PMC - PubMed
    1. Dubrow R, Darefsky AS. Demographic variation in incidence of adult glioma by subtype, United States, 1992–2007. BMC Cancer. 2011;11:325. doi: 10.1186/1471-2407-11-325. - DOI - PMC - PubMed

Publication types

Substances