. 2014 Sep;124(9):4004-16.
doi: 10.1172/JCI75051. Epub 2014 Aug 1.

p38 signaling inhibits mTORC1-independent autophagy in senescent human CD8⁺ T cells

p38 signaling inhibits mTORC1-independent autophagy in senescent human CD8⁺ T cells

Sian M Henson et al. J Clin Invest. 2014 Sep.

Abstract

T cell senescence is thought to contribute to immune function decline, but the pathways that mediate senescence in these cells are not clear. Here, we evaluated T cell populations from healthy volunteers and determined that human CD8+ effector memory T cells that reexpress the naive T cell marker CD45RA have many characteristics of cellular senescence, including decreased proliferation, defective mitochondrial function, and elevated levels of both ROS and p38 MAPK. Despite their apparent senescent state, we determined that these cells secreted high levels of both TNF-α and IFN-γ and showed potent cytotoxic activity. We found that the senescent CD45RA-expressing population engaged anaerobic glycolysis to generate energy for effector functions. Furthermore, inhibition of p38 MAPK signaling in senescent CD8+ T cells increased their proliferation, telomerase activity, mitochondrial biogenesis, and fitness; however, the extra energy required for these processes did not arise from increased glucose uptake or oxidative phosphorylation. Instead, p38 MAPK blockade in these senescent cells induced an increase in autophagy through enhanced interactions between p38 interacting protein (p38IP) and autophagy protein 9 (ATG9) in an mTOR-independent manner. Together, our findings describe fundamental metabolic requirements of senescent primary human CD8+ T cells and demonstrate that p38 MAPK blockade reverses senescence via an mTOR-independent pathway.


Figures
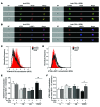
Figure 8
Figure 8. p38 MAPK controls autophagy in EMRA CD8+ T cells by regulating the p38IP-ATG9 interaction.
EMRA CD8+ T cells were stimulated for 2 hours with 0.5 μg/ml anti-CD3 and 5 ng/ml IL-2 plus either 0.1% DMSO or 500 nM BIRB 796. (A) ImageStream images showing colocalization of ATG9 with TGN46. 4 representative images per condition are shown: brightfield, TGN46 (green), ATG9 (red), and a merge of TGN46 and ATG9. (B) Colocalization of ATG9 with LAMP1. 4 representative images per condition are shown: brightfield, ATG9 (red), LAMP1 (blue), and a merge of ATG9 and LAMP1. Original magnification, ×60 (A and B). (C and D) Representative BDS overlay histogram of EMRA CD8+ T showing colocalization of TGN46 and ATG9 (C) and of LAMP1 and ATG9 (D). Colocalization index (BDS) of TGN46 and ATG9 (E) and of LAMP1 and ATG9 (F) (n = 4). *P < 0.05, **P < 0.01, repeated-measures ANOVA followed by Tukey correction.
Figure 7
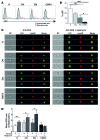
Figure 7. Increased autophagic activity in EMRA CD8+ T cells is achieved via an mTORC1-independent mechanism.
(A and B) Example (A) and data (B) of pS6 within the CD8+ T cell subsets following a 2-hour stimulation with 0.5 μg/ml anti-CD3 (n = 5). (C and D) CD8+ T cell subsets were stimulated for 2 hours with 0.5 μg/ml anti-CD3 and 5 ng/ml IL-2 plus either 0.1% DMSO or 100 nM rapamycin. (C) ImageStream images showing autophagy levels. 4 representative images for each condition are shown: brightfield, LC3 (green), Lyso-ID (red), and a merge of LC3 and Lyso-ID. Original magnification, ×60. (D) Colocalization index (BDS) of endogenous LC3 and Lyso-ID (n = 4). *P < 0.05, **P < 0.01, ***P < 0.001, repeated-measures ANOVA followed by Tukey correction.
Figure 6
Figure 6. Blocking the p38 MAPK pathway does not lead to metabolic remodeling.
(AD) EMRA CD8+ T cells were stimulated for 3 days with 0.5 μg/ml anti-CD3 and 5 ng/ml IL-2 plus 0.1% DMSO or 500 nM BIRB 796. (AC) Basal OCR (A), basal ECAR (B), and basal OCR/ECAR ratio (C) (n = 3). (D) Glut1 expression (n = 5). (EG) EMRA CD8+ T cells were stimulated for 2 hours with 0.5 μg/ml anti-CD3 and 5 ng/ml IL-2 plus either 0.1% DMSO or 500 nM BIRB 796. (E and F) ImageStream images showing autophagy levels without (E) and with (F) BIRB 796. 4 representative images for each condition are shown: brightfield (BF), LC3 (green), Lyso-ID (red), and a merge of LC3 and Lyso-ID. Original magnification, ×60. (G) Colocalization index (BDS) of endogenous LC3 and Lyso-ID (n = 4). *P < 0.05, **P < 0.01, paired t test.
Figure 5
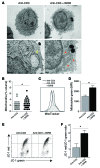
Figure 5. Inhibiting p38 MAPK pathways reverses mitochondrial dysfunction in EMRA CD8+ T cells.
EMRA CD8+ T cells were stimulated for 3 days with 0.5 μg/ml anti-CD3 and 5 ng/ml IL-2 plus either 0.1% DMSO or 500 nM BIRB 796. (A) Electron microscope images. Scale bars: 2 μM (top); 1 μM (bottom left); 0.5 μM (bottom right). (B) Percentage by cell volume of mitochondria, determined by a point counting grid method from 50 different electron microscope images. (C and D) Representative example (C) and data (D) showing expression of Mitotracker Green (n = 5). (E and F) Example (E) and data (F) showing JC-1 staining (n = 5). *P < 0.05, paired t test.
Figure 4
Figure 4. Signaling through p38 MAPK pathways contribute to reduced proliferation and telomerase activity of EMRA CD8+ T cells.
(A) Representative example of Ki67 staining on EMRA CD8+ T cells measured after 3 days of stimulation with 0.5 μg/ml anti-CD3 and 5 ng/ml IL-2 in the presence or absence of 500 nM BIRB 796. Numbers depict percent Ki67+ cells. (B) Effect of BIRB 796 on proliferation of EMRA CD8+ T cells activated as in A (n = 5). (C and D) Representative blot (C) and data (D) showing telomerase activity in EMRA CD8+ T cells on day 3 after activation as in A (n = 4). (E) Expression of IFN-γ, TNF-α, granzyme, and perforin in EMRA CD8+ T cells after an 8-hour stimulation with 0.5 μg/ml anti-CD3 (n = 5). *P < 0.05, paired t test.
Figure 3
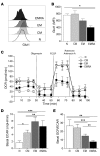
Figure 3. EMRA CD8+ T cells undergo anaerobic glycolysis.
(A and B) Examples (A) and data (B) showing Glut1 expression within CD45RA/CD27-defined CD8+ T cell subsets after overnight stimulation with 0.5 μg/ml anti-CD3 (n = 8). (C) OCR of CD8+ T cell subsets were measured after overnight stimulation with 0.5 μg/ml anti-CD3 and 5 ng/ml IL-2, and cells were then subjected to a metabolic stress test using the indicated mitochondrial inhibitors. Data are representative of 4 independent experiments. (D and E) Basal ECAR (D) and basal OCR/ECAR ratio (E) of the CD8+ T cell subsets after overnight stimulation with 0.5 μg/ml anti-CD3 and 5 ng/ml IL-2 (n = 4). *P < 0.05, **P < 0.01, ***P < 0.001, repeated-measures ANOVA followed by Tukey correction.
Figure 2
Figure 2. EMRA CD8+ T cells display mitochondrial impairment after stimulation.
CD45RA/CD27-defined CD8+ T cells were stimulated overnight with 0.5 μg/ml anti-CD3 and 5 ng/ml IL-2. (A) Electron microscope images. Arrows denote mitochondria. Scale bars: 1 μM. (B) Percentage by cell volume of mitochondria, determined by a point counting grid method from 10 different electron microscope images. (C and D) Representative examples (C) and data (D) showing the expression of Mitotracker Green (n = 8). (E) mtDNA/nDNA ratio (n = 4). (F and G) Representative example (F) and data (G) showing JC-1 staining (n = 5). The percentage of cells expressing JC-1 red and/or JC-1 green is indicated within the respective quadrants. *P < 0.05, **P < 0.01, ***P < 0.001, repeated-measures ANOVA followed by Tukey correction.
Figure 1
Figure 1. EMRA CD8+ T cells exhibit characteristics of senescent T cells.
(A) Multiparameter flow cytometry examining expression of the senescence features KLRG1, CD57, and γH2AX in the 4 CD45RA/CD27-defined CD8+ T cell subsets after an 8-hour stimulation with 0.5 μg/ml anti-CD3. Pie charts show the average of 7 donors. N, naive. (B) Representative blot showing telomerase activity on day 3 after activation with 0.5 μg/ml anti-CD3 and 5 ng/ml IL-2 (n = 4). Lanes were run on the same gel but were noncontiguous (black line). Telomerase activity was calculated by densitometry and expressed in arbitrary units relative to the internal standard (IS). (C) Representative immunoblots of p-p38 and total p38 together with β-actin after a 30-minute stimulation with 0.5 μg/ml anti-CD3 and 5 ng/ml IL-2. (D) Phosphoflow data after a 30-minute stimulation with 0.5 μg/ml PMA and ionomycin. Data are shown relative to the naive subset, n = 9. (E and F) ROS production, obtained using MitoSox (E) and DHE (F), in the CD8+ T cell subsets after overnight stimulation (n = 8). (G) Proliferation of CD8+ T cell subsets, assessed by Ki67 staining, after stimulation with 0.5 μg/ml anti-CD3 and 5 ng/ml IL-2 for 3 days. Horizontal lines depict means. (H) Multiparameter flow cytometry examining expression of IFN-γ, TNF-α, perforin, and granzyme B after an 8-hour stimulation with 0.5 μg/ml anti-CD3. Pie charts show the average of 7 donors. *P < 0.05, **P < 0.01, ***P < 0.001, repeated-measures ANOVA followed by Tukey correction.

References

    1. Campisi J, d’Adda di Fagagna F. Cellular senescence: when bad things happen to good cells. Nat Rev Mol Cell Biol. 2007;8(9):729–740. doi: 10.1038/nrm2233. - DOI - PubMed
    1. Passos JF, Von Zglinicki T. Oxygen free radicals in cell senescence: are they signal transducers? Free Radic Res. 2006;40(12):1277–1283. doi: 10.1080/10715760600917151. - DOI - PubMed
    1. Coppe JP, et al. Senescence-associated secretory phenotypes reveal cell-nonautonomous functions of oncogenic RAS and the p53 tumor suppressor. PLoS Biol. 2008;6(12):2853–2868. - PMC - PubMed
    1. Liu K, Hodes RJ, Weng N. Cutting edge: telomerase activation in human T lymphocytes does not require increase in telomerase reverse transcriptase (hTERT) protein but is associated with hTERT phosphorylation and nuclear translocation. J Immunol. 2001;166(8):4826–4830. doi: 10.4049/jimmunol.166.8.4826. - DOI - PubMed
    1. Plunkett FJ, et al. The impact of telomere erosion on memory CD8+ T cells in patients with X-linked lymphoproliferative syndrome. Mech Ageing Dev. 2005;126(8):855–865. doi: 10.1016/j.mad.2005.03.006. - DOI - PubMed

Publication types

MeSH terms

Substances