. 2014 Aug 1:14:204.
doi: 10.1186/s12870-014-0204-8.

Adaptive expansion of the maize maternally expressed gene (Meg) family involves changes in expression patterns and protein secondary structures of its members

Affiliations

Adaptive expansion of the maize maternally expressed gene (Meg) family involves changes in expression patterns and protein secondary structures of its members

Yuqing Xiong et al. BMC Plant Biol. .

Abstract

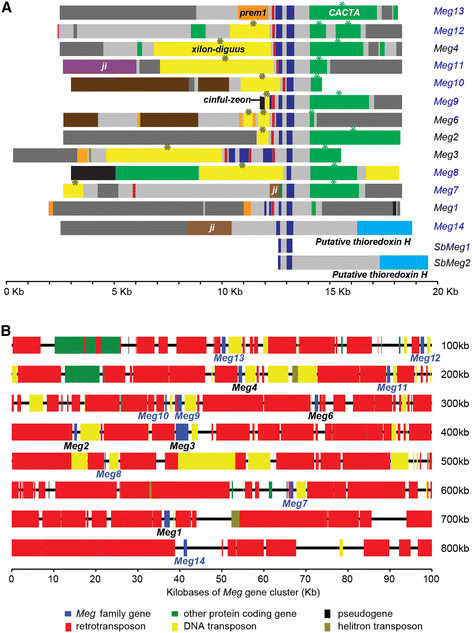
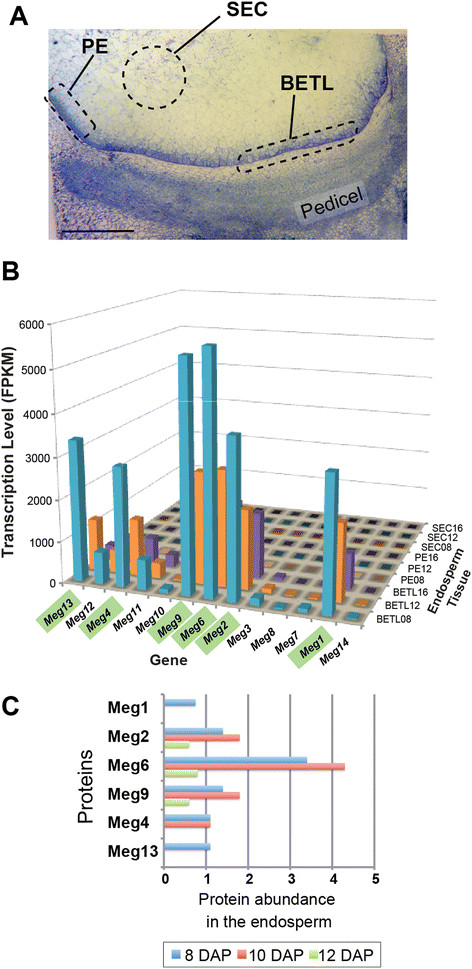
Background: The Maternally expressed gene (Meg) family is a locally-duplicated gene family of maize which encodes cysteine-rich proteins (CRPs). The founding member of the family, Meg1, is required for normal development of the basal endosperm transfer cell layer (BETL) and is involved in the allocation of maternal nutrients to growing seeds. Despite the important roles of Meg1 in maize seed development, the evolutionary history of the Meg cluster and the activities of the duplicate genes are not understood.

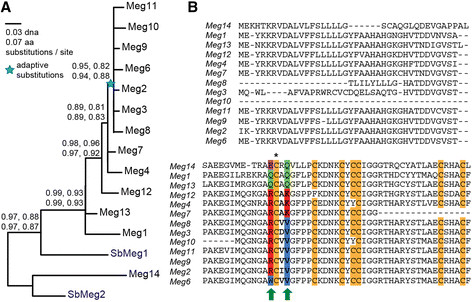
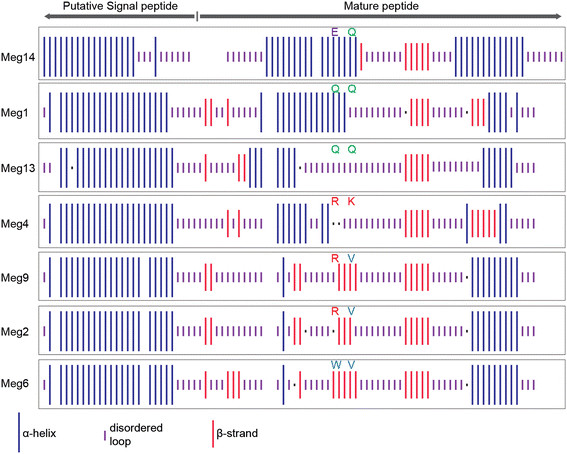
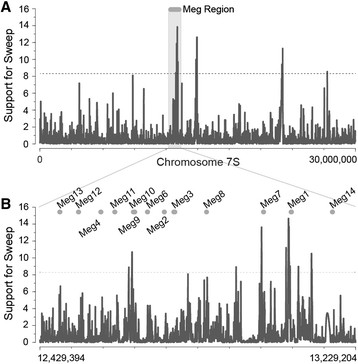
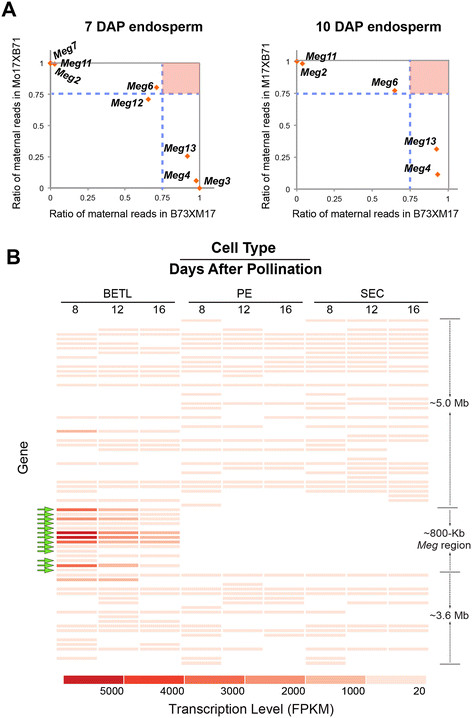
Results: In maize, the Meg gene cluster resides in a 2.3 Mb-long genomic region that exhibits many features of non-centromeric heterochromatin. Using phylogenetic reconstruction and syntenic alignments, we identified the pedigree of the Meg family, in which 11 of its 13 members arose in maize after allotetraploidization ~4.8 mya. Phylogenetic and population-genetic analyses identified possible signatures suggesting recent positive selection in Meg homologs. Structural analyses of the Meg proteins indicated potentially adaptive changes in secondary structure from α-helix to β-strand during the expansion. Transcriptomic analysis of the maize endosperm indicated that 6 Meg genes are selectively activated in the BETL, and younger Meg genes are more active than older ones. In endosperms from B73 by Mo17 reciprocal crosses, most Meg genes did not display parent-specific expression patterns.

Conclusions: Recently-duplicated Meg genes have different protein secondary structures, and their expressions in the BETL dominate over those of older members. Together with the signs of positive selections in the young Meg genes, these results suggest that the expansion of the Meg family involves potentially adaptive transitions in which new members with novel functions prevailed over older members.


Figures

Figure 1
Figure 1
Gene structures and genomic arrangement of the 13Meggenes in maize. (A)Meg genes and their flanking regions are aligned to illustrate their gene structures. Promoters and exons of Meg genes are depicted as red and blue rectangles, respectively. Note that Meg14 is missing the canonical Meg promoter. Each superfamily of transposons is shown as a rectangle with the following color codes: xillon-digus - yellow, prem1 - orange, ji - brown. The transposon insertions within 10 kb upstream and 5 kb downstream of each gene model are shown. All of the Meg genes except Meg1, Meg13 and Meg14 have xillon-digus on their 5’ side and CACTA sequences on their 3’ side (asterisks). Two putative H-type thioredoxins downstream of Meg14 and SbMeg2 are colored light blue. All other regions are colored gray. All components of the region were drawn to scale according to their physical sizes. (B) The 800 kb region in chromosome 7S that contains the 13 Meg genes is detailed. Color codes for the 6 main elements in the region are provided under the diagram.
Figure 2
Figure 2
Phylogenetic analyses of maizeMeggenes identifies adaptative amino acid substitutions. (A) We reconstructed maximum likelihood phylogenies from protein and corresponding DNA sequence data. SH-like aLRT support [28] at key nodes is shown for protein sequence data with and without Gblocks [29] processing to remove unreliable alignment positions (top row) and DNA alignments with and without Gblocks processing (bottom row). Nodes having <0.8 SH-like aLRT support in any analysis are collapsed, and the tree is rooted using gene-species tree reconciliation to minimize duplication/loss events. A blue star indicates significant support for adaptative substitutions in that specific branch (p < 0.05 after correcting for multiple tests), inferred using codon-based analysis (see Methods). (B) We plot amino-acid substitutions inferred as adaptive by branch-sites analysis (Zhang et al) [30] along the alignment of Meg protein sequences (green arrows). Biochemical properties of amino acids are marked as pink for hydrophilic polar, green for hydrophilic polar uncharged, red for hydrophilic polar basic, and blue for hydrophobic nonpolar amino acids. Conserved cysteine residues are highlighted in orange.
Figure 3
Figure 3
Meg protein secondary structure has changed over the maize-specific gene family expansion. The secondary structures of Meg proteins were predicted using different algorithms on the Network sequence analysis server (NPS@, Network Protein Sequence Analysis, http://npsa-pbil.ibcp.fr). The α-helix, β-strand and disordered loop regions are denoted by the longest, the second longest and the second shortest bars, respectively. The shortest bars represent residues with ambiguous states. The symbols of positively selected amino acids are shown above the corresponding bars. Gaps were introduced according to the amino acid sequence alignment in order to align secondary structural elements for visualization. The figure illustrates amino acid sequences of Meg genes whose coding sequences are intact.
Figure 4
Figure 4
Selective sweeps in maizeMeggene region identified by composite-likelihood analysis. We used a spatially-explicit likelihood model to identify recent selective sweeps within the region of maize chromosome 7S containing the Meg gene array from polymorphism data (see Methods). We plot the log-likelihood support in favor of a selective sweep model along chromosome position. A dotted horizontal line indicates the empirically-derived 0.05 significance cutoff, with log-likelihood greater than the dotted line indicating significant support for a selective sweep. (A) We plot support for a selective sweep across the 30-Mb region of chromosome 7S containing the Meg gene region. (B) Close-up of the chromosomal region containing the Meg gene cluster, with each Meg gene’s coding sequence indicated.
Figure 5
Figure 5
SpecificMeghomologs are highly expressed in maize endosperm. (A) Bright-field micrograph of a maize endosperm at 8 days after pollination (DAP), showing the basal endosperm transfer cell (BETC), peripheral endosperm (PE) and starchy endosperm cell (SEC) layers. These three tissue types were isolated by cryo-microdissection, and gene-specific transcripts were evaluated by RNA-seq. Scale bar: 0.5 ○m. (B) Transcript levels of each Meg gene in the BETC, PE and SEC. The six highly-expressed genes are highlighted in green. Note that Meg transcripts are detected exclusively in BETC. (C) Abundances of Meg proteins in the maize endosperm at three developmental stages. The histogram is based on results from searching the maizeproteome.ucsd.edu. Meg proteins not found in the proteome database are omitted from the histogram. The x-axis is scaled to the normalized arbitrary unit according to the maize proteome database.
Figure 6
Figure 6
Imprinting status ofMeggenes and endosperm expression patterns of non-Meggenes in theMegregion. (A) Maternal expression ratios of Meg genes at 7 DAP (left panel) and 10 DAP (right panel) endosperms from B73XM17 reciprocal crosses. The horizontal and vertical dotted lines mark boundaries of 3:1 maternal and paternal expression ratio in each cross. If the maternal allele of a gene is expressed 3 times more than its paternal allele, the gene should appear in the upper right corner (red square). The ratios were calculated from the endosperm transcriptome data by Xin et al.[39]. Expression of Meg genes was not detected in 15 DAP endosperm. (B) Heat map depicting the transcriptional activities in BETCs of genes within a ~9.4-Mb region spanning the Meg gene cluster in. Normalized gene expression level (FPKM) was used to generate the graphic. Meg genes are marked with green arrows. The FPKM values of the 6 highly-expressed Meg genes are far larger (>3000) than those of any other genes in the 9.4 Mb interval. Genes with FPKM < 20 in any of the nine samples were omitted from the heat map.

References

    1. Talbot MJ, Offler CE, McCurdy DW. Transfer cell wall architecture: a contribution towards understanding localized wall deposition. Protoplasma. 2002;219(3–4):197–209. doi: 10.1007/s007090200021. - DOI - PubMed
    1. Offler CE, McCurdy DW, Patrick JW, Talbot MJ. Transfer cells: Cells specialized for a special purpose. Annu Rev Plant Biol. 2003;54:431–454. doi: 10.1146/annurev.arplant.54.031902.134812. - DOI - PubMed
    1. Marshall E, Costa LM, Gutierrez-Marcos J. Cysteine-rich peptides (CRPs) mediate diverse aspects of cell-cell communication in plant reproduction and development. J Exp Bot. 2011;62(5):1677–1686. doi: 10.1093/jxb/err002. - DOI - PubMed
    1. Silverstein KA, Moskal WA Jr, Wu HC, Underwood BA, Graham MA, Town CD, VandenBosch KA. Small cysteine-rich peptides resembling antimicrobial peptides have been under-predicted in plants. Plant J. 2007;51(2):262–280. doi: 10.1111/j.1365-313X.2007.03136.x. - DOI - PubMed
    1. Wheeler MJ, Vatovec S, Franklin-Tong VE. The pollen S-determinant in Papaver: comparisons with known plant receptors and protein ligand partners. J Exp Bot. 2010;61(7):2015–2025. doi: 10.1093/jxb/erp383. - DOI - PubMed

Publication types

LinkOut - more resources