. 2014 Oct;13(10):1312-27.
doi: 10.1128/EC.00165-14. Epub 2014 Aug 1.

Golgi UDP-GlcNAc:polypeptide O-α-N-Acetyl-d-glucosaminyltransferase 2 (TcOGNT2) regulates trypomastigote production and function in Trypanosoma cruzi

Affiliations

Golgi UDP-GlcNAc:polypeptide O-α-N-Acetyl-d-glucosaminyltransferase 2 (TcOGNT2) regulates trypomastigote production and function in Trypanosoma cruzi

Carolina M Koeller et al. Eukaryot Cell. 2014 Oct.

Abstract

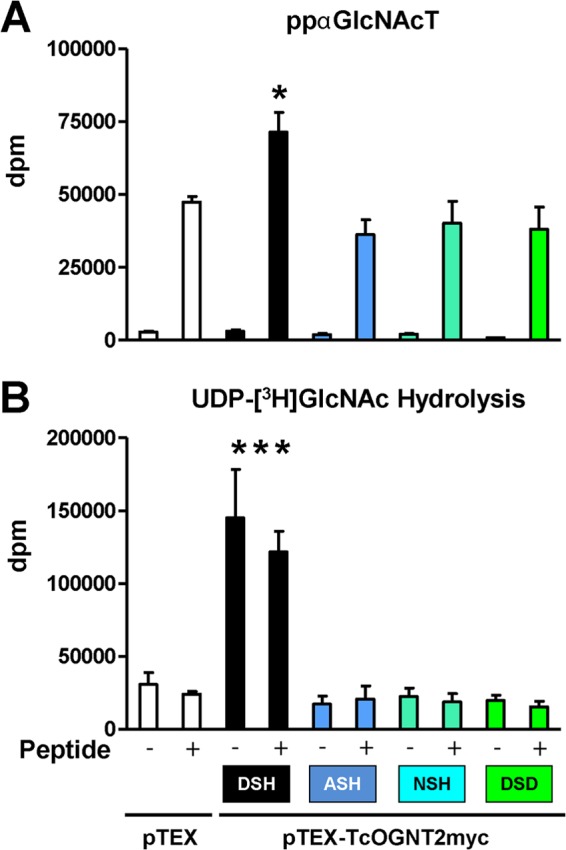
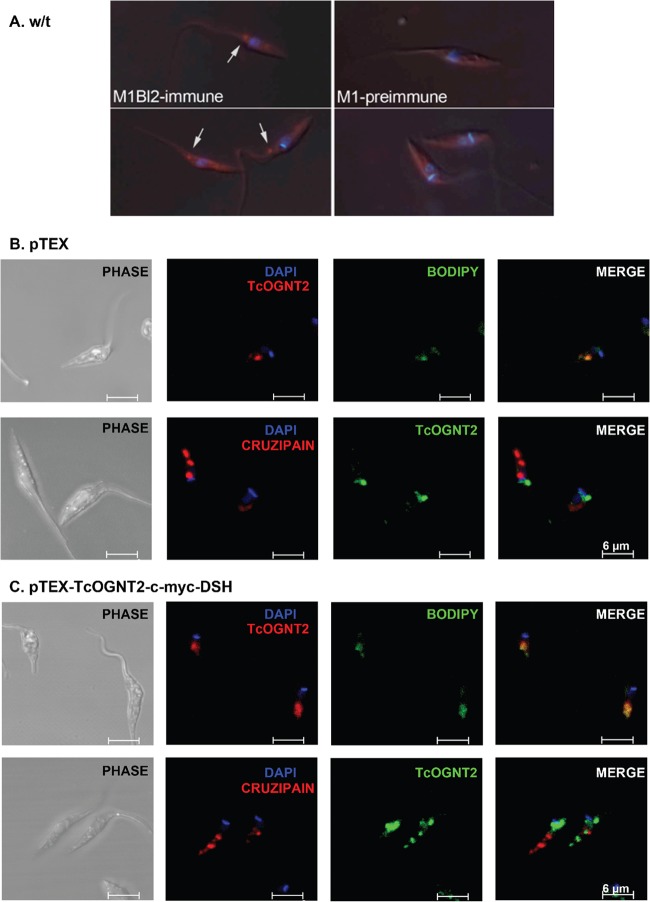
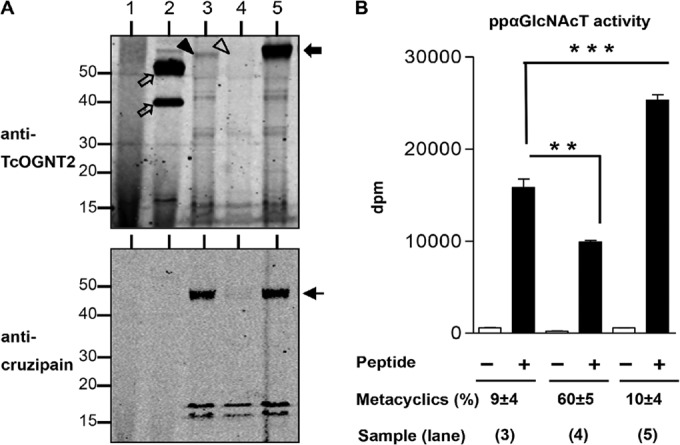
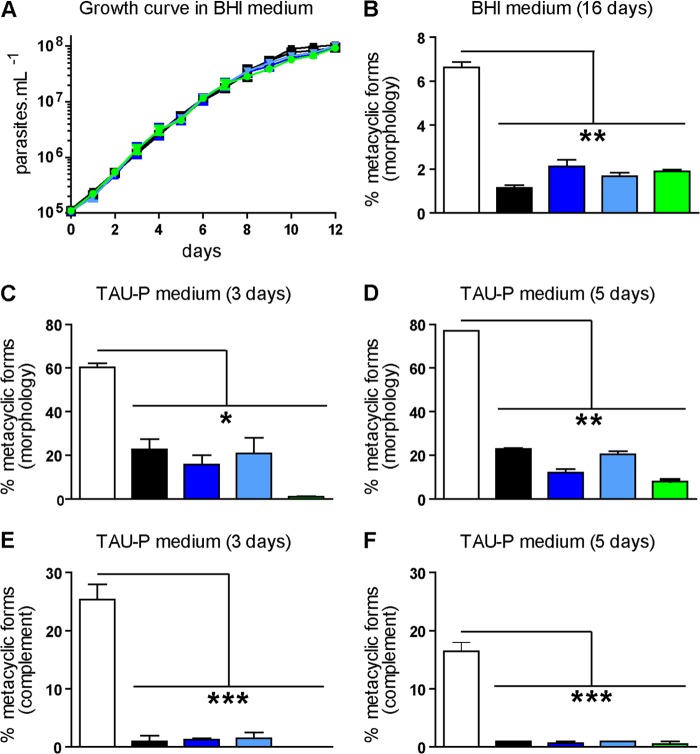
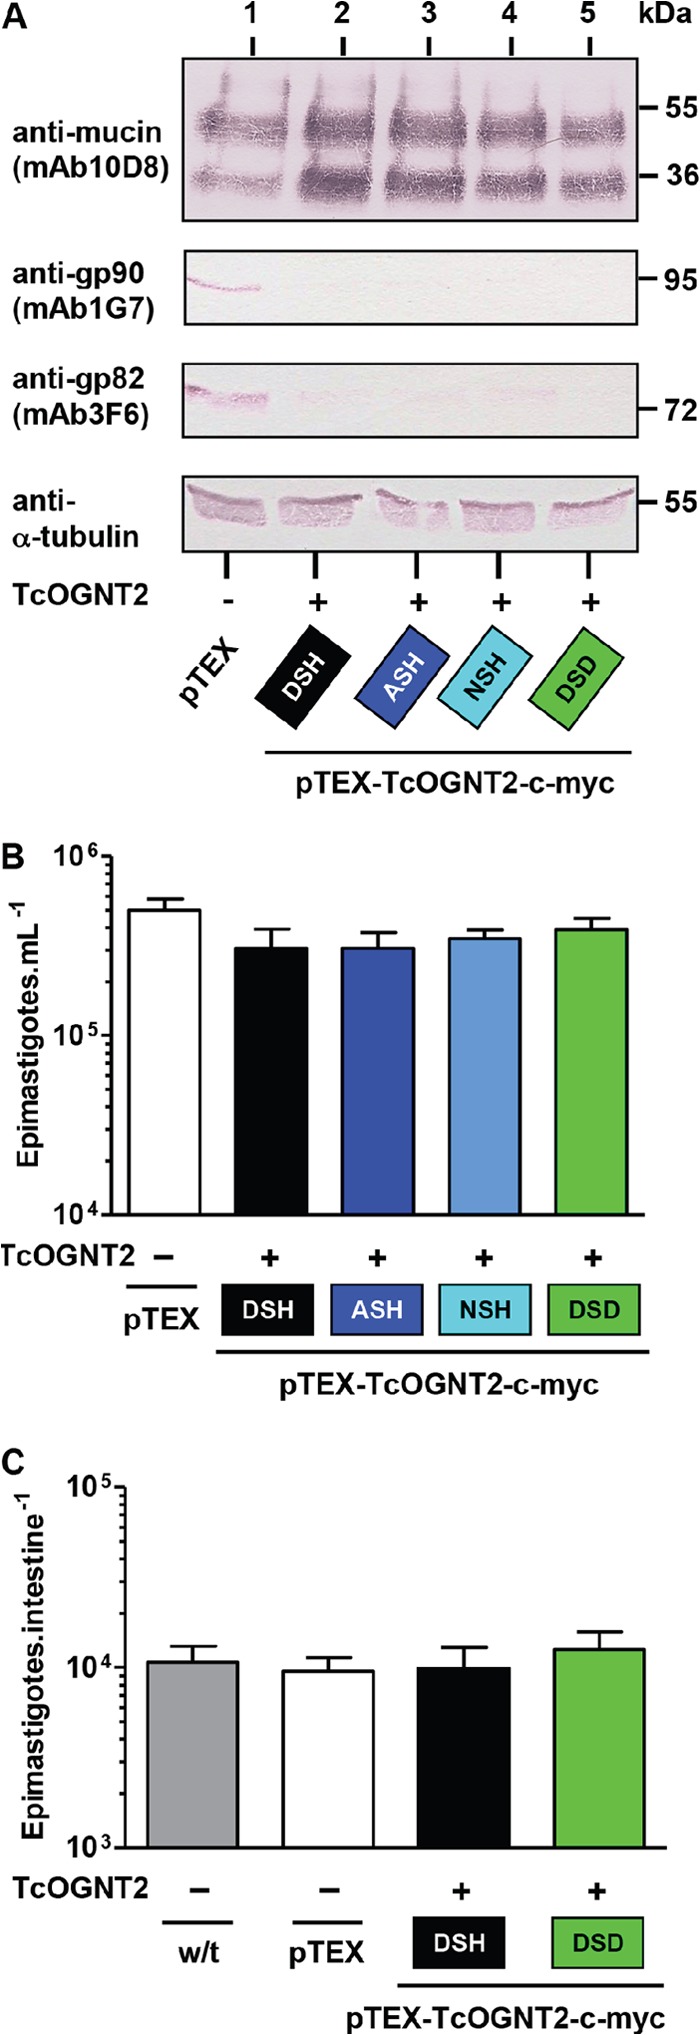
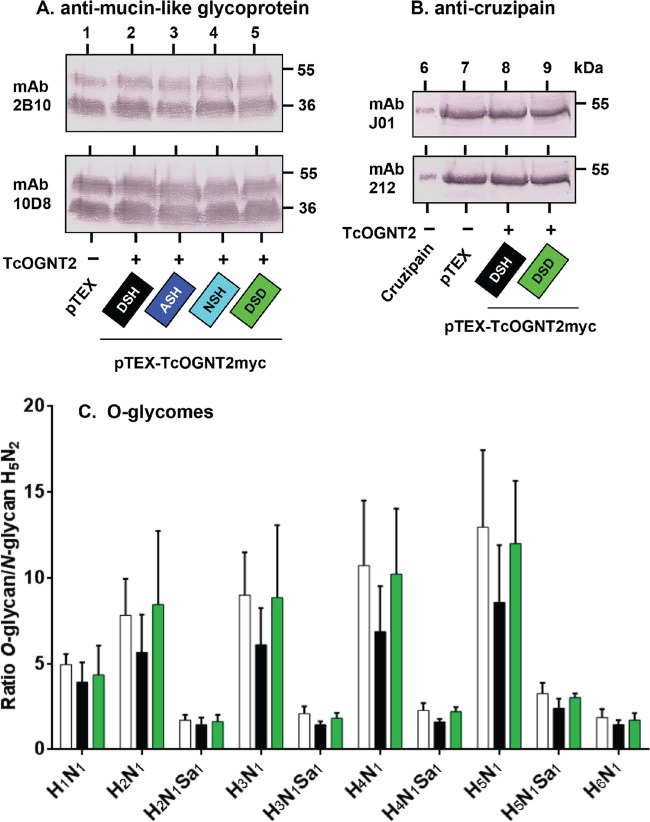
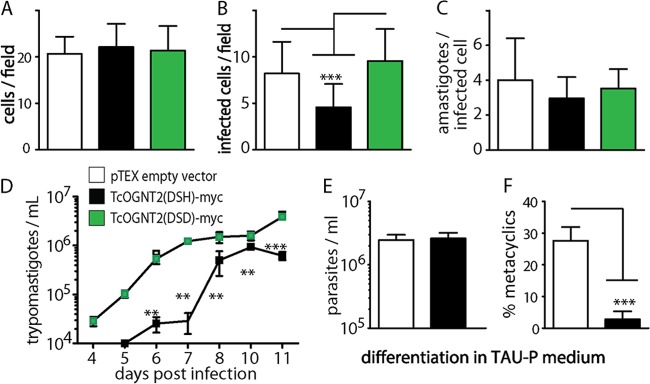
All life cycle stages of the protozoan parasite Trypanosoma cruzi are enveloped by mucin-like glycoproteins which, despite major changes in their polypeptide cores, are extensively and similarly O-glycosylated. O-Glycan biosynthesis is initiated by the addition of αGlcNAc to Thr in a reaction catalyzed by Golgi UDP-GlcNAc:polypeptide O-α-N-acetyl-d-glucosaminyltransferases (ppαGlcNAcTs), which are encoded by TcOGNT1 and TcOGNT2. We now directly show that TcOGNT2 is associated with the Golgi apparatus of the epimastigote stage and is markedly downregulated in both differentiated metacyclic trypomastigotes (MCTs) and cell culture-derived trypomastigotes (TCTs). The significance of downregulation was examined by forced continued expression of TcOGNT2, which resulted in a substantial increase of TcOGNT2 protein levels but only modestly increased ppαGlcNAcT activity in extracts and altered cell surface glycosylation in TCTs. Constitutive TcOGNT2 overexpression had no discernible effect on proliferating epimastigotes but negatively affected production of both types of trypomastigotes. MCTs differentiated from epimastigotes at a low frequency, though they were apparently normal based on morphological and biochemical criteria. However, these MCTs exhibited an impaired ability to produce amastigotes and TCTs in cell culture monolayers, most likely due to a reduced infection frequency. Remarkably, inhibition of MCT production did not depend on TcOGNT2 catalytic activity, whereas TCT production was inhibited only by active TcOGNT2. These findings indicate that TcOGNT2 downregulation is important for proper differentiation of MCTs and functioning of TCTs and that TcOGNT2 regulates these functions by using both catalytic and noncatalytic mechanisms.


Figures

FIG 1
FIG 1
Western blot analysis of TcOGNT2 expression. (A) Epimastigotes transfected with pTEX (lanes 3) or wt (lanes 4) or mutant (lanes 5 to 7) versions of TcOGNT2myc were subjected to SDS-PAGE, Western blotted using affinity-purified anti-TcOGNT2, MAb 9E10 against the myc tag, or anti-tubulin (as a loading control), and detected using alkaline phosphatase-coupled secondary antibodies. A previously characterized (21) culture supernatant from L. tarentolae secreting ΔTcOGNT2, which is subject to partial proteolytic cleavage, and a naive culture supernatant are shown in lanes 2 and 1, respectively. (B) Subcellular fractionation. TcOGNT2myc-expressing epimastigotes were mechanically disrupted, fractionated by differential centrifugation, and Western blotted using anti-TcOGNT2 and anti-myc antibodies. Fractions are labeled according to the supernatant (S) or pellet (P) formed at the indicated centrifugation speed (× g [× 10−3]). ΔTcOGNT2 was included as a control. (C) P100 fractions from TcOGNT2myc-expressing and pTEX control epimastigotes were compared using affinity-purified anti-TcOGNT2. (D) N-Glycosylation analysis. P100 fractions (100 μg of protein) from TcOGNT2myc-expressing and pTEX control epimastigotes were analyzed after treatment with active (+) or heat-inactivated (−) PNGase F or endo H, using anti-TcOGNT2 as described above. ΔTcOGNT2 (lanes 5) was included as a control.
FIG 2
FIG 2
Enzymatic activities of TcOGNT2myc expression strains. ppαGlcNAcT (A) and UDP-GlcNAc hydrolysis (B) activities in epimastigote microsomal (P100) fractions from the TcOGNT2myc expression and pTEX control strains were measured using UDP-[3H]GlcNAc. As indicated, assays were performed in the absence (−) or presence (+) of the T16 peptide acceptor substrate. Experiments were performed 3 times in triplicate, and the results are expressed as means and standard errors of the means (SEM). Significant increases relative to the pTEX control are indicated as follows: *, P < 0.05; and ***, P < 0.001.
FIG 3
FIG 3
Immunofluorescence localization of endogenous and overexpressed TcOGNT2myc. (A) Comparison of non-affinity-purified anti-TcOGNT2 and preimmune sera applied to wt epimastigotes and analyzed by standard epifluorescence microscopy. Arrows indicate single Golgi-like localizations near DAPI-labeled nuclei and kinetoplasts. Control (pTEX) (B) or TcOGNT2myc-expressing (C) epimastigote forms were colabeled with affinity-purified anti-TcOGNT2 and rabbit anti-cruzipain (reservosome marker) or the BODIPY FL C5-ceramide-BSA complex (Golgi marker), as indicated. Maximum projection images collected by confocal microscopy are shown. DAPI staining is shown in blue.
FIG 4
FIG 4
Downregulation of TcOGNT2 and ppαGlcNAcT activities during metacyclogenesis. (A) Western blot detection of TcOGNT2. Total membrane extracts prepared from wt epimastigotes (lanes 3) or parasites induced in TAU-P (MCT enriched; lanes 4) were sequentially probed with affinity-purified anti-TcOGNT2 (top) and rabbit anti-cruzipain (bottom) and separately imaged using distinct Alexa Fluor-coupled secondary Abs. Blots also contained a similar extract from TcOGNT2myc-expressing epimastigotes (lanes 5) and ΔTcOGNT2-positive (lanes 2) and -negative (lanes 1) conditioned media from L. tarentolae, as controls. The migration positions of endogenous TcOGNT2 expressed by epimastigotes (closed arrowhead) and metacyclic trypomastigotes (MCTs) (open arrowhead) are indicated, together with overexpressed TcOGNT2myc (closed arrow) and ΔTcOGNT2 and its N-terminal proteolytic fragment (open arrows). The position of intact membrane-associated cruzipain (arrow) is shown in the bottom panel. (B) ppαGlcNAcT activities in crude membrane extracts obtained from wt epimastigotes, MCT-enriched cultures, and epimastigotes overexpressing wt TcOGNT2(DSH)myc. Samples (5 × 10⁶ cell equivalents reaction mix−1) from panel A were assayed as described in the legend to Fig. 2A, in the absence or presence of the T16 peptide. Values are means and SEM (n = 3). Asterisks indicate statistical significance as follows: **, P < 0.01; and ***, P < 0.001. The percentages of metacyclic forms (± SEM) were determined by morphology.
FIG 5
FIG 5
Metacyclogenic competence of TcOGNT2myc-expressing strains. (A) Proliferation of epimastigotes transfected with pTEX (control; open squares) or pTEX containing wt TcOGNT2myc (DSH; black squares) or mutant TcOGNT2myc (ASH, blue squares; NSH, light blue squares; and DSD, green squares) was assessed by daily counting in a Neubauer chamber. (B) Percentages of metacyclic forms in aged BHI medium cultures (16 days) were estimated by morphology. (C to F) Metacyclogenesis was induced in TAU-P medium, and the percentage of MCTs was evaluated by morphology (C and D) or resistance to lysis by the alternative pathway of complement (E and F) after 3 (C and E) or 5 (D and F) days of culture. Results are means and SEM from three independent experiments performed in triplicate. Asterisks indicate statistical significance compared to controls, as follows: *, P < 0.05; **, P < 0.01; and ***, P < 0.001.
FIG 6
FIG 6
Metacyclic markers and activities after metacyclogenic induction. (A) Expression of mucin-like glycoproteins by parasites transfected with the different pTEX constructs (color coded as indicated) was examined by Western blotting after 3 days of differentiation in TAU-P medium, using MAb 10D8 (anti-gp35/50), MAb 1G7 (anti-gp90), and MAb 3F6 (anti-gp82). Anti-α-tubulin served as a loading control. (B) Transfected epimastigotes were maintained for 3 days in TAU-P medium, and the number of parasites in each culture supernatant was estimated by direct counting using a Neubauer chamber. (C) Epimastigotes (2 × 10⁶) were incubated with the surfaces of dissected posterior midguts of Rhodnius prolixus insects for 1 h, and the number of attached parasites was estimated by direct counting. Results are from 4 independent experiments with 5 replicates each and are expressed as means and SEM. No statistically significant differences were observed.
FIG 7
FIG 7
O-Glycosylation studies. (A and B) Expression of mucin-like glycoproteins (lanes 1 to 5) and cruzipain (lanes 7 to 9) in epimastigotes transfected with the different pTEX constructs was monitored by Western blotting as described in the legend to Fig. 1, using the indicated MAbs. Lanes 6 contain purified recombinant cruzipain as a positive control. (C) O-Glycomic studies. Mucin-like glycoproteins from epimastigotes transfected with pTEX (control; white bars) or expressing wt TcOGNT2 (black bars) or mutant TcOGNT2 (DSD; green bars) were subjected to β-elimination, and the released glycans were permethylated and profiled by MALDI-TOF MS in positive-ion mode. Examples of spectra are shown in Fig. S2 in the supplemental material. O-Glycan classes are labeled according to their hexose (H), N-acetylhexosamine (N), and N-acetylneuraminic acid (Sa) compositions, and their abundances were quantified as ratios relative to a standard N-glycan (H5N2) ion used as an internal reference. Data (means and SEM) are results from 5 independent experiments (n = 5).
FIG 8
FIG 8
Cell culture-derived trypomastigotes (TCTs). TCTs transfected with pTEX (white bars), pTEX-TcOGNT2(DSH)myc (black bars), or pTEX-TcOGNT2(DSD)myc (green bars) were isolated from the culture medium of LLCMK2 cells (monkey kidney epithelial cells) infected with MCTs induced in vitro from epimastigotes. (A to C) LLCMK2 cells plated on glass coverslips in 24-well plates were incubated with TCTs at an MOI of 20 parasites per cell. After 4 h, wells were washed 5 times, and the coverslips were fixed and stained with InstantProv hematological stain. The numbers of total (A) and infected (B) epithelial cells per field and the number of amastigotes per infected cell (C) were estimated by direct counting of ≥300 fields. (D) LLCMK2 cells were incubated with TCTs at an MOI of 20. After 4 h, each culture flask was washed 5 times, followed by incubation for 11 days. TCT density was determined by direct counting. (E and F) Epimastigotes derived from TCT forms were transferred to TAU-P and incubated at 28°C to induce metacyclogenesis. After 3 days, parasite density (E) was determined by direct counting, and the percentage of MCTs was estimated by resistance to lysis by the alternative pathway of complement (F). Results are means ± SD from three independent experiments (n = 2). Asterisks indicate statistical significance (***, P < 0.001).
FIG 9
FIG 9
Biochemical analysis of TcOGNT2myc-expressing TCTs. (A) TCTs or epimastigotes from strains transfected with pTEX (−) or wt TcOGNT2(DSH)myc (+) were subjected to SDS-PAGE and Western blotted using anti-TcOGNT2 (top) or anti-tubulin (bottom). Protein standards are indicated on the right, in kDa. (B) ppαGlcNAcT activity in crude membrane extracts obtained from TCTs transfected with pTEX vector (white bars), pTEXTcOGNT2myc-DSH (black bars), or pTEX-TcOGNT2myc-DSD (green bars). Samples (5 × 10⁶ cell equivalents reaction mix−1) were assayed as described in the legend to Fig. 2A, in the absence (−) or presence (+) of the T16 peptide. Values are means and SD (n = 3). (C and D) TCTs (5 × 10⁶) were incubated with fluorescent WGA, ConA, GS-IB4, or MAA lectin and analyzed by flow cytometry as shown in Fig. S6 in the supplemental material. Graphs summarize the percentages of labeled cells (C) and the mean fluorescence intensities (D) for each lectin. Bars represent the means and SEM from at least 3 independent experiments (n = 3). Asterisks indicate statistical significance compared to control cells transfected with empty pTEX or pTEX-TcOGNT2(DSD)myc, as follows: *, P < 0.05; and ***, 0.001.

Similar articles

Cited by

References

    1. Leslie M. 2011. Drug developers finally take aim at a neglected disease. Science 333:933–935. 10.1126/science.333.6045.933 - DOI - PubMed
    1. Azambuja P, Ratcliffe NA, Garcia ES. 2005. Towards an understanding of the interaction of Trypanosoma cruzi and T. rangeli within the reduviid insect host Rhodnius prolixus. An. Acad. Bras. Ci. 77:397–404. 10.1590/S0001-37652005000300004 - DOI - PubMed
    1. Fernandes MC, Andrews NW. 2012. Host cell invasion by Trypanosoma cruzi: a unique strategy that promotes persistence. FEMS Microbiol. Rev. 36:734–747. 10.1111/j.1574-6976.2012.00333.x - DOI - PMC - PubMed
    1. Carvalho-Moreira CJ, Spata MCD, Coura JR, Garcia ES, Azambuja P, Gonzalez MS, Mello CB. 2003. In vivo and in vitro metacyclogenesis tests of two strains of Trypanosoma cruzi in the triatomine vectors Triatoma pseudomaculata and Rhodnius neglectus: short/long-term and comparative study. Exp. Parasitol. 103:102–111. 10.1016/S0014-4894(03)00072-9 - DOI - PubMed
    1. Dias E. 1934. Estudos sobre o Schyzotrypanum cruzi. Mem. Inst. Oswaldo Cruz 28:1–110

Publication types

MeSH terms

LinkOut - more resources