. 2014 Sep 12;289(37):25431-44.
doi: 10.1074/jbc.M113.527267. Epub 2014 Aug 1.

Inhibition of epithelial to mesenchymal transition by E-cadherin up-regulation via repression of slug transcription and inhibition of E-cadherin degradation: dual role of scaffold/matrix attachment region-binding protein 1 (SMAR1) in breast cancer cells

Affiliations

Inhibition of epithelial to mesenchymal transition by E-cadherin up-regulation via repression of slug transcription and inhibition of E-cadherin degradation: dual role of scaffold/matrix attachment region-binding protein 1 (SMAR1) in breast cancer cells

Arghya Adhikary et al. J Biol Chem. .

Abstract

The evolution of the cancer cell into a metastatic entity is the major cause of death in patients with cancer. It has been acknowledged that aberrant activation of a latent embryonic program, known as the epithelial-mesenchymal transition (EMT), can endow cancer cells with the migratory and invasive capabilities associated with metastatic competence for which E-cadherin switch is a well-established hallmark. Discerning the molecular mechanisms that regulate E-cadherin expression is therefore critical for understanding tumor invasiveness and metastasis. Here we report that SMAR1 overexpression inhibits EMT and decelerates the migratory potential of breast cancer cells by up-regulating E-cadherin in a bidirectional manner. While SMAR1-dependent transcriptional repression of Slug by direct recruitment of SMAR1/HDAC1 complex to the matrix attachment region site present in the Slug promoter restores E-cadherin expression, SMAR1 also hinders E-cadherin-MDM2 interaction thereby reducing ubiquitination and degradation of E-cadherin protein. Consistently, siRNA knockdown of SMAR1 expression in these breast cancer cells results in a coordinative action of Slug-mediated repression of E-cadherin transcription, as well as degradation of E-cadherin protein through MDM2, up-regulating breast cancer cell migration. These results indicate a crucial role for SMAR1 in restraining breast cancer cell migration and suggest the candidature of this scaffold matrix-associated region-binding protein as a tumor suppressor.

Keywords: Cadherin-1 (CDH1) (Epithelial Cadherin) (E-cadherin); E3 Ubiquitin Ligase; Epithelial-Mesenchymal Transition (EMT); Metastasis; Migration.


Figures

FIGURE 1.
FIGURE 1.
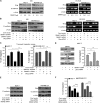
Altered migratory potential of different breast cancer cell lines are associated with SMAR1 expression. A, Western blot analysis depicting the changes in SMAR1 expression pattern in MCF-7, HBL-100, MDAMB-231, MDAMB-468 cells. B, rate of migration of breast carcinoma cells like MCF-7, HBL-100, MDAMB-231, MDAMB-468 with differential SMAR1 expressions were assessed for different time periods using the unidirectional wound healing assay (left panel); Graphical representation of the percentage of cell migration of MCF-7, HBL-100, MDAMB-231, MDAMB-468 cells as determined from wound healing assay (right upper panel) and trans-well migration assay (right lower panel). Columns show mean number of motile cells per 23-μm field from six independent experiments; bars, S.D. Each experiment was conducted in duplicate where ten 23-μm fields (five per duplicate) were counted, and the means calculated. A paired Student's t test (*, p < 0.005) was done on the means from six experiments. The percentage of migration for control MCF-7 cells has been denoted as 100% and the comparison with the other cell lines have been made accordingly. C, graphical representation of the average distance migrated by MCF-7, HBL-100, MDAMB-231, MDAMB-468 cells as determined by ImageJ software from wound healing assay. Columns show average distance migrated by 100 motile cells per 23-μm field from three independent experiments. The value for MCF-7 was considered as 100%. D, comparative analysis between the fold changes in SMAR1 expression and percentage of cell migration in MCF-7, HBL-100, MDAMB-231, and MDAMB-468 cells. E, control/SMAR1 cDNA-transfected MCF-7, HBL-100, MDAMB-231, and MDAMB-468 cells were assessed for percentage of cell migration using unidirectional wound healing assay for 0 and 24 h; F, graphical representation of the percentage of cell migration in control/SMAR1 shRNA-transfected MCF-7 and HBL-100 cells respectively (upper two panels; expression levels of SMAR1 in control/SMAR1 shRNA-transfected MCF-7 and HBL-100 cells in inset) and in control and SMAR1 overexpressed MDAMB-231 and MDAMB-468 cells (lower two panels; expression levels of SMAR1 in control/SMAR1 cDNA-transfected MDAMB-231 and MDAMB-468 cells in inset) using wound healing assay and transwell migration assay, respectively; **, p < 0.01, and ***, p < 0.001 compared with no transfection. α-actin was used as internal control. Values are mean ± S.E. of three independent experiments in each case.
FIGURE 2.
FIGURE 2.
SMAR1-mediated retardation in breast cancer cell migration is associated with up-regulation in E-cadherin expression. A, phase contrast images taken by light microscope of control/SMAR1 shRNA transfected MCF-7 cells depicting changes in EMT phenotype. Arrows indicate induction of EMT phenotype. B, Western blot analysis furnishing the changes in E-cadherin, cytokeratin 18, and vimentin expression patterns in MCF-7, HBL-100, MDAMB-231, and MDAMB-468 cells (left panel), and in MCF-7 and MDAMB-231 cells transfected with different concentrations of SMAR1 cDNA (right panel). C, Percentage of cell migration was determined respectively by transwell migration assay. D, cellular surface localization of E-cadherin was determined with specific anti-E-cadherin antibody using fluorescence microscopy in MCF-7 and MDAMB-231 cells transfected with increasing concentration of SMAR1 cDNA. E, MCF-7 and MDAMB-231 cells were transfected with SMAR1 cDNA/SMAR1 shRNA and E-cadherin/SMAR1 was determined at protein level by Western blotting (left panel) and mRNA level by RT-PCR analysis (right panel). F, expression of E-cadherin was evaluated by flow cytometry with specific anti-E-cadherin antibody in both MCF-7 and MDAMB-231 cells transfected with SMAR1 cDNA/SMAR1 shRNA compared with nontransfected cells. These results are representative of three independent experiments.
FIGURE 3.
FIGURE 3.
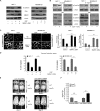
Interaction of SMAR1 with MDM2 regulates the degradation of E-cadherin. A, Western blot analysis depicting the changes in the pattern of ubiquitination of immune-precipitated E-cadherin in MCF-7 and MDAMB-231 cells on overexpression and knock-down of SMAR1 with anti-E-cadherin antibody and immunoblotting with anti-Ub antibody in proteasome inhibitor MG132-treated cells. B, changes in the E-cadherin protein turnover was determined by immunoblotting using anti E-cadherin antibody up on cycloheximide treatment for designated time points in SMAR1-depleted/SMAR1 overexpressed MCF-7 and MDAMB-231 cells. C, changes in the MDM2 expression patterns in control/SMAR1 cDNA/SMAR1 shRNA-transfected MCF-7 and MDAMB-231 cells as determined from Western blot analysis. D, E-cadherin associated with MDM2 was detected by Western blot analysis from the anti-E-cadherin purified immune complex in control/SMAR1 overexpressed/SMAR1-silenced MCF-7 and MDAMB-231 cells. E-cadherin was immunoprecipitated from cell lysates with anti-E-cadherin antibody and immunoblotted with anti-MDM2 and anti-E-cadherin antibodies (two left upper panels); In a parallel experiment SMAR1 associated MDM2 was also detected from anti-SMAR1 purified immune complex by Western blotting in the above-mentioned sets. SMAR1 was immunoprecipitated from cell lysates with anti-SMAR1 antibody and immunoblotted with anti-MDM2 and anti-SMAR1 antibodies (two left middle panels). Comparable protein input was determined by direct Western blotting with anti-α-actin using 20% of the cell lysates that were used for immunoprecipitation (two left lower panels). In a parallel set of experiment, localization and interaction of SMAR1 and MDM2 was determined in the nuclear and cytosolic extracts of control and SMAR1-overexpressed MCF-7 and MDAMB-231 cells. Extracts were incubated with anti-SMAR1 antibody and immunoprecipitates were immunoblotted with anti-MDM2 antibody (right panels). E, expression level of E-cadherin as assessed by immunoblotting in MDM2 siRNA transfected/MG132 treated/SMAR1 cDNA transfected/SMAR1 shRNA transfected MCF-7 and MDAMB-231 cells. F, in a parallel experiment the percentage of cell migration was also determined using transwell migration assay in the above-mentioned sets in MCF-7(left panel) and MDAMB-231 cells(right panel). **, p < 0.01, and ***, p < 0.001 compared with slug-siRNA/MDM2-siRNA G, ubiquitination pattern of immunoprecipitated E-cadherin was determined by immunoblotting in control/SMAR1 overexpressed/SMAR1 knocked-down MCF-7 (left panel) and MDAMB-231 (right panel) cells in the presence and absence of MDM2 siRNA/MG132, E-cadherin was immunoprecipitated from cell lysates with anti-E-cadherin antibody and immunoblotted with anti-Ub and anti-E-cadherin antibody to assay E-cadherin ubiquitination. α-actin was used as internal control. Values are mean ± S.E. of three independent experiments in each case.
FIGURE 4.
FIGURE 4.
SMAR1 regulates the transcription of E-cadherin by modulating the expression of its transcriptional repressor, Slug. A, (left panel) Western blot and (right panel) RT-PCR analysis depicting the changes in the expression pattern of Slug and E-cadherin in MCF-7 and MDAMB-231 cells on transfecting with increasing concentration of SMAR1 cDNA. B, changes in the expression pattern of Slug and E-cadherin as assessed from immunoblotting (left panel) and RT-PCR (right panel). In the control, SMAR1 knocked-down, SMAR1-overexpressed MCF-7, and MDAMB-231 cells in the presence and absence of Slug cDNA transfection. C, in a parallel set of experiment, the percentage of migration of both MCF-7 (left panel) and MDAMB-231 (right panel). Cells were assessed using transwell migration assay in the above-mentioned sets. D, Western blot analysis furnishing the changes in the expression levels of SMAR1, E-cadherin, and Slug (left panel), and transwell migration assay showing the relative migratory efficiency of MCF-7 cells (right panel) in p53 shRNA-transfected cells in presence and absence of SMAR1 cDNA. E, MCF-7 and MDAMB-231 cells were transfected with Slug siRNA/MDM2 siRNA and immunoblotted to determine the expression level of Slug and E-cadherin. F, percentage of cell migration was also determined in the above-mentioned sets using transwell migration assay. α-Actin and GAPDH were used as internal loading control. Values are mean ± S.E. of three independent experiments in each case.
FIGURE 5.
FIGURE 5.
SMAR1 in association with HDAC1 regulates Slug gene transcription by binding to the MAR region in Slug promoter locus. A, cell extracts from (left panel) MCF-7 and (right panel) MDAMB-231, overexpressing SMAR1/SMAR1 shRNA transfected cells were subjected to immunoprecipitation with anti-SMAR1, as indicated for detection of interactions with HDAC1 and SMAR1, respectively, cell extracts were immunoprecipitated using SMAR1 antibody and were analyzed by HDAC1 antibody and SMAR1 antibody for checking the endogenous interaction of SMAR1 and HDAC1. B, slug promoter activity was checked both in (left panel) MCF-7 and (right panel) MDAMB-231 cells by luciferase reporter assay. Transfections of either SMAR1cDNA or SMAR1shRNA were done along with Slug luciferase (Slug Luc) vector. Relative light units (RLU) obtained were plotted. Slug expression was shown in the case of each transfection correlated to the bar graph. **, p < 0.01, and ***, p < 0.001 compared with control-cDNA/-shRNA. C, schematic representation of the Slug promoter showing the SMAR1 binding sites and the sequence of the forward and reverse primer synthesized using the primer blast software of NCBI against the region −50 to −160 bp of the Slug promoter used for CHIP analysis. Chromatin from control, SMAR1 overexpressed and SMAR1 knocked-down MCF-7 and MDAMB-231 cells was immunoprecipitated with SMAR1 and HDAC1 antibodies. PCR amplification was performed on MAR regions of Slug. Parallel immunoprecipitation with control IgG antibody has been shown in the middle panel. The first panel denotes input control.
FIGURE 6.
FIGURE 6.
SMAR1 also inhibits EGF-mediated Slug up-regulation to restore E-cadherin expression and regulate cell migration. A, changes in the E-cadherin, Slug and SMAR1 expression level were assessed by immunoblotting (left panel) MCF-7 and (right panel) MDAMB-231 cell lysates from control and SMAR1 cDNA transfected sets in the presence and absence of EGF treatment. B, changes in the phosphotyrosine/-serine pattern of EGFR1/TGFβR1 in EGF-/TGFβ-treated MCF-7 and MDAMB-231 cells within 1 h (left panels). SMAR1, E-cadherin, and vimentin expression status of EGF-/TGFβ-treated MCF-7 and MDAMB-231 cells at 24 h (right panels). C, fluorescence images depicting the changes in the E-cadherin expression levels in control and SMAR1-overexpressed (left panel) MCF-7 and MDAMB-231 cells with or without EGF treatment; Graphical representation of the fold changes in surface E-cadherin expression in control and SMAR1 overexpressed (right panel) MCF-7 and MDAMB-231 cells with or without EGF treatment. ***, p < 0.001 compared with control. D, in a parallel experiment the changes in the rate of cell migration was also determined in control and SMAR1 overexpressed (left panel) MCF-7 and (right panel) MDAMB-231 cells with or without EGF treatment using transwell migration assay. α-Actin was used as internal loading control. Values are mean ± S.E. of three independent experiments in each case. E, MCF-7-Luciferase cells were transduced with either non-silencing lentivirus (Lenti-NS-shRNA) or SMAR1-shRNA lentivirus (Lenti-SMAR1-shRNA) and injected in to the tail vein of SCID mice. At time 0 and at day 21after injection, luciferase substrate d-luciferin was injected intraperitoneally and the metastatic propensity of the cells was determined by imaging the mice using IVS spectrum. BM indicates bone metastasis. F, graphical representation of the average photon flux (×106 p/cm2/s/sr) at time 0 and day 21 of Lenti-NS-shRNA- & Lenti-SMAR1-shRNA-transfected MCF-7-Luc cells as injected in to the tail vein of SCID mice. ***, p < 0.001 compared with control.
FIGURE 7.
FIGURE 7.
Schematic illustration depicting the molecular mechanisms of SMAR1-mediated up-regulation of E cadherin to inhibit EMT.

References

    1. Adhikary A., Mohanty S., Lahiry L., Hossain D. M. S., Chakraborty S., Das T. (2010) Theaflavins retard human breast cancer cell migration by inhibiting NF-κB via p53-ROS cross-talk. Febs. Lett. 584, 7–14 - PubMed
    1. Steeg P. S. (2006) Tumor metastasis: mechanistic insights and clinical challenges. Nature Med. 12, 895–904 - PubMed
    1. Savagner P. (2001) Leaving the neighbourhood: molecular mechanisms involved during epithelial-mesenchymal transition. BioEssays 23, 912–923 - PubMed
    1. Huber M. A., Kraut N., Beug H. (2005) Molecular requirements for epithelial–mesenchymal transition during tumor progression. Curr. Op. Cell Biol. 17, 548–558 - PubMed
    1. Thiery J. P. (2002) Epithelial-mesenchymal transition in tumor progression. Nat. Rev. Cancer 2, 442–454 - PubMed

Publication types

MeSH terms