

doi: 10.1038/nmeth.3062.
Epub 2014 Aug 3.
Nanoscale high-content analysis using compositional heterogeneities of single proteoliposomes
Affiliations
- PMID: 25086504
- PMCID: PMC4485457
- DOI: 10.1038/nmeth.3062
Item in Clipboard
Nanoscale high-content analysis using compositional heterogeneities of single proteoliposomes
Nat Methods.
2014 Sep.
Abstract
Proteoliposome reconstitution is a standard method to stabilize purified transmembrane proteins in membranes for structural and functional assays. Here we quantified intrareconstitution heterogeneities in single proteoliposomes using fluorescence microscopy. Our results suggest that compositional heterogeneities can severely skew ensemble-average proteoliposome measurements but also enable ultraminiaturized high-content screens. We took advantage of this screening capability to map the oligomerization energy of the β2-adrenergic receptor using ∼10(9)-fold less protein than conventional assays.
Figures
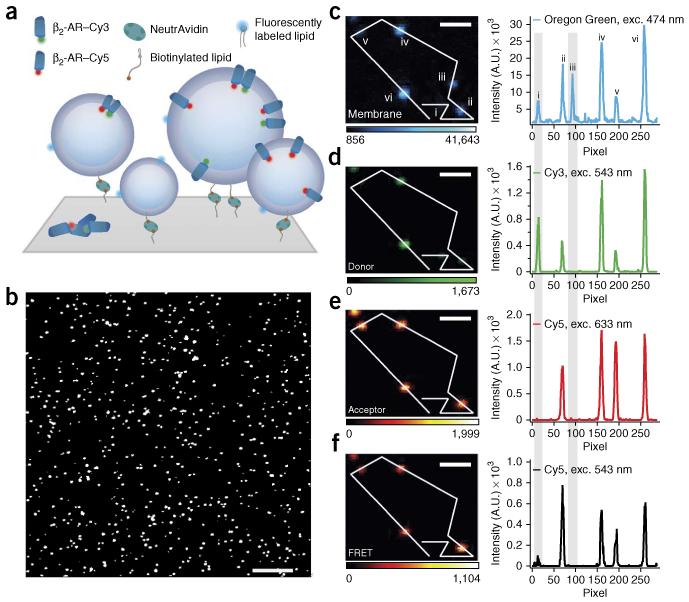
Surface immobilization and fluorescence microscopy imaging allow for single-proteoliposome characterization. (a) Proteoliposomes tethered through a biotin-NeutrAvidin linker to a polymer-passivated (PLL-g-PEG/PLL-g-PEG-biotin) glass surface. Proteoliposomes are labeled with a lipid-coupled dye (Oregon Green DHPE) and harbor GPCRs labeled with either Cy3 or Cy5 for quantification of receptor oligomerization by FRET. (b–f) Micrographs of typical β2-AR proteoliposome samples with nominal 1:1,000 protein-to-lipid ratio. (b) Magnified version of a typical confocal image. The assay allows high-throughput sampling of ~1,000 proteoliposomes per frame. (c–f) Micrographs and line scans showing high signal to noise for Oregon Green, Cy3, Cy5 and FRET. Gray shading highlights, respectively, an example of a proteoliposomes that carry only donor-labeled receptors (liposome i) and an example of an empty liposome (liposome iii). Exc., excitation wavelength. Color scales represent intensity in arbitrary units. Scale bars, 10 μm (b) and 1.2 μm (c–f).
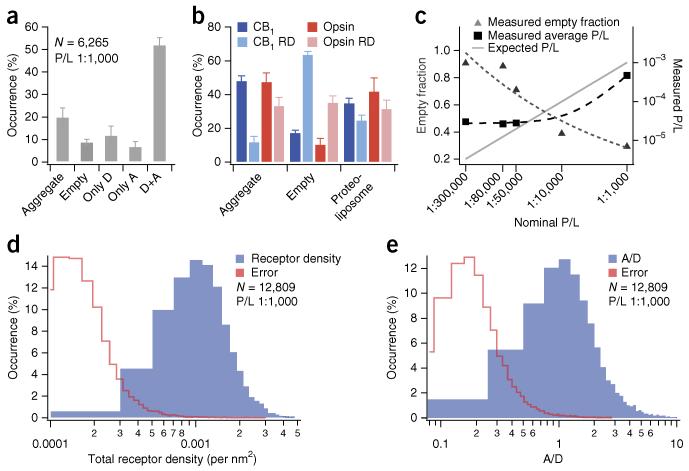
Direct imaging of single nanoscale proteoliposomes allows for high-content analysis of intrasample compositional heterogeneities. (a) Protein aggregates, empty liposomes and proteoliposomes harboring only donor (D), only acceptor (A) and both donor and acceptor (D+A) subpopulations within a β2-AR reconstitution sample with nominal 1:1,000 protein-to-lipid ratio (P/L). Only proteoliposomes having both β2-AR–Cy3 and β2-AR–Cy5 (52% ± 3%) are selected for FRET analysis. Data in the panel include N = 6,265 particles. Error bars indicate s.d. of technical replicates from 3 independent experiments. (b) Protein aggregates, empty liposomes and proteoliposome subpopulations within reconstitution samples of CB1 and opsin receptors (both nominal P/L = 1:1,000) reconstituted by removal of detergent by either Bio-Beads (darker shades) or rapid dilution (RD; lighter shades). Data in the panel include N = 11,076 particles (CB1), N = 11,585 (CB1 RD), N = 10,701 (Opsin), N = 15,943 (Opsin RD). Error bars for darker bars: s.d. of technical replicates for ≥8 microscope chamber positions. Error bars for lighter bars: s.d. of technical replicates from 3 independent microscopy experiments. (c) Effect of titrating the nominal P/L (data were collected for both β2-AR R333C and 265C; Online Methods). Data were fit to power functions to guide the eye (dashed lines). (d) Histogram of observed receptor densities for individual proteoliposomes (β2-AR, nominal P/L = 1:1,000). (e) Histogram displaying A/D ratios on individual proteoliposomes (β2-AR, nominal P/L = 1:1,000). All histograms include 12,809 proteoliposomes from 7 independent experiments. In d and e the red traces indicate histograms of absolute errors from single proteoliposomes.
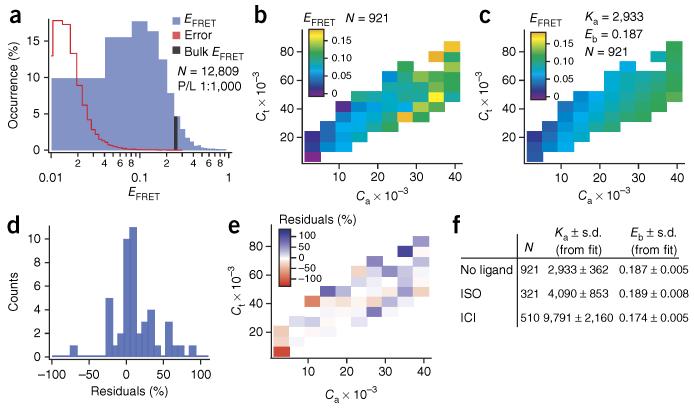
Quantification of β2-AR association energy using heterogeneities in a single reconstitution sample and ~6 pg of receptor. (a) Histogram of single proteoliposome FRET efficiencies (EFRET) (blue) and corresponding histogram of EFRET errors (red; histogram is shown in linear scale in Supplementary Fig. 5). The black bar marks the calculated ensemble-average EFRET. Nominal protein-to-lipid ratio (P/L) = 1:1,000. (b) EFRET (color scale) as a function of the total reduced receptor density (Ct) and reduced acceptor density (Ca) for a population of 921 proteoliposomes with a narrow size distribution of 120–130 nm (nominal P/L = 1:1,000). The unitless reduced densities correspond to receptor surface density multiplied by the square of the Förster radius (R02) (Supplementary Note). For better visualization, EFRET values of single proteoliposomes in b,c are binned, and a weighted average of each bin is displayed. (c) Weighted fit of the data going into b (without binning) with the theoretical model (equations (11), (14) and (16) in the Supplementary Note). From the fit we extract two fitting parameters: the dimer association constant Ka and the FRET efficiency within a dimer Ebound (Eb). Bins are constructed to match those in panel b. (d,e) Residuals representing the difference between the fit in c and experimental data in b, here displayed as the percentage deviation, suggest no systematic deviations from the theory. (f) Table displaying Ka and Eb obtained by fitting the theoretical scheme (equations (11), (14) and (16)) to proteoliposomes incubated with no ligand, a saturating amount of agonist (isoproterenol (ISO), 10 μM) or an inverse agonist (ICI 118,551, 500 nM).
Similar articles
-
Single Proteoliposome High-Content Analysis Reveals Differences in the Homo-Oligomerization of GPCRs.Biophys J. 2018 Jul 17;115(2):300-312. doi: 10.1016/j.bpj.2018.05.036. Biophys J. 2018. PMID: 30021106 Free PMC article.
-
Single Vesicle Fluorescence-Bleaching Assay for Multi-Parameter Analysis of Proteoliposomes by Total Internal Reflection Fluorescence Microscopy.ACS Appl Mater Interfaces. 2022 Jul 6;14(26):29659-29667. doi: 10.1021/acsami.2c07454. Epub 2022 Jun 24. ACS Appl Mater Interfaces. 2022. PMID: 35748880 Free PMC article.
-
Spatial fluorescence cross-correlation spectroscopy.Appl Opt. 2006 Feb 20;45(6):1225-35. doi: 10.1364/ao.45.001225. Appl Opt. 2006. PMID: 16523786
-
Revealing G-protein-coupled receptor oligomerization at the single-molecule level through a nanoscopic lens: methods, dynamics and biological function.FEBS J. 2016 Apr;283(7):1197-217. doi: 10.1111/febs.13577. Epub 2015 Nov 28. FEBS J. 2016. PMID: 26509747 Review.
-
Single-molecule counting applied to the study of GPCR oligomerization.Biophys J. 2022 Sep 6;121(17):3175-3187. doi: 10.1016/j.bpj.2022.07.034. Epub 2022 Aug 3. Biophys J. 2022. PMID: 35927960 Free PMC article. Review.
Cited by
-
Micelle-Enhanced Bioorthogonal Labeling of Genetically Encoded Azido Groups on the Lipid-Embedded Surface of a GPCR.Chembiochem. 2015 Jun 15;16(9):1314-22. doi: 10.1002/cbic.201500030. Epub 2015 May 11. Chembiochem. 2015. PMID: 25962668 Free PMC article.
-
Direct visualization of single-molecule membrane protein interactions in living cells.PLoS Biol. 2018 Dec 13;16(12):e2006660. doi: 10.1371/journal.pbio.2006660. eCollection 2018 Dec. PLoS Biol. 2018. PMID: 30543635 Free PMC article.
-
In-Membrane Chemical Modification (IMCM) for Site-Specific Chromophore Labeling of GPCRs.Angew Chem Int Ed Engl. 2015 Dec 7;54(50):15246-9. doi: 10.1002/anie.201508506. Epub 2015 Nov 6. Angew Chem Int Ed Engl. 2015. PMID: 26545333 Free PMC article.
-
Permanent Photodynamic Cholecystokinin 1 Receptor Activation: Dimer-to-Monomer Conversion.Cell Mol Neurobiol. 2018 Aug;38(6):1283-1292. doi: 10.1007/s10571-018-0596-3. Epub 2018 Jun 4. Cell Mol Neurobiol. 2018. PMID: 29869099 Free PMC article.
-
The dimerization equilibrium of a ClC Cl(-)/H(+) antiporter in lipid bilayers.Elife. 2016 Aug 3;5:e17438. doi: 10.7554/eLife.17438. Elife. 2016. PMID: 27484630 Free PMC article.
References
-
- Rigaud JL, Lévy D. In: Methods in Enzymology: Liposomes, Part B. Duzgunes N, editor. Vol. 372. Elsevier; 2003. pp. 65–86. - PubMed
-
- Seddon AM, Curnow P, Booth PJ. Biochim. Biophys. Acta. 2004;1666:105–117. - PubMed
-
- Serebryany E, Zhu GA, Yan ECY. Biochim. Biophys. Acta. 2012;1818:225–233. - PubMed
-
- Niu SL, Doctrow B, Mitchell DC. Biochemistry. 2009;48:156–163. - PubMed
Publication types
MeSH terms
Substances
Grants and funding
LinkOut - more resources
Full Text Sources
Other Literature Sources
