. 2014 Oct;32(10):1053-8.
doi: 10.1038/nbt.2967. Epub 2014 Aug 3.

Low-coverage single-cell mRNA sequencing reveals cellular heterogeneity and activated signaling pathways in developing cerebral cortex

Affiliations

Low-coverage single-cell mRNA sequencing reveals cellular heterogeneity and activated signaling pathways in developing cerebral cortex

Alex A Pollen et al. Nat Biotechnol. 2014 Oct.

Abstract

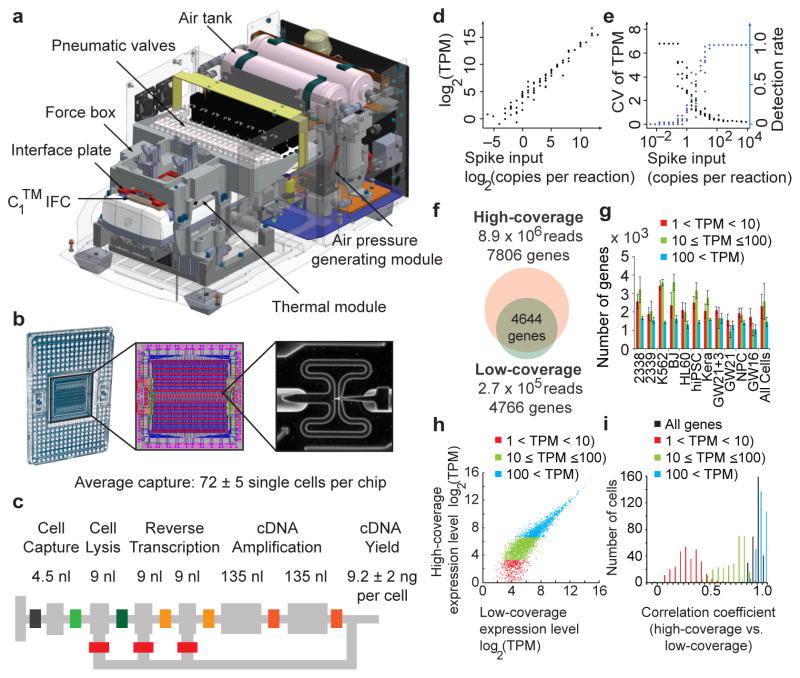
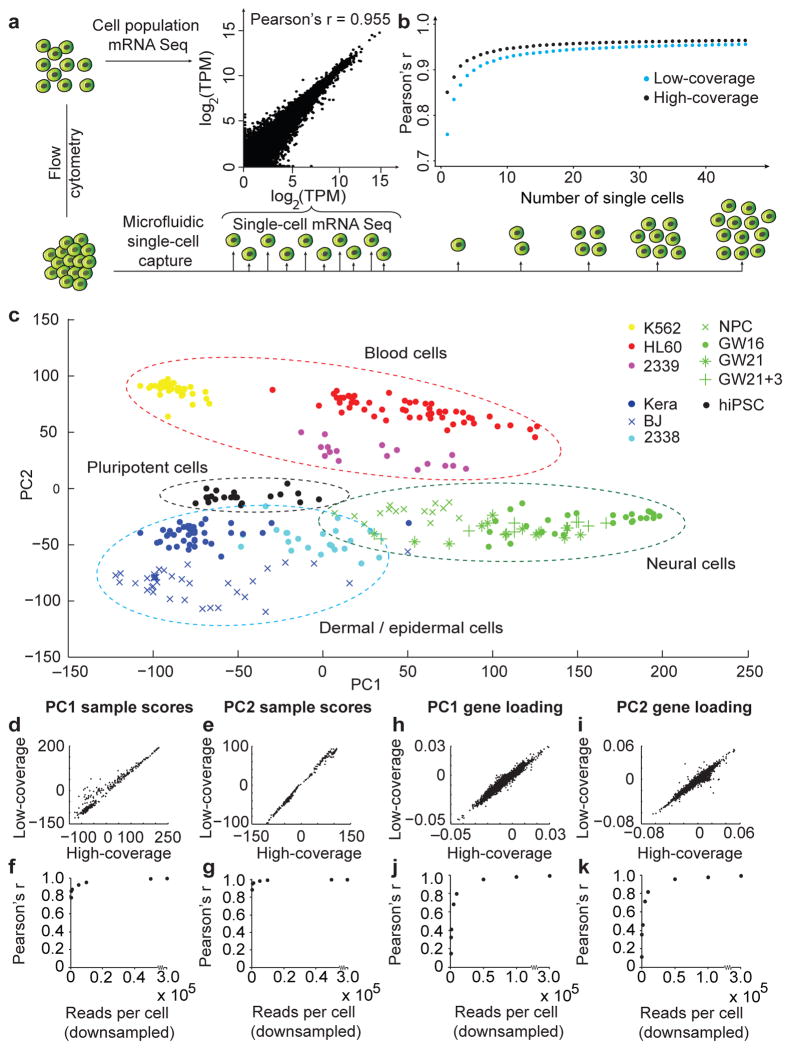
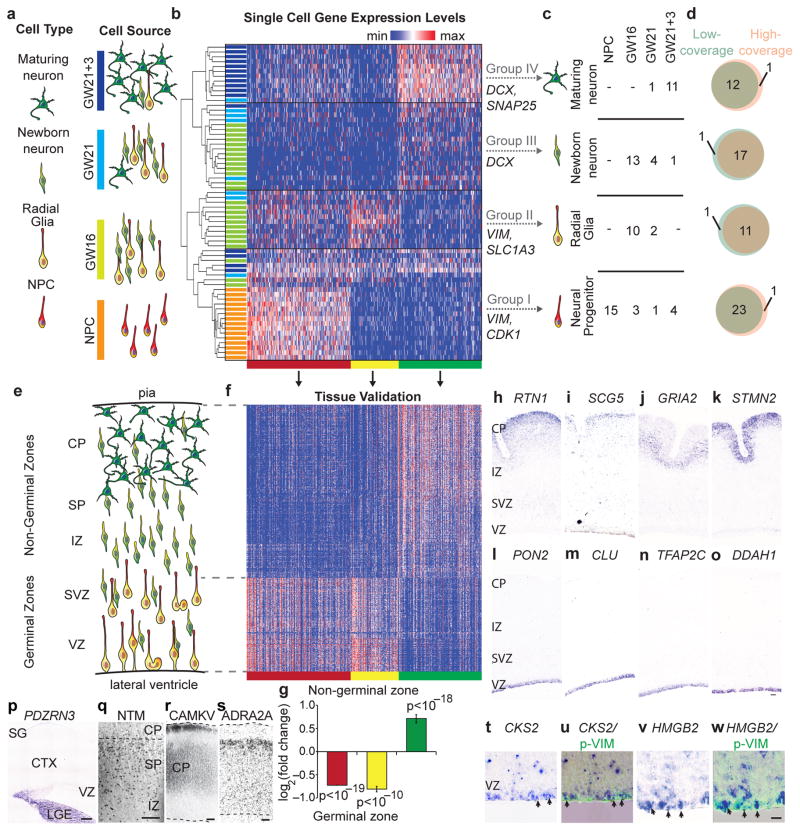
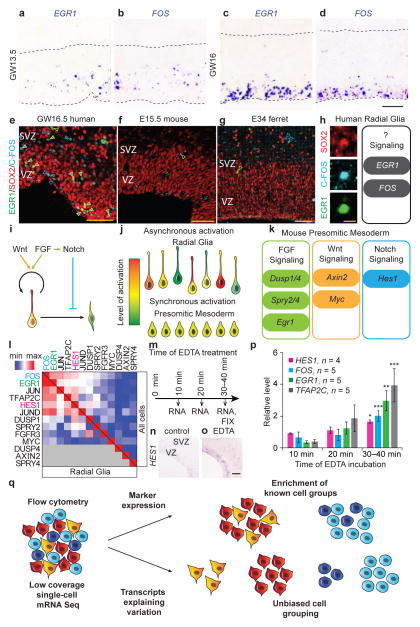
Large-scale surveys of single-cell gene expression have the potential to reveal rare cell populations and lineage relationships but require efficient methods for cell capture and mRNA sequencing. Although cellular barcoding strategies allow parallel sequencing of single cells at ultra-low depths, the limitations of shallow sequencing have not been investigated directly. By capturing 301 single cells from 11 populations using microfluidics and analyzing single-cell transcriptomes across downsampled sequencing depths, we demonstrate that shallow single-cell mRNA sequencing (~50,000 reads per cell) is sufficient for unbiased cell-type classification and biomarker identification. In the developing cortex, we identify diverse cell types, including multiple progenitor and neuronal subtypes, and we identify EGR1 and FOS as previously unreported candidate targets of Notch signaling in human but not mouse radial glia. Our strategy establishes an efficient method for unbiased analysis and comparison of cell populations from heterogeneous tissue by microfluidic single-cell capture and low-coverage sequencing of many cells.


Conflict of interest statement

Competing Financial Interests

A.A.L., A.P.M., B.A., B.C., B.F., B.N.J., D.K., D.T., G.S., J.A.A.W., J.S., J.W., L.K., L.S., M.A.U., M.N., M.T., M.W., N.L., N.R., P.C., R.C.J., R.L., S.W., S.W., and X.W. have a financial interest in Fluidigm Corporation as employees and/or stockholders.

Figures

Figure 1
Figure 1
Capturing single cells and quantifying mRNA levels using the C1 Single-Cell Auto Prep System. (a) Key functional components of the C1 System are labeled, including the pneumatic components necessary for control of the microfluidic integrated fluidic circuit (IFC) and the thermal components necessary for preparatory chemistry. (b) Left panel- the complete IFC with carrier; reagents and cells are loaded into dedicated carrier wells and reaction products are exported to other dedicated carrier wells. Middle panel- diagram of the IFC: Connections between polydimethylsiloxane microfluidic chip and carrier (pink circles), control lines (red), fluidic lines for preparatory chemistry (blue), and lines connecting control lines (green). Right panel- a single cell captured in a 4.5 nL capture site; there are 96 captures sites per IFC. The average single cell capture rate was 72 ± 5 cells (mean ± s.e.m.) per chip (Supplementary Tables 1, 2). (c) Schematic for a C1 reaction line is shown with reaction line colored light grey and isolation valves in varied colors. All reagents are delivered through a common central bus line (segment of bus line shown on far left). Each reaction begins in the 4.5 nL capture site. Delivery of the lysis reagent expands the reaction to also include the first 9 nL chamber. The reaction is expanded again upon delivery of the reverse transcription (RT) reagent to include the second and third 9 nL chambers. Finally, the two 135 nL reaction chambers are included to provide the larger volume required for the PCR reagents. After the addition of RT reagent, the contents of the reaction line are pumped in a loop using a bypass line (bottom) for mixing and the IFC is then incubated at 42°C for RT. Mixing is repeated after the addition of PCR reagents and thermal cycling is performed. Following preparatory chemistry, each single-cell reaction product exits the chip using a dedicated fluidic path to the carrier (path shown to the right). (d) Sequencing of reaction products from 46 K562 cells at low-coverage (1.7 × 10⁵ reads per cell) reveals that expression level estimates correlate strongly with known copy numbers of input spikes (Pearson’s r = 0.968) from External RNA Controls Consortium (ERCC) RNA Spike-In Control Mix 1 (2.8 × 10⁴ copies/reaction). (e) The fraction of positive reactions where ERCC transcripts are detected above 1 TPM in single cells and the coefficient of variation for ERCC levels are both plotted versus the spike input amounts. (f–i) Pools of barcoded libraries from 301 cells were sequenced at high coverage by HiSeq® and at low coverage by MiSeq®. (f) In a representative cell, 4644 genes were detected above 1 TPM in both datasets. (g) Graph showing the average number of genes expressed at various levels detected by high coverage sequencing in each cell type (Methods). (h) In a representative cell, expression levels of genes detected in high- and low-coverage datasets were highly correlated (r = 0.91). (i) Histogram of correlation coefficients for all single cells (n = 301). The mean correlation coefficients increased with expression level: 0.25 (1<TPM<10, red), 0.66 (10≤TPM≤100, green), 0.93 (TPM>100, blue) and 0.91 (all genes with TPM>1).
Figure 2
Figure 2
Low-coverage single-cell mRNA sequencing is sufficient to detect genes contributing to cell identity. (a) The average expression levels from single-cell mRNA sequencing of 46 K562 cells correlate strongly with expression levels from a population of 100 K562 cells isolated by flow cytometry. (b) The correlation between individual K562 cells and the population improves with diminishing returns as additional single cell results are combined. (c) Distinct groups of cells corresponding to pluripotent, blood, skin, and neural cells can be identified by PCA of 301 cells sequenced at low coverage. (d–g) Sample scores from low- and high-coverage data were calculated using the eigenvectors from high-coverage data and correlate strongly across all 301 cells for PC1 (d, r = 0.973) and PC2 (e, r = 0.997). The strong sample score correlations (r > 0.92) persist with as few as 5000 reads per cell for PC1 (f) and PC2 (g). (h–k) Similarly, eigenvectors derived from low- and high-coverage datasets correlate strongly for the eigenvectors defining PC1 (h, r = 0.980) and PC2 (i, r = 0.956), but strong correlations of eigenvectors (r>0.95) for PC1 (j) and PC2 (k) require at least 50,000 reads per cell.
Figure 3
Figure 3
Low-coverage single-cell mRNA sequencing distinguishes diverse neural cell types and identifies biomarkers in heterogeneous tissue. (a) Schematic of cell types and sources selected to represent stages of neuronal differentiation. Cultured neural progenitors represent early undifferentiated stages, while primary cortical samples are expected to contain radial glia, newborn, and maturing neurons. (b) Hierarchical clustering of 65 single cells across 500 genes with the strongest PC1-3 loading scores identifies four major groups of cells (I–IV) and k-means clustering identifies three clusters of genes (red, yellow, green). (c) Major groups can be interpreted based on the expression of known genes. Table shows the number of cells of specific types captured from each source. (d) Cell classification based on low-coverage data largely overlaps with classification based on high-coverage data. (e) Schematic of the distribution of cell types in developing cortex at mid-gestation. (f) Heatmap of gene expression values for PCA genes (columns) in 599 regions of the developing cortex (rows). (g) Genes belonging to the red cluster (n = 218) and yellow cluster (n = 98) are enriched in the ventricular (VZ) and subventricular zones (SVZ), while genes belonging to the green cluster (n = 176) are enriched in the intermediate zone (IZ), subplate (SP), and cortical plate (CP); p values were calculated using Wilcoxon signed-rank test. (h–o) In situ hybridization for representative genes belonging to the neuronal (green) cluster including RTN1 (h), SCG5 (i), GRIA2 (j), STMN2 (k), and genes belonging to the radial glia (yellow) cluster including PON2 (l), CLU (m), TFAP2C (n), DDAH1 (o), in GW 14.5 human cortical sections. (p–s) Distinct expression patterns were observed for candidate novel markers of subgroups. (p) In situ hybridization for the candidate immature inhibitory neuron marker PDZRN3 in GW16.5 human cortex (CTX). (q) Immunostaining for the candidate newborn neuron marker NTM in IZ, SP, and CP. (r–s) Immunostaining for markers distinguishing maturing neuronal subgroups CAMKV (r) and ADRA2A (s) in the CP of GW24.5 human cortex. Abbreviations SG - subpial granular layer, LGE – lateral ganglionic eminence. (t–w) In situ hybridization for candidate cell division markers in the progenitor gene cluster (red) showing CKS2 (t) and HMGB2 (v) expression in radial glia undergoing mitosis at the edge of the ventricular surface revealed by immunoreactivity for the phosphorylated (ser82) Vimentin (u, w).
Figure 4
Figure 4
EGR1 and FOS are candidate targets of Notch signaling in human radial glia identified using low-coverage single-cell mRNA Seq. (a–b) In situ hybridization images of human VZ at GW13.5 showing cells sparsely labeled for EGR1 (a) and FOS (b). (c–d) At GW16, pronounced mosaic expression of EGR1 (c) and FOS (d) was detected in the apical portion of VZ. Dashed lines indicate apical and basal edges of the VZ. (e–g) EGR1 and FOS proteins are detected in a subset of SOX2-expressing cells in the human ventricular zone (e), but rarely co-label with SOX2-expressing cells in mouse (f) or ferret (g) at similar developmental stages. Filled arrows: triple labeled cells; yellow arrows: EGR1/SOX2-expressing cells; blue arrows: C-FOS/SOX2-expresing cells; scale bar 50 μm. (h) High magnification example of a SOX2 (red) expressing cell in human VZ that is immunoreactive for C-FOS (cyan) and EGR1 (green), scale bar is 10 μm. Schematic represents hypothesis that EGR1 and FOS expression in vivo in human radial glia could be elicited in response to activated signaling pathways. (i) Schematic showing the key developmental signaling pathways regulating radial glia development. (j) Asynchronous activation of signaling pathways makes identification of downstream target genes challenging in heterogeneous tissue. (k) Schematic showing key candidate effector genes of FGF, Wnt and Notch signaling in mouse presomitic mesoderm. (l) Heatmap shows correlation coefficients between mRNA levels for EGR1, FOS, other immediate early genes, and canonical effectors of FGF, Notch and Wnt signaling pathway across all 65 neural cells (above diagonal) and within radial glia (below diagonal). (m) Schematic showing experimental design for stimulating Notch signaling in organotypic slice cultures of human fetal cortex using EDTA. (n-o) In situ hybridization for HES1 in control (n) and experimental (o) slices. (p) Quantification of mRNA levels of HES1, FOS, EGR1 and TFAP2C (n = 4–5 independent samples, 2–3 slices per condition). All qRT-PCR results represent average ± s.e.m calculated using −ΔΔCt method, p values were calculated using paired two-tailed Student t-test, * p < 0.05, ** p < 0.01, *** p < 0.001. (q) Low-coverage mRNA Seq of single cells permits in silico sorting of cells based on cell type or state. Flow cytometry uses established staining characteristics to enrich for known cell types in heterogeneous samples. In contrast, low-coverage single-cell mRNA Seq identifies the major genes explaining variation across single cells allowing for unbiased discovery and further analysis of distinct cell populations and states.

Comment in

References

    1. Shalek AK, et al. Single-cell transcriptomics reveals bimodality in expression and splicing in immune cells. Nature. 2013;498:236–240. - PMC - PubMed
    1. Shapiro E, Biezuner T, Linnarsson S. Single-cell sequencing-based technologies will revolutionize whole-organism science. Nature reviews Genetics. 2013;14:618–630. - PubMed
    1. Kawaguchi A, et al. Single-cell gene profiling defines differential progenitor subclasses in mammalian neurogenesis. Development. 2008;135:3113–3124. - PubMed
    1. Treutlein B, et al. Reconstructing lineage hierarchies of the distal lung epithelium using single-cell RNA-seq. Nature. 2014 - PMC - PubMed
    1. Jaitin DA, et al. Massively parallel single-cell RNA-seq for marker-free decomposition of tissues into cell types. Science. 2014;343:776–779. - PMC - PubMed

Publication types

Associated data