. 2014 Sep;16(9):876-88.
doi: 10.1038/ncb3011. Epub 2014 Aug 3.

Analysis of tumour- and stroma-supplied proteolytic networks reveals a brain-metastasis-promoting role for cathepsin S

Affiliations

Analysis of tumour- and stroma-supplied proteolytic networks reveals a brain-metastasis-promoting role for cathepsin S

Lisa Sevenich et al. Nat Cell Biol. 2014 Sep.

Abstract

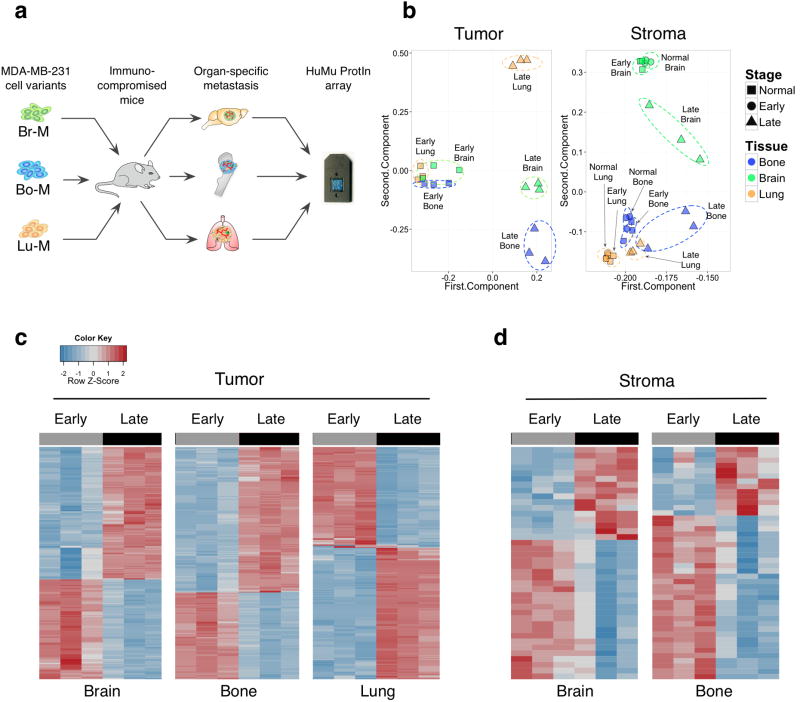
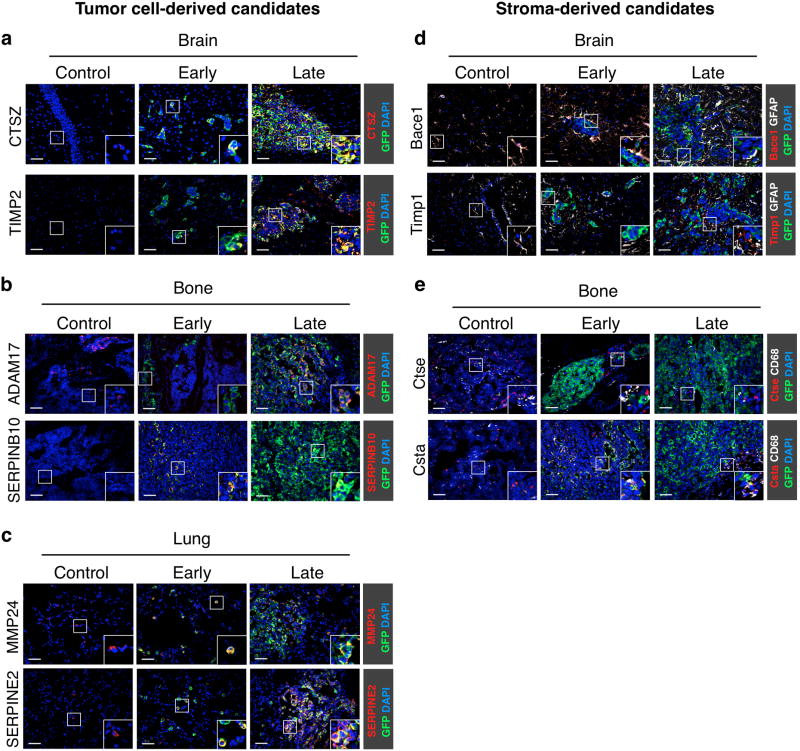
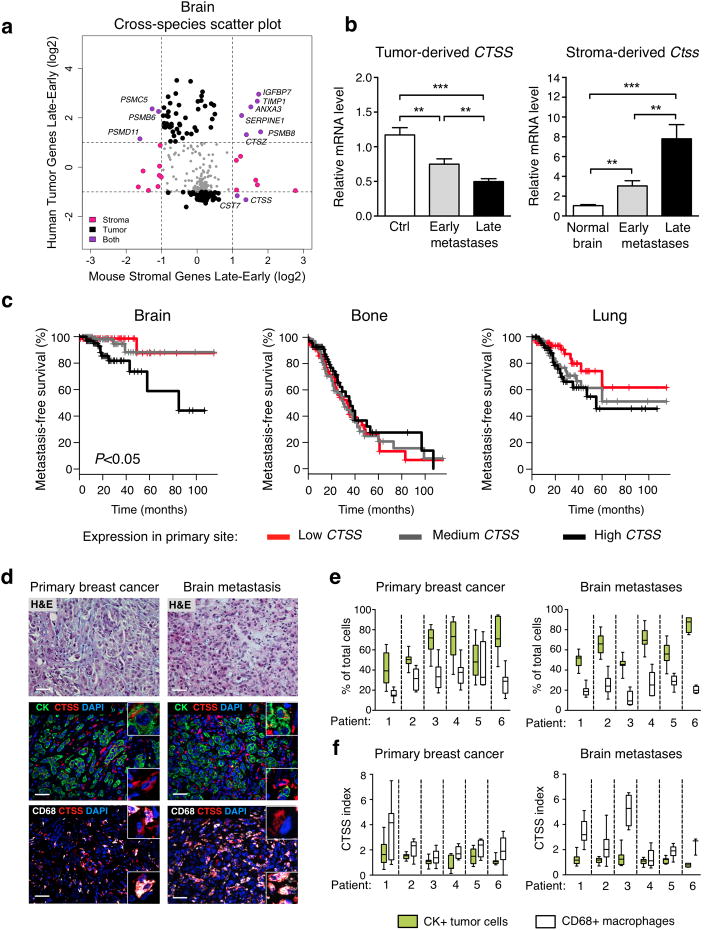
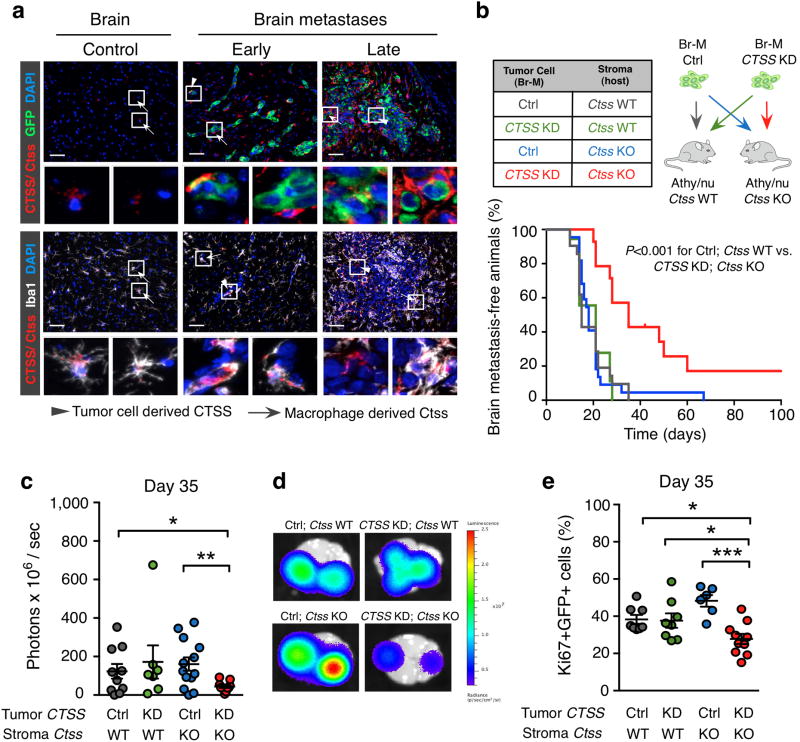
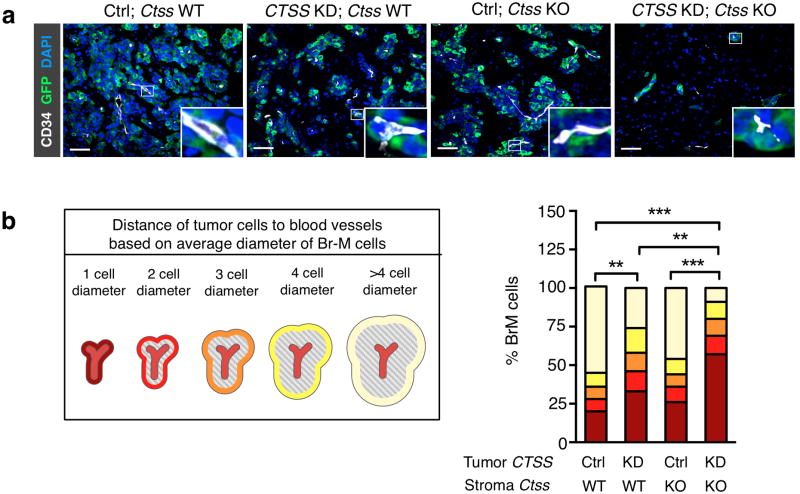
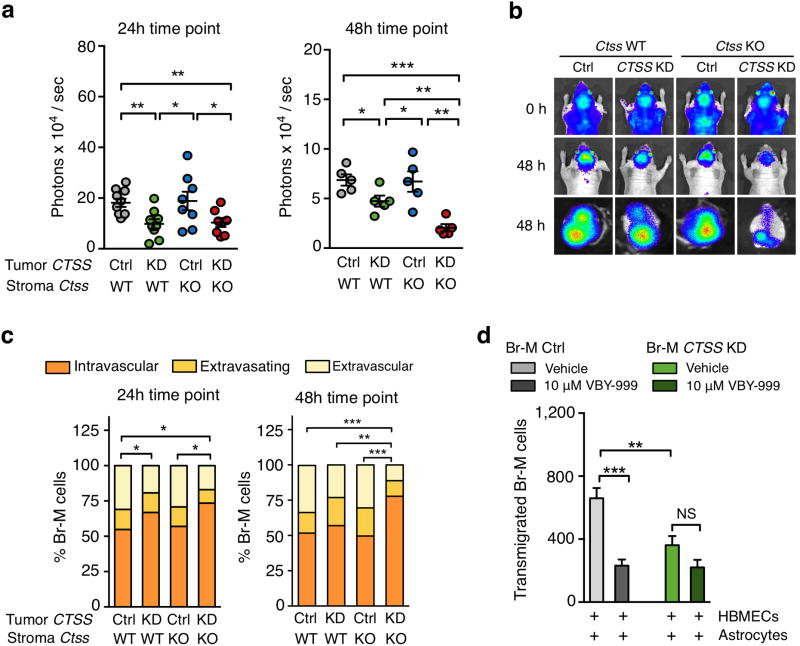
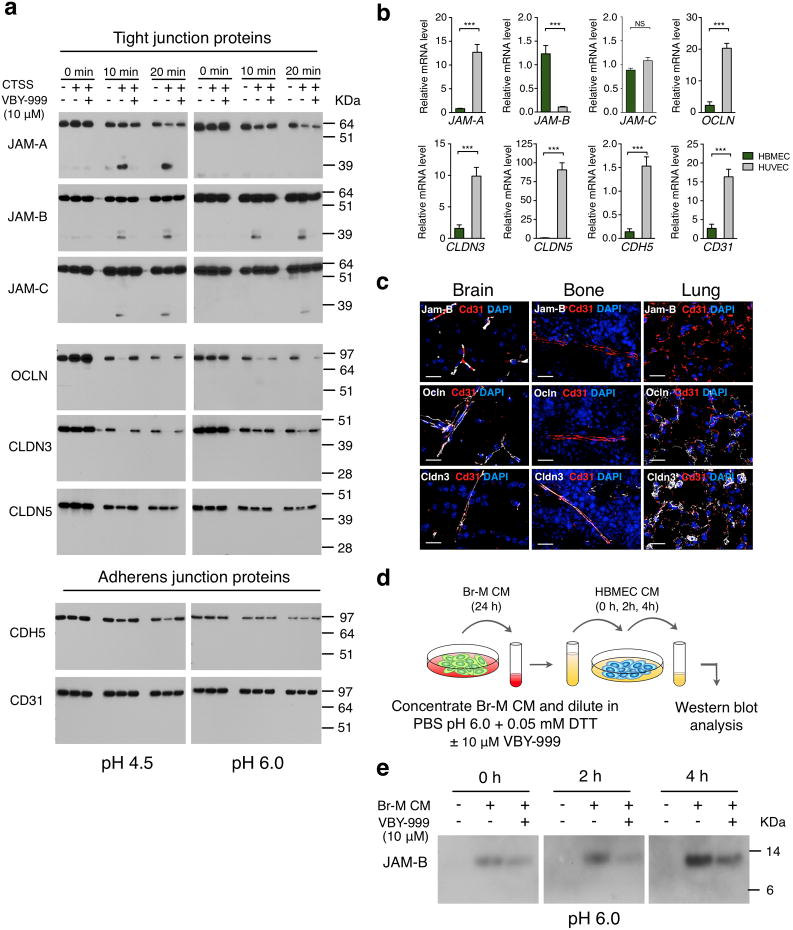
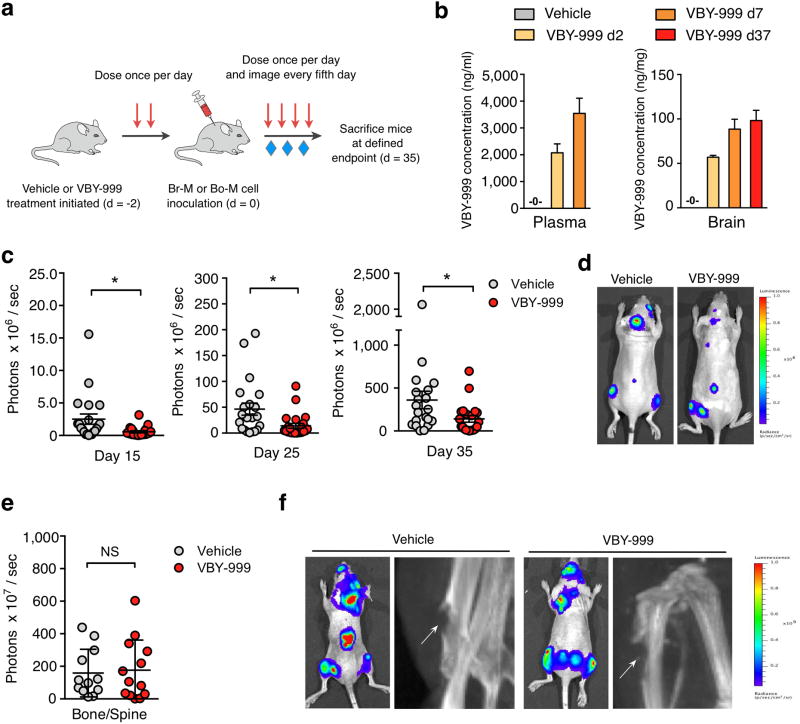
Metastasis remains the most common cause of death in most cancers, with limited therapies for combating disseminated disease. While the primary tumour microenvironment is an important regulator of cancer progression, it is less well understood how different tissue environments influence metastasis. We analysed tumour-stroma interactions that modulate organ tropism of brain, bone and lung metastasis in xenograft models. We identified a number of potential modulators of site-specific metastasis, including cathepsin S as a regulator of breast-to-brain metastasis. High cathepsin S expression at the primary site correlated with decreased brain metastasis-free survival in breast cancer patients. Both macrophages and tumour cells produce cathepsin S, and only the combined depletion significantly reduced brain metastasis in vivo. Cathepsin S specifically mediates blood-brain barrier transmigration through proteolytic processing of the junctional adhesion molecule, JAM-B. Pharmacological inhibition of cathepsin S significantly reduced experimental brain metastasis, supporting its consideration as a therapeutic target for this disease.


Figures

Figure 1
Figure 1. HuMu ProtIn array enables simultaneous acquisition of gene expression changes in tumor and stromal cells
(a) Schematic of the experimental design employed to analyze tumor stroma interactions in different metastatic microenvironments using the dual species-specific HuMu ProtIn (Human/ Murine Proteases and Inhibitors) array in xenografted animals. Br-M = brain metastatic, Bo-M = bone metastatic, and Lu-M = lung metastatic variants of the MDA-MB-231 cell line. (b) Principal component analysis of the HuMu array data: the 1st and 2nd component are plotted on the x and y axes respectively. These two components together represent the largest sources of variation in the dataset. The first and second components represent 89.98% and 8.44% respectively of the variance in the tumor gene space, and 90.83% and 4.06% in the stromal gene space. This analysis revealed variation in tumor gene expression that was predominantly associated with differences between early- and late-stage metastasis. Meanwhile, variation in the stroma was associated with both stage and tissue. Dotted ellipses were drawn manually to indicate related data points within stage or organ. (c,d) Heatmaps of (c) tumor- and (d) stroma-derived genes that were differentially expressed between early and late metastases across different organ sites. The lung stroma did not show extensive differences between early and late stages (Supplementary Table 1g).
Figure 2
Figure 2. Independent validation of differentially expressed genes in experimental brain, bone and lung metastases
(a-e) Representative images of control (non tumor-burdened) tissue, early- and late-stage site-specific metastases (classified by BLI intensity as in Supplementary Fig. 1; n=3 samples for each stage and tissue) showing immunofluorescence staining of tumor- and stromal-derived proteases and protease inhibitors exhibiting stage-dependent expression changes in the HuMu ProtIn array. (a) Brain sections were stained with antibodies against the protease CTSZ (red) and the protease inhibitor TIMP2 (red) as representative candidates that were differentially expressed in tumor cells. (b) Bone sections were stained with antibodies against the protease ADAM17 (red) and the protease inhibitor SERPINB10 (red) to represent differentially expressed candidates in tumor cells in bone metastases. (c) Lung sections were stained with antibodies against the protease MMP24 (red) and the protease inhibitor SERPINE2 (red) to confirm stage-differential expression in tumor cells in lung metastases. (d) Staining for the stromal-derived protease Bace1 (red) and the protease inhibitor Timp1 (red) confirmed stage-specific expression changes in GFAP+ astrocytes (white). (e) Staining for the protease Ctse (red) and the protease inhibitor Csta (red) confirmed stage-specific stromal changes in bone metastasis. CD68+ macrophages (red) were identified as the predominant source for Csta in bone metastases. All sections were stained with GFP (green) to visualize tumor cells and DAPI as a nuclear counter stain. Scale bar indicates 50 μm.
Figure 3
Figure 3. Cathepsin S shows highly regulated stage- and cell type-specific expression changes in experimental brain metastases, and cathepsin S expression in primary breast tumors is inversely correlated with brain metastasis-free survival in patients
(a) Cross-species scatter plot shows log-fold expression changes in the tumor and stromal gene space in early- vs. late-stage brain metastases. Differentially expressed genes in either the stroma (mouse) or tumor (human) gene space are shown in pink or black respectively. Genes that are differentially expressed in both the stromal and tumor gene space are shown in purple. Grey dots represent homologs with either insufficient fold change or P values. Horizontal and vertical lines denote fold change cut-off for significance. (b) Expression of tumor-derived and stromal-derived cathepsin S (CTSS or Ctss respectively) in Br-M control (Ctrl; n=11 mice) cell line, normal brain (n=12 mice), and brain metastases (classified by BLI intensity; n=16 mice for early-stage and n=17 mice for late-stage metastases). mRNA expression is depicted relative to Ctrl for CTSS and relative to normal brain for Ctss. All assays were performed in triplicate and gene expression was normalized to Ubc (stromal genes), B2M (tumor cell-derived genes). (c) Metastasis-free survival (MFS) for breast cancer patients (GSE12276 data set) based on low, medium and high CTSS expression at the primary site. (d) Representative images of matched primary breast cancer and brain metastasis patient samples stained for CTSS (red) and CD68 (macrophages; white), or pan-cytokeratin (CK, tumor cells; green), and DAPI (nuclei; blue). Images are representative of specimens quantified in (e). Scale bar indicates 50 μm. (e) Quantification of proportions of tumor cells and macrophages, presented as the percentage of total DAPI+ cells, in matched primary breast cancer (n=6 samples) and brain metastases (n=6 samples). (f) Quantification of the CTSS index as a measure of relative CTSS levels in tumor cells and macrophages. Data are presented as bars + s.e.m. or as box plots (Boxes; values between the 25th and 75th percentile, whiskers; minimum and maximum values, horizontal line; median). P values were obtained using two-tailed unpaired t-test for (b) and a log-rank test for (c). **P<0.01, and ***P<0.001.
Figure 4
Figure 4. Macrophages are the predominant source of stromal-derived cathepsin S and only combined depletion of tumor- and stromal-derived cathepsin S reduces experimental brain metastasis
(a) Representative images of normal brain, early- and late-stage brain metastasis (classified by BLI intensity) co-stained for Ctss/CTSS (red) and GFP (tumor cells; green) or Iba1 (macrophages/microglia; white). Tumor cell-derived CTSS is indicated by the arrowhead and macrophage-derived Ctss is indicated by the arrow. Images are representative of 5 independent specimens for each stage. (b) Kaplan-Meier curve shows the percentage of brain metastasis-free animals in the 4 experimental groups indicated in the table. Ctrl; Ctss WT (n=21 mice), CTSS KD; Ctss WT (n=16 mice), Ctrl; Ctss KO (n=22 mice), and CTSS KD; Ctss KO (n=12 mice). (c) Quantification of the ex vivo BLI intensity on day 35 after Br-M tumor cell inoculation. Ctrl; Ctss WT (n=10 mice), CTSS KD; Ctss WT (n=7 mice), Ctrl; Ctss KO (n=13 mice), and CTSS KD; Ctss KO (n=11 mice). (d) Representative ex vivo BLI images of the 4 experimental groups as shown in (c). (e) Quantification of tumor cell proliferation (percentage of Ki67+GFP+ cells) on day 35 after tumor cell inoculation. Ctrl; Ctss WT (n=8 mice), CTSS KD; Ctss WT (n=8 mice), Ctrl; Ctss KO (n=6 mice), and CTSS KD; Ctss KO (n=10 mice). Scale bar indicates 50 μm. Circles represent individual mice and horizontal lines represent the mean ± s.e.m. P values were obtained with Mantel-Cox log-rank test for MFS and with two-tailed unpaired t-test for numerical data. *P<0.05, **P<0.01 and ***P<0.001.
Figure 5
Figure 5. Cathepsin S deficiency in tumor cells and macrophages impairs metastatic seeding and outgrowth
(a) Representative images of brain metastases (day 35) stained for GFP (tumor cells; green), the endothelial cell marker CD34 (white), and DAPI to visualize nuclei (blue). Scale bar indicates 50 μm. Images are representative of independent specimens quantified in (b). (b) GFP+ tumor cells were categorized based on their localization relative to blood vessels, defined as the distance of tumor cells from blood vessels (1 to >4 average tumor cell diameter), and the percentage of tumor cells in each defined area was quantified using Metamorph image analysis software. Ctrl; Ctss WT (n=4 mice), CTSS KD; Ctss WT (n=6 mice), Ctrl; Ctss KO (n=6 mice), and CTSS KD; Ctss KO (n=6 mice). Categorical data are plotted as stacked bars. P values were obtained with an ordinal Chi-square test for categorical data. **P<0.01 and ***P<0.001.
Figure 6
Figure 6. Cathepsin S mediates blood-brain barrier transmigration of brain metastatic cells
(a) Quantification of BLI intensity at the indicated time points relative to BLI signal immediately after tumor cell inoculation. Ctrl; Ctss WT (n=10 mice), CTSS KD; Ctss WT (n=9 mice), Ctrl; Ctss KO (n=8 mice), and CTSS KD; Ctss KO (n=8 mice) for the 24h time point, and n=5 for each group for the 48h time point. (b) Representative BLI images in the 4 experimental groups immediately (0h) and 48h after tumor cell injection in vivo (top panels) and ex vivo (lower panel). Images are representative of the number of mice as in (a). (c) Tumor cells were categorized based on their localization relative to the vasculature defined as intravascular, extravasating and extravascular, and the percentage of viable tumor cells in each category was quantified at the indicated time points. Ctrl; Ctss WT (n=4 mice), CTSS KD; Ctss WT (n=3 mice), Ctrl; Ctss KO (n=3 mice), and CTSS KD; Ctss KO (n=4 mice) for the 24h time point, and n=4 mice for each group for the 48h time point. (d) Quantification of the number of transmigrated Br-M Ctrl and CTSS KD cells in the presence or absence of the cathepsin S-specific inhibitor VBY-999 through an in vitro BBB formed with human brain microvascular endothelial cells (HBMEC) in co-culture with astrocytes. 200 fields of view (FOV) were analyzed per sample. n=25, 15, 22, 15 samples were analyzed in three independent experiments. Circles represent individual mice and horizontal lines represent the mean ± s.e.m. for numerical data shown in (a). Graphs represent mean + s.e.m in (d). Categorical data are plotted as stacked bars. P values were obtained with two-tailed unpaired t-test for numerical data and with an ordinal Chi-square test for categorical data. NS = not significant, *P<0.05, **P<0.01, and ***P<0.001.
Figure 7
Figure 7. Cathepsin S cleaves tight junction proteins that regulate blood-brain barrier integrity
(a) Western blot analysis of CTSS-mediated cleavage of recombinant tight junction proteins (junctional adhesion molecules (JAM)-A, -B and -C, occludin (OCLN), claudins (CLDN)-3 and-5), and adherens junction proteins cadherin 5 (CDH5) and CD31 for the indicated time points at pH 4.5 and pH 6.0 in the presence or absence of the cathepsin S-specific inhibitor VBY-999. VBY-999 was used at 10 μM, a concentration that efficiently inhibits cathepsin S. (b) mRNA expression of the tight junction and adherens junction molecules in HUVECs and HBMECs (n=9 samples for each cell line). All assays were run in triplicate and gene expression was normalized to B2M. Expression is depicted relative to expression in HBMECs. (c) Representative images of control brain, bone, and lung sections stained for the tight junction proteins Jam-B, Ocln or Cldn 3 (white), with CD31 (red) to visualize blood vessels. DAPI was used as a nuclear counterstain. Images are representative of 3 independent specimens. (d) Schematic of the cell-based cleavage assay. (e) Western blot analysis showing increased JAM-B in HBMEC-conditioned media (CM) after incubation with Br-M cell CM for the indicated time points. Addition of the cathepsin S specific inhibitor VBY-999 (10 μM) resulted in reduced accumulation of JAM-B in HBMEC CM at the indicated time points. Incubation with PBS pH 6.0, 0.05 mM DTT served as a control for baseline JAM-B shedding of HBMEC. Scale bar indicates 20 μm. Graphs represent mean + s.e.m. P values were obtained using two-tailed unpaired t-test. NS = not significant, ***P<0.001. Each western blot shows the representative result of three independent experiments. Uncropped images of blots are shown in Supplementary Fig. 9.
Figure 8
Figure 8. Pharmacological inhibition of cathepsin S reduces brain metastasis formation in a preclinical trial
(a) Schematic of the prevention trial experimental design. (b) Quantification of VBY-999 concentrations in plasma and brain tissue at the indicated time points after treatment started (n=3 mice for each group). (c) Quantification of BLI intensity in the head region at the indicated time points after Br-M cell inoculation. n=20 mice for vehicle group (5% dextrose in water (D5W)) and n=21 mice for VBY-999 treatment group (100 mg/kg/day). The BLI signal in the VBY-999 versus control group is 77, 70 and 65% reduction at each of the three successive time points indicated. (d) Representative BLI images at the trial endpoint, d35 after Br-M cell inoculation. Images are representative of the number of mice as in (c). (e) Quantification of BLI intensity at d35 after Bo-M tumor cell inoculation in the bone and spine region. Vehicle (n=12 mice) and VBY-999 (n=13 mice). (f) Representative BLI and X-ray images at day 35 after Bo-M cell inoculation. Arrows indicate osteolytic lesions. Images are representative of the number of mice as in (e). Bars represent mean + s.e.m. for (b), circles represent individual mice and horizontal lines represent the mean ± s.e.m for (c, e). P values were obtained using two-tailed unpaired t-test. NS = not significant, *P<0.05.

References

    1. Quail DF, Joyce JA. Microenvironmental regulation of tumor progression and metastasis. Nat Med. 2013;19:1423–1437. - PMC - PubMed
    1. Nguyen DX, Bos PD, Massague J. Metastasis: from dissemination to organ-specific colonization. Nat Rev Cancer. 2009;9:274–284. - PubMed
    1. Goss PE, Chambers AF. Does tumour dormancy offer a therapeutic target? Nat Rev Cancer. 2010;10:871–877. - PubMed
    1. Affara NI, Andreu P, Coussens LM. Delineating protease functions during cancer development. Methods Mol Biol. 2009;539:1–32. - PubMed
    1. Mason SD, Joyce JA. Proteolytic networks in cancer. Trends Cell Biol. 2011;21:228–237. - PMC - PubMed

Publication types

MeSH terms

LinkOut - more resources