. 2014 Sep;20(9):1001-8.
doi: 10.1038/nm.3616. Epub 2014 Aug 3.

Obesity- and aging-induced excess of central transforming growth factor-β potentiates diabetic development via an RNA stress response

Affiliations

Obesity- and aging-induced excess of central transforming growth factor-β potentiates diabetic development via an RNA stress response

Jingqi Yan et al. Nat Med. 2014 Sep.

Abstract

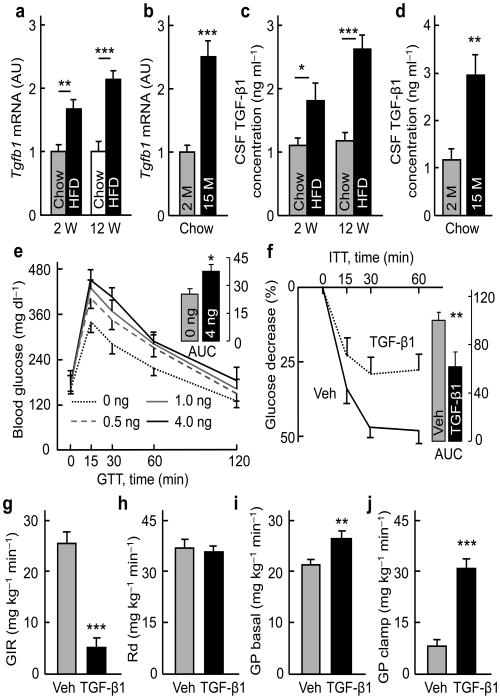
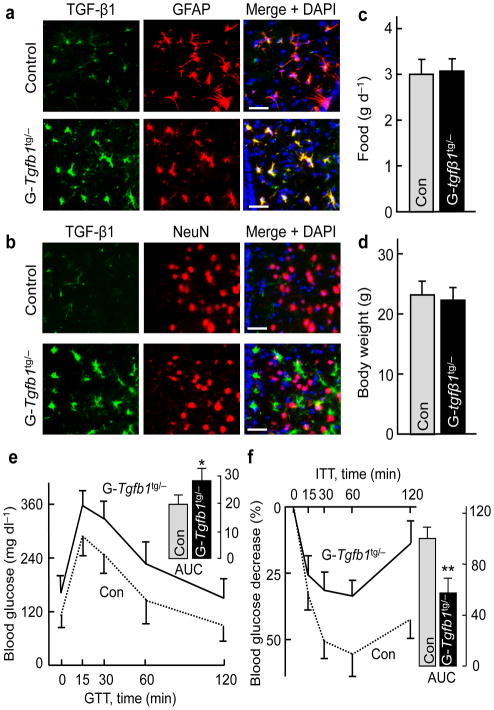
The brain, in particular the hypothalamus, plays a role in regulating glucose homeostasis; however, it remains unclear whether this organ is causally and etiologically involved in the development of diabetes. Here, we found that hypothalamic transforming growth factor-β (TGF-β) production is excessive under conditions of not only obesity but also aging, which are two general etiological factors of type 2 diabetes. Pharmacological and genetic approaches revealed that central TGF-β excess caused hyperglycemia and glucose intolerance independent of a change in body weight. Further, using cell-specific genetic analyses in vivo, we found that astrocytes and proopiomelanocortin neurons are responsible for the production and prodiabetic effect of central TGF-β, respectively. Mechanistically, TGF-β excess induced a hypothalamic RNA stress response, resulting in accelerated mRNA decay of IκBα, an inhibitor of proinflammatory nuclear factor-κB. These results reveal an atypical, mRNA metabolism-driven hypothalamic nuclear factor-κB activation, a mechanism that links obesity as well as aging to hypothalamic inflammation and ultimately to type 2 diabetes.


Figures

Figure 1
Figure 1. Brain TGF-β1 excess induces systemic glucose disorder
Male C57BL/6 mice fed on a HFD vs. chow for indicated weeks (W) (a, c), and chow-fed C57BL/6 mice at the ages of indicated months (M) (b, d) were analyzed for Tgfb1 mRNA in the hypothalamus (a, b) or TGF-β1 concentrations in the CSF (c, d). C57BL/6 mice were injected with vehicle (Veh) vs. TGF-β1 at the indicated doses (e) or 4 ng (f – j) and examined with GTT (e), ITT (f) or insulin clamp (g – j). Inserted bars (e, f) show the area under curve (AUC) of GTT (unit: mg dl−1 ×120 min, ×103) and ITT (% of control). Glucose infusion rate (GIR) (g), rate of glucose disposal (Rd) (h), and hepatic glucose production (GP) (i – j) in the clamp experiment were determined. * P < 0.05, ** P < 0.01, *** P < 0.001; n = 4 (a – d), 7 – 9 (e, f), and 5 (g – j) mice per group. Error bars reflect mean ± SEM.
Figure 2
Figure 2. Astrocyte-specific TGF-β1 transgenic expression leads to glucose disorder
Co-immunostaining of TGF-β1 with GFAP (a) or NeuN (b) of hypothalamic sections generated from male GFAP-Tgfb1tg/− mice (G-Tgfb1tg/−) and littermate controls (Con). Images show a sub-area in the MBH, and nuclear staining by DAPI revealed cells in sections. Scale bar = 50 μm. Food intake (c), body weight (d), GTT (e) and ITT (f) were determined in chow-fed G-Tgfb1tg/− and littermate Con. Inserted bar graphs show the area under curve (AUC) values of GTT (unit: mg dl−1 ×120 min, × 103) and ITT (% of Con). * P < 0.05, ** P < 0.01; n = 7 – 8 mice per group. Error bars reflect mean ± SEM.
Figure 3
Figure 3. Cell-specific TGF-β1 inhibition reduces diet-induced glucose disorder
Adult male GFAP-Tgfb1lox/lox mice (G-Tgfb1l/l; a, b), POMC-Tgfbr2lox/lox mice (P-Tgfbr2l/l; c, d) and matched littermate controls (Con) were fed on a HFD for 3 weeks and examined for GTT (a, c), ITT (b, d). * P < 0.05, n = 6 – 8 mice per group. Error bars reflect mean ± SEM.
Figure 4
Figure 4. Effect of TGF-β1 excess on hypothalamic inflammation
(a) Male C57BL/6 mice were injected with TGF-β1 vs. vehicle (Veh), and hypothalami were collected for Western blots. Western blot data represent 4 mice per group. (b) Hypothalami of male Tgfb1+/− and littermate WT mice were collected and analyzed for mRNA levels of indicated genes. (c, d) Male Tlr4−/− mice and littermate WT were injected with TGF-β1 vs. vehicle, and subjected to GTT (e) or ITT (f). * P < 0.05, ** P < 0.01, ns, non-significant; n = 4 (b) and 8 – 10 (cf) mice per group. Error bars reflect mean ± SEM.
Figure 5
Figure 5. Effects of TGF-β1 on hypothalamic RNA SGs and IκBα mRNA decay
(a, b) Male C57BL/6 mice were injected with TGF-β1 (4 ng) vs. vehicle (Veh), and hypothalami were harvested for measuring mRNA levels of SGs/PBs components (a) or HuR immunostaining (b). Nuclear staining by DAPI revealed cells in sections. Images show a representative sub-area of the MBH. Scale bar = 10 μm. (c, d) GT1-7 cells were treated with TGF-β1 (10 ng/ml) for the indicated durations and were harvested for measuring IκBα mRNA levels. (e) Male C57BL/6 mice were injected with TGF-β1 (4 ng) vs. vehicle (Veh), and hypothalami were harvested for measuring mRNA levels of IκBα. (f – g) Male C57BL/6 mice received MBH injection of lentiviral dominant-negative IκBα vs. control (Con), and were injected with TGF-β1 vs. vehicle. Mice were killed for Western blots (f), or examined with ITT (g). Bar graph shows the area under curve (AUC) values of ITT. * P < 0.05, ** P < 0.01, *** P < 0.001, n = 4 mice per group (a, e), and n = 4 samples per group (c, d), and n = 5 – 8 mice per group (g). Error bars reflect mean ± SEM. AU: arbitrary unit.
Figure 6
Figure 6. Hypothalamic TGF-β and RNA SGs/PBs link aging to glucose disorders
Male C57BL/6 mice (a, b) and Tgfb1+/− vs. WT mice (Con) (c – f) were analyzed at young vs. middle-aged age (2 vs. ∼15 months old). Hypothalamic mRNA levels of SGs/PBs components (a) and HuR immunostaining (b), food intake (c), body weight (d), and blood glucose in GTT (e) and ITT (f) were analyzed. Scale bar = 10 μm (b). * P < 0.05, ** P < 0.01, *** P < 0.001; n = 4 mice per group (a, b), and n = 5 – 8 mice per group (c – f). Error bars reflect mean ± SEM.

Comment in

References

    1. Samuel VT, Shulman GI. Mechanisms for insulin resistance: common threads and missing links. Cell. 2012;148:852–871. - PMC - PubMed
    1. Gregor MF, Hotamisligil GS. Inflammatory mechanisms in obesity. Annu Rev Immunol. 2011;29:415–445. - PubMed
    1. Muoio DM, Newgard CB. Obesity-related derangements in metabolic regulation. Annu Rev Biochem. 2006;75:367–401. - PubMed
    1. Glass CK, Olefsky JM. Inflammation and lipid signaling in the etiology of insulin resistance. Cell Metab. 2012;15:635–645. - PMC - PubMed
    1. Mighiu PI, et al. Hypothalamic glucagon signaling inhibits hepatic glucose production. Nat Med. 2013;19:766–772. - PubMed

Publication types