. 2014 Aug 4:5:4560.
doi: 10.1038/ncomms5560.

Automated monitoring and quantitative analysis of feeding behaviour in Drosophila

Affiliations

Automated monitoring and quantitative analysis of feeding behaviour in Drosophila

Pavel M Itskov et al. Nat Commun. .

Abstract

Food ingestion is one of the defining behaviours of all animals, but its quantification and analysis remain challenging. This is especially the case for feeding behaviour in small, genetically tractable animals such as Drosophila melanogaster. Here, we present a method based on capacitive measurements, which allows the detailed, automated and high-throughput quantification of feeding behaviour. Using this method, we were able to measure the volume ingested in single sips of an individual, and monitor the absorption of food with high temporal resolution. We demonstrate that flies ingest food by rhythmically extending their proboscis with a frequency that is not modulated by the internal state of the animal. Instead, hunger and satiety homeostatically modulate the microstructure of feeding. These results highlight similarities of food intake regulation between insects, rodents, and humans, pointing to a common strategy in how the nervous systems of different animals control food intake.


Figures

Figure 1
Figure 1. The flyPAD setup.
(a) Concept for the use of capacitance measurement to monitor the interaction of a fly with food. The interaction between the proboscis of a fly and the food is detected as a change in capacitance between two electrodes: electrode 1 on which the fly stands and electrode 2, on which the food is placed. (b) Diagram of a behavioural arena, consisting of a PCB containing the fly arena with two independent channels allowing the monitoring of feeding from two different food sources, a capacitance-to-digital converter and a connector. (c) Schematic of the complete system. Up to 32 individual behavioural arenas can be connected to an FPGA-based multiplexing board, which collects the signals and sends them to a computer via a USB interface. (d) A representative capacitance trace depicting the low level of background noise in the absence of touch and a strong change in capacitance on contact of the fly with food (as observed using a simultaneous video recording) (arrow).
Figure 2
Figure 2. Motor pattern extraction algorithms and validation.
(a) Activity detection algorithm. Raw capacitance signal (top graph) is filtered and a RMS of the signal is calculated in a 500-ms sliding window (middle graph). Activity bouts are defined as epochs of the RMS which surpass a user-defined threshold (in red in middle graph). Extracted active food interaction bouts (activity bouts) are shaded in grey on the raw capacitance signal (lower graph). (b) Feeding detection algorithm. Capacitance trace (top graph) is filtered and differentiated (second graph from top). Positive and negative thresholds (red and blue dashed lines) are then applied to extract positive and negative deflections of the derivative. Time points of the signal where the derivative crosses the threshold are marked by blue and red arrowheads in third graph from top, indicating candidate time points for contact and detachment of proboscis with the food, respectively. The candidate contact and detachment events are assigned to form paired events based on their relative distance and size (lower graph). Black arrowhead highlights events with different shapes not corresponding to proboscis contacts with the food, which are removed by the algorithm. Segments highlighted in grey represent detected sips. (c) Validation of the feeding detection algorithm. Each dot represents the relationship between the number of proboscis contacts with food detected manually in a 10-s video fragment and the number of sips detected by the algorithm. R=Pearson Rho. (d) Validation of the temporal reliability of the sips detected by the algorithm. Each horizontal line is a 10-s period of a simultaneous capacitance and video recording. Black circles represent the coincidence of the sips detected by the algorithm and the manual annotation, red circles mark sips detected only by manual annotation and blue circles mark sips detected only by the algorithm.
Figure 3
Figure 3. Sips strongly correlate with food intake.
(a) Schematic of the experimental setup used to measure the dynamics of food intake and the kinetics of nutrient absorption. A fly expressing luciferase in the nervous system is placed on a flyPAD with a photo multiplier tube located above to simultaneously monitor its feeding behaviour and emitted photons. The fly feeds from a 10% sucrose solution containing 10 mM luciferin. (b) Representative capacitance recording depicted as feeding rate (downward-pointing black trace) and simultaneous photon counts (upward-pointing green trace). Note that every bout of feeding leads to an increase in the photon count (arrowheads) indicating that sips lead to food ingestion and subsequent contact of luciferin with the nervous system. (c) An expanded version of the initial 160 s of the recording segment inside the orange box in b. The increase in photon counts is detected tens of seconds after the initiation of feeding, suggesting that the ingested substance reaches the nervous system quickly. (d) A schematic description of the experiment used to measure the volume of consumed food in individual flies. Feeding of flies from a food solution containing luciferin is monitored using the flyPAD. Flies are subsequently homogenized and recombinant luciferase is added to the homogenate, followed by 20 s of measurement in a 96-well plate luminometer. (e) Graphs plotting the relationship between measured food intake and the number of activity bouts (left), total duration of activity bouts (middle) and the number of sips (right). R=Pearson Rho, black line represents the regression line, n=29.
Figure 4
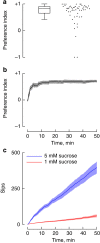
Figure 4. Using flyPAD to study food choice.
(a) Preference indices of flies choosing between a 1- and a 5-mM sucrose food source. Box plot displays the median, interquartile range and 5–95 percentile whiskers. Each dot in the scatter plot represents the preference index of a single fly. (b) Cumulative plot of the preference index over time. Black line represents the mean and the grey shading the s.e.m. (c) Cumulative feeding from the two different food sources over time. Line represents the mean and the shading the s.e.m., n=55.
Figure 5
Figure 5. Rhythmic feeding motor programme.
(a) Distribution of the durations of sips on yeast food. (b) Distribution of ISIs on yeast food. (c) Distribution of sip durations on sucrose in three different starvation states. (d) Distribution of ISIs on sucrose in three different starvation states. All histograms are plotted with the means as solid lines and the s.e.m. as shading, n=24 for all panels.
Figure 6
Figure 6. Feeding behaviour microstructure reveals homeostatic strategies.
(a) Illustration of the temporal dynamics of feeding of a fly on gelatinous food and of the different parameters measured and analyzed using the flyPAD approach. (b) Mean number of sips per burst, (c) mean IBI length and (d) mean duration of activity bouts in fully fed, 4 h starved and 8 h starved animals. (e) Cumulative feeding for the same three groups. Line represents the mean and the shading the s.e.m. (f) Number of sips per burst, (g) duration of the IBI and (h) duration of activity bouts for five consecutive 10-min time windows over the course of a meal. In fh, lines represent the mean and the shading the s.e.m.; significance was tested compared with the first window. (i) Linear and (j) quadratic coefficients extracted from quadratic fit to the cumulative feeding of individual flies (Supplementary Fig. 1) in fully fed, 4- and 8-h starved conditions. (k) Model of how hunger and satiation induce stepwise changes in feeding strategies to achieve homeostasis. Box plots display the median, interquartile range and 5–95 percentile whiskers, with data beyond these whiskers shown as points. NS, not significant (P>0.5), *P≤0.05, **P≤0.01, ***P≤0.001, Significance was tested by Wilcoxon Rank-Sum test with Bonferroni correction, n=24.

References

    1. Simpson S. J. & Raubenheimer D. The Nature of Nutrition: A Unifying Framework From Animal Adaptation To Human Obesity Princeton University Press (2012).
    1. Ribeiro C. & Dickson B. J. Sex peptide receptor and neuronal TOR/S6K signaling modulate nutrient balancing in Drosophila. Curr. Biol. 20, 1000–1005 (2010). - PubMed
    1. Zinke I., Kirchner C., Chao L. C., Tetzlaff M. T. & Pankratz M. J. Suppression of food intake and growth by amino acids in Drosophila: the role of pumpless, a fat body expressed gene with homology to vertebrate glycine cleavage system. Development 126, 5275–5284 (1999). - PubMed
    1. Itskov P. M. & Ribeiro C. The dilemmas of the gourmet fly: the molecular and neuronal mechanisms of feeding and nutrient decision making in Drosophila. Front Neurosci 7, 12 (2013). - PMC - PubMed
    1. Ja W. W. et al. Prandiology of Drosophila and the CAFE assay. Proc. Natl Acad. Sci. USA 104, 8253–8256 (2007). - PMC - PubMed

Publication types

LinkOut - more resources