. 2014 Aug 14;158(4):945-958.
doi: 10.1016/j.cell.2014.07.017. Epub 2014 Jul 31.

Single-cell phenotyping within transparent intact tissue through whole-body clearing

Affiliations

Single-cell phenotyping within transparent intact tissue through whole-body clearing

Bin Yang et al. Cell. .

Abstract

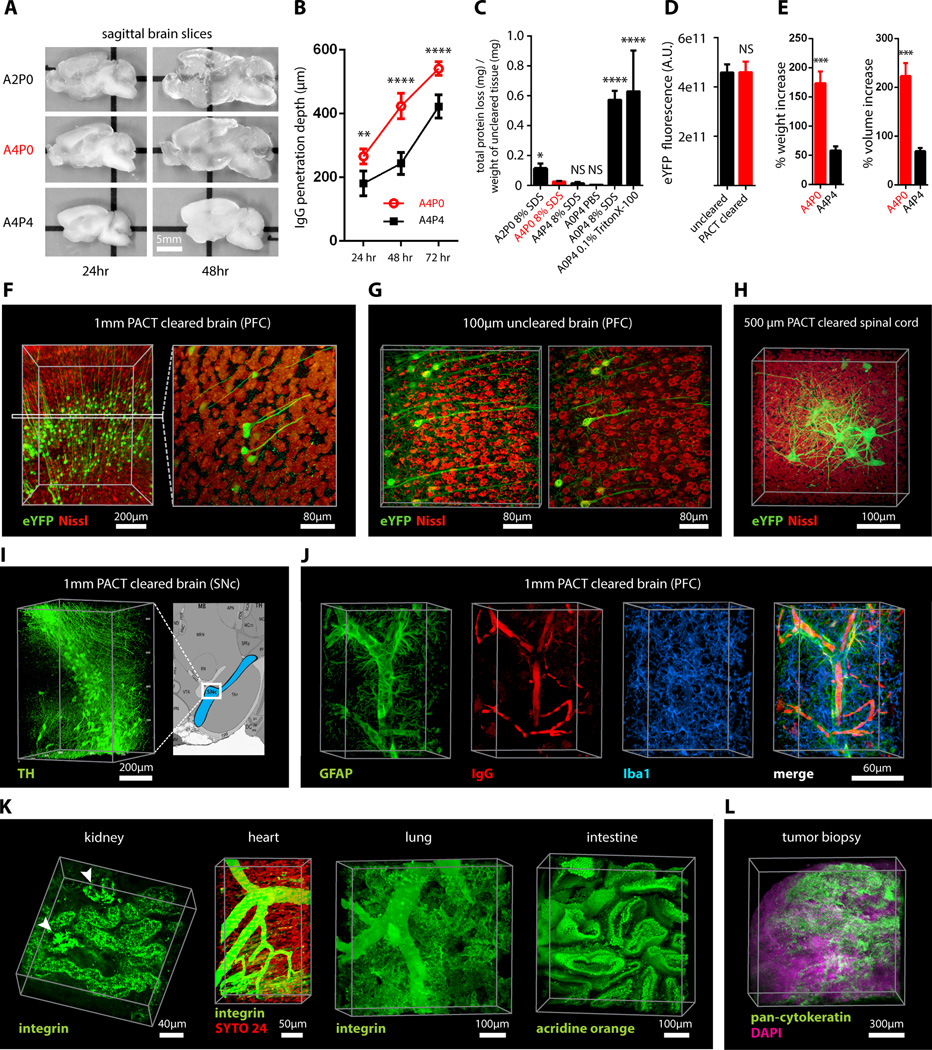
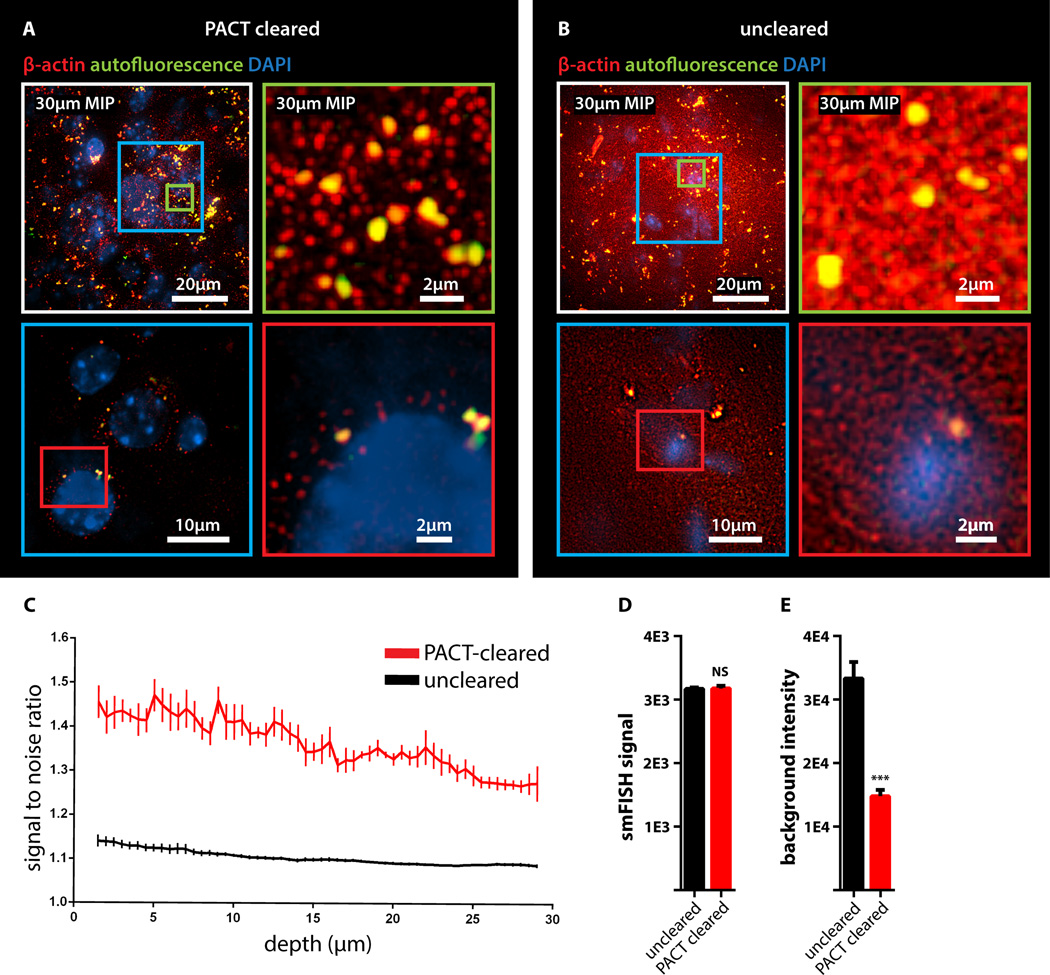
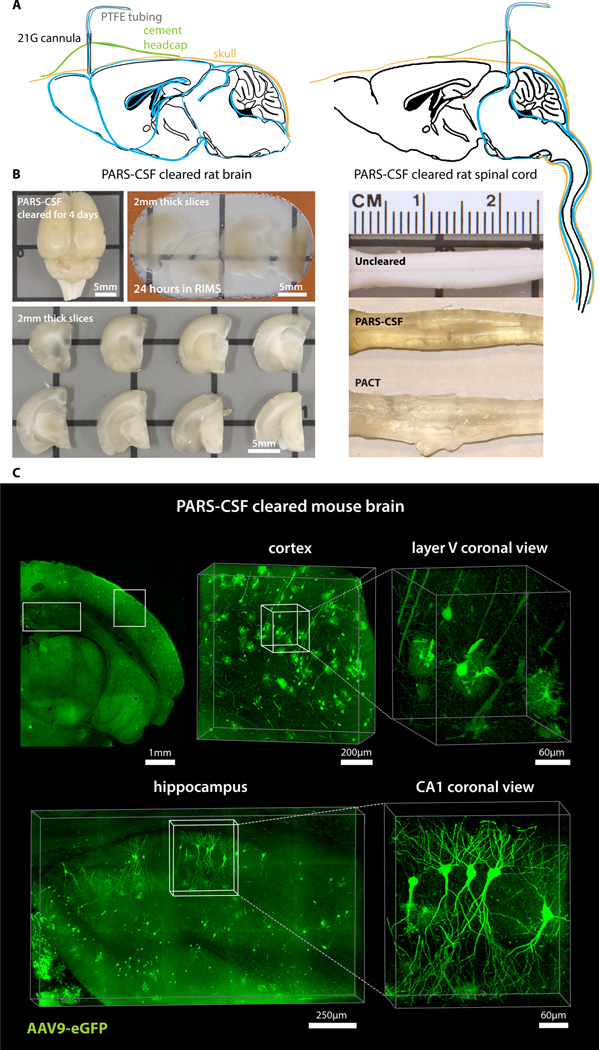
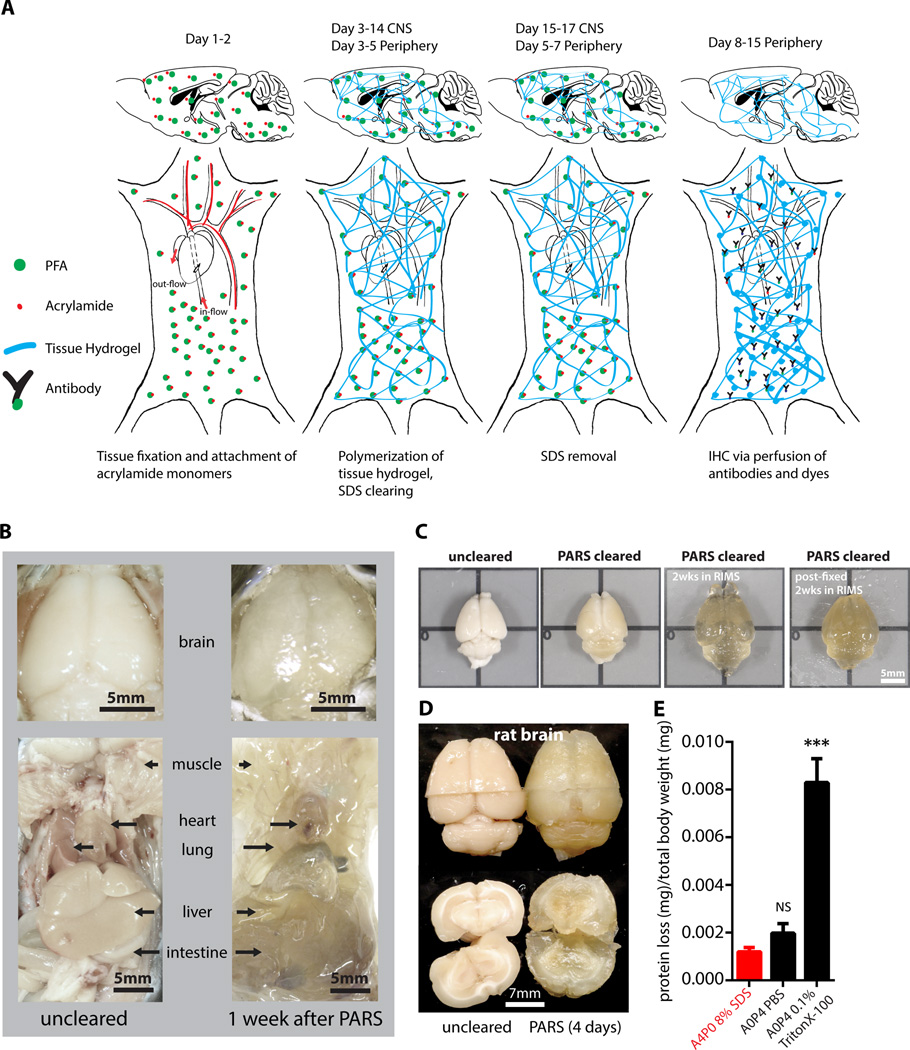
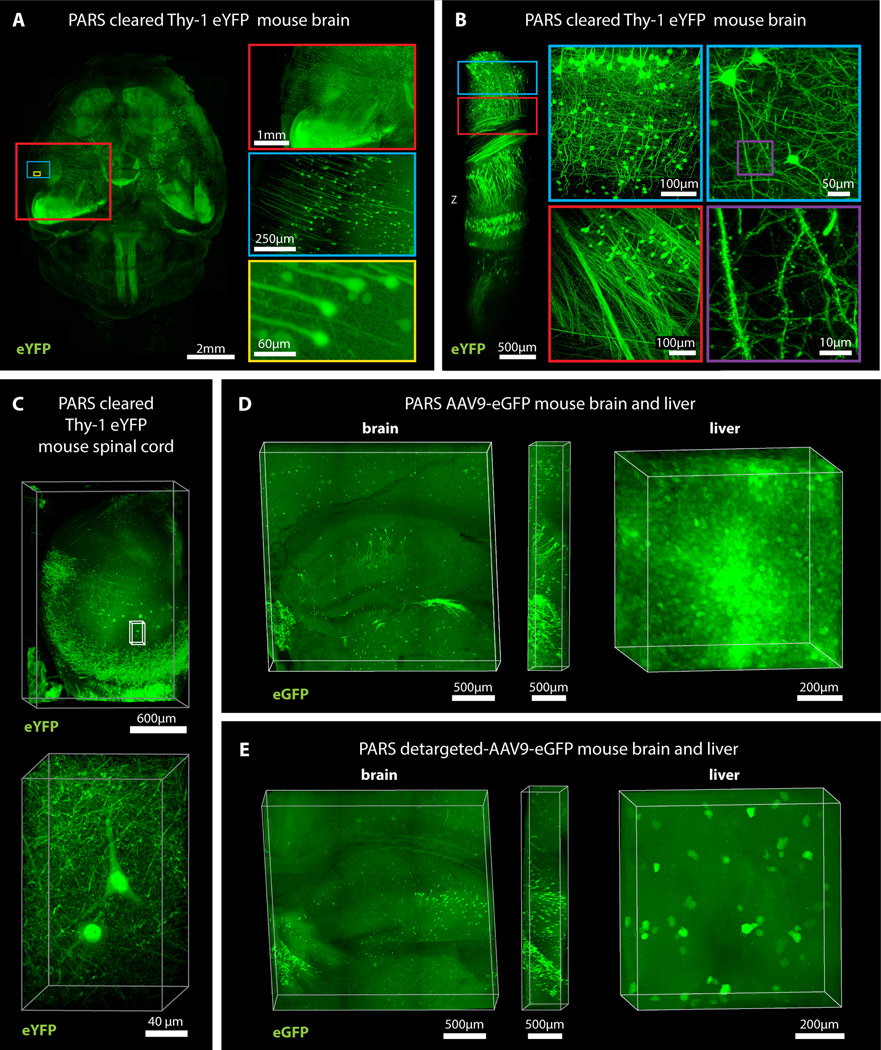
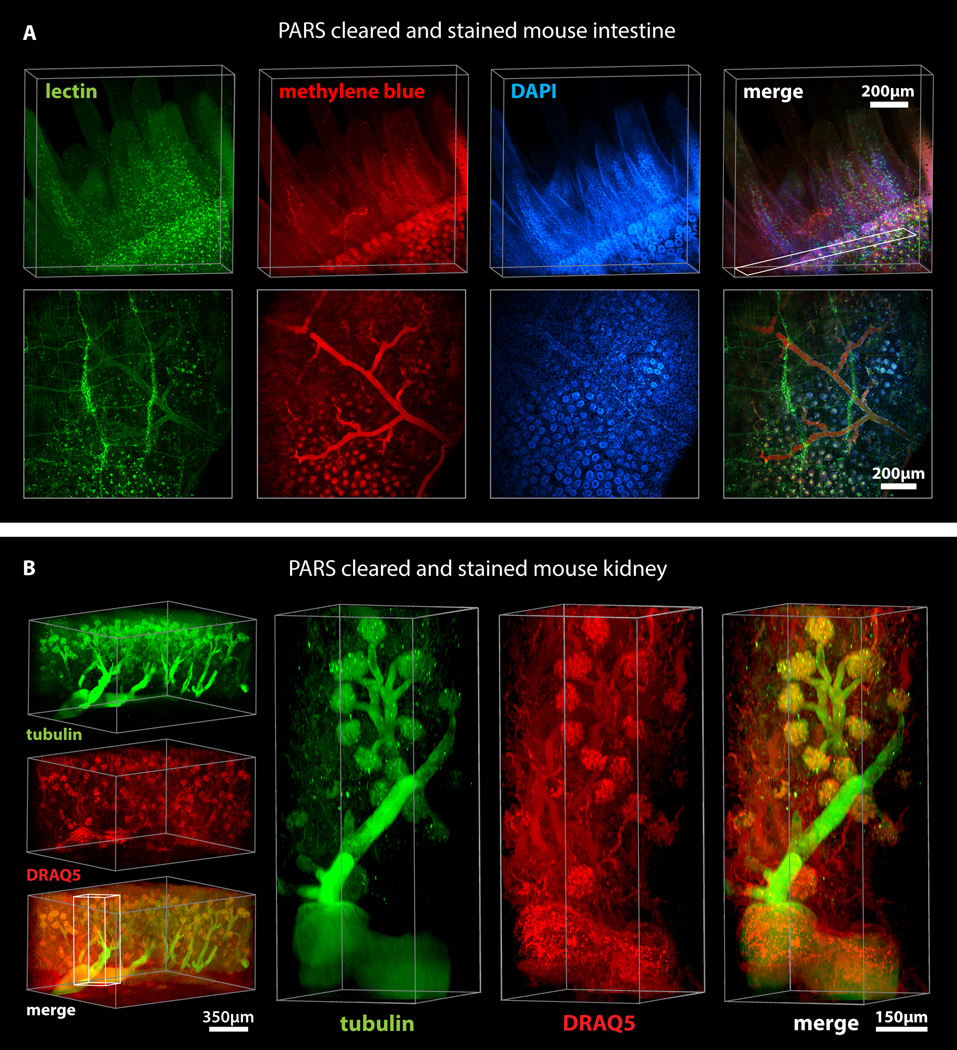
Understanding the structure-function relationships at cellular, circuit, and organ-wide scale requires 3D anatomical and phenotypical maps, currently unavailable for many organs across species. At the root of this knowledge gap is the absence of a method that enables whole-organ imaging. Herein, we present techniques for tissue clearing in which whole organs and bodies are rendered macromolecule-permeable and optically transparent, thereby exposing their cellular structure with intact connectivity. We describe PACT (passive clarity technique), a protocol for passive tissue clearing and immunostaining of intact organs; RIMS (refractive index matching solution), a mounting media for imaging thick tissue; and PARS (perfusion-assisted agent release in situ), a method for whole-body clearing and immunolabeling. We show that in rodents PACT, RIMS, and PARS are compatible with endogenous-fluorescence, immunohistochemistry, RNA single-molecule FISH, long-term storage, and microscopy with cellular and subcellular resolution. These methods are applicable for high-resolution, high-content mapping and phenotyping of normal and pathological elements within intact organs and bodies.


Figures

Figure 1
Figure 1. PACT clearing of A4P0 tissue-hydrogel hybrid achieves optimal transparency and immunohistochemistry compatibility across organs
(A) Optical transparency comparison of 3 mm adult mouse sagittal blocks of A2P0, A4P0, and A4P4 tissue-hydrogel hybrid cleared for 24 h and 48 h. (B) Compared to A4P4, A4P0 tissue-hydrogel hybrid showed faster antibody penetration (n=6 fields of view per sample). (C) The percentage of protein loss from1 mm mouse brain slices (n=6 slices for each clearing condition); statistical significance is shown for each condition vs. A4P0 8% SDS (red). (D) The integrated eYFP fluorescence intensity in arbitrary units (A.U.) of uncleared and cleared 1 mm Thy1-eYFP mouse brain slices (n=6 slices). (E) Compared to A4P4, the A4P0 hydrogel-tissue hybrid showed higher tissue expansion and weight gain post clearing. (F–H) Thy1-eYFP mouse sections stained with Nissl: (F) 1 mm cleared brain slice, prefrontal cortex (PFC) area (left: z = 1 mm imaging stack depth); (G) 1 mm uncleared brain slice, PFC (left: z = 100 µm imaging stack depth); (H) 1 mm spinal cord slice (z = 500 µm). (I) Substantia nigra pars compacta (SNc) of 1 mm mouse brain slice stained with anti-tyrosine hydroxylase (TH) antibody (z = 1 mm). (J) PFC of 1 mm adult mouse brain slices stained with antibodies against GFAP, mouse-IgG, and Iba1 (z = 1 mm). (K) 1 mm section of mouse kidney (z = 150 µm; arrowheads show glomeruli), heart (z = 320 µm), lung (z = 550 µm) and intestine (z = 350 µm) stained with anti-integrin antibodies, SYTO24, and acridine orange. (L) PACT-cleared human tissue biopsy from basal cell carcinoma (BCC) was stained with anti-pan-cytokeratin (AE1/AE3) Alexa Fluor 488 primary antibody to label endothelial cells and DAPI (700 µm imaging stack depth). All graphs are shown in mean ± SEM Statistical significance: for paired samples: 2-tailed Student’s t test; for multiple comparisons: one-way ANOVA followed by Bonferroni posthoc (*p < 0.05, **p < 0.01, ***p < 0.005, and ****p < 0.0001). All confocal imaging; for objectives see Supplemental Methods. Also see Figure S1–3 and Tables S1–2.
Figure 2
Figure 2. Detection of individual mRNA transcripts in PACT tissue sections by smFISH
100µm-thick mouse brain slices were hybridized with twenty-four 20mer oligonucleotide probes towards β-actin mRNA labeled with Alexafluor 594. (A) PACT-cleared smFISH brain slices. Upper panel shows 30 µm maximum intensity projection. An abundant number of diffraction limited spots corresponding to single beta-actin mRNAs (red) were readily detected up to 30 µm in depth under 589nm illumination. Note bright amorphous granules (yellow) are background lipofuscin vesicles that show up in both 589nm(red) and 532nm autofluorescence (green) channels, whereas smFISH signals are in the red channel only. (B) Compared to PACT cleared slices, smFISH in uncleared brain slices showed significantly decreased contrast. (Lower panels in A and B show single slices of 0.5 um at 12 um depth; the images were processed from raw data using the same contrast scale and Laplacian of Gaussian filtering; for raw data see Figure S2D) (C) Signal to noise ratio as a function of depth shows PACT-clearing tissue increases the signal to noise ratio of smFISH throughout the thickness of the sample as compared to uncleared tissue. (D) smFISH intensities show no appreciable differences between uncleared and PACT-cleared tissue. p = 0.8722; 2-tailed Student’s t test. (E) Comparison of background intensity between uncleared and PACT-cleared tissue illustrates the significant reduction of background fluorescence in PACT-cleared tissue. p = 0.0006; 2-tailed Student’s t test. All graphs are shown in mean ± s.d. For microscopy see Supplemental Methods.
Figure 3
Figure 3. PARS-CSF: a protocol for rapid whole-brain or spinal cord clearing and labeling via the cerebrospinal fluid route (CSF) using perfusion-assisted agent release in situ (PARS)
(A) CNS tissue may be rendered transparent optically transparent by the direct perfusion of all PARS reagents into the CSF via an intracranial brain shunt inserted either (left) below the dura in the region directly above the olfactory bulb, or into the cisterna magna (or placed directly above the dorsal inferior colliculus, right). The cannula, which is connected to the perfusion lines may be cemented into position with dental acrylic. (B) Whole-brain and the corresponding 2 mm thick slices (left) and whole-spinal cord (right) from PARS-CSF rats that were cleared at 37 °C for 4-days (brain) or for 2-weeks (spinal cord) are shown. The extent of whole-brain clearing is dependent on brain tissue proximity to the cannula: the frontal lobe was rendered optically transparent, whereas the mid-hind brain were only weakly cleared (see 2 mm slices on right side of panel). After 24-hour incubation in RIMS, PARS-CSF brain slices were sufficiently cleared for imaging without further sectioning. C) Images show native eGFP fluorescence in 500 µm PARS-CSF cleared coronal brain slices prepared from mice that, 6-months prior to clearing, received IV injections with AAV9:CAG-eGFP. Representative sections of cortex and hippocampus are presented at higher magnification in image boxes (right). In the layer V coronal view, an AAV9 transduced eGFP-expressing glial cell and eGFP-neuron adjacent to a blood vessel are clearly visible. In the hippocampus (bottom), the finer neuronal processes of eGFP-expressing CA1 neurons may be visualized with high resolution, which suggests that PARS-CSF may be completed without severe damage to cellular morphology. For microscopy see Supplemental Methods. Also see Figure S4.
Figure 4
Figure 4. PARS achieves whole-body clearing
(A) Schematic of PARS clearing and immunostaining. (B) A comparison of optical transparency of mouse brains and peripheral organs before and after PARS clearing. (C) Representative images of relative mouse brain size before (first box, from left) and after (second box) 2 weeks of PARS clearing shows that PARS circumvents hydrogel swelling and brain tissue expansion during the clearing process. Brain tissue expands gradually after immersion in RIMS (third box); this volume change may be mitigated via post-fixing PARS samples in 4% PFA overnight prior to RIMS mounting (fourth box). (D) Representative images of relative rat brain size before (right) and after (left) 4-days of PARS clearing, showing how PARS is a scalable method. Coronal slices of rat whole-brain samples show gross tissue morphology, highlighting that unmyelinated areas may be cleared within 4-days of PARS-based clearing. (E) Protein loss of PARS clearing compared to other clearing methods (n = 4 mice for each); graph shows mean ± s.e.m.; one way ANOVA followed by Bonferroni posthoc test was used to determine statistical significance in comparison to A4P0 8% SDS PARS clearing. * indicates p<0.05 and ** indicates p<0.01. Images for (B–D) were taken using bright field camera. Also see Figure S4, S7, S3E, and Supplemental Movie 1.
Figure 5
Figure 5. PARS enables whole-brain mapping of widespread and sparse genetically encoded fluorescent signals with subcellular resolution
(A) Whole brain image (z = 6 mm), and (B) deep-brain imaging (z = 4 mm) of adult Thy1-eYFP mouse after PARS clearing for 10 days. The boxes on the right show high magnification images of indicated areas. (C) Spinal cord image of adult Thy1-eYFP mouse after PARS clearing for 2 weeks (z = 2 mm). Lower panel shows high magnification images of indicated region (z = 1.2 mm). (D) Images show native eGFP fluorescence in 1 mm coronal brain slices (left) and liver (right) prepared from the PARS cleared mice that received IV injections of AAV9:CAG-eGFP. Image columns to the right of each coronal brain image show the orthogonal views (z = 0.5 mm). (E) Native eGFP fluorescence in 1 mm coronal brain slices (left) and liver (right) prepared from PARS cleared mice injected with a liver detargeted variant, AAV9BD1:CAG-eGFP. Image columns to the right of each coronal brain image show the orthogonal views (z = 0.5 mm). For microscopy see Supplemental Methods. Also see Figure S5 and Supplemental Movie 2 (for 5B).
Figure 6
Figure 6. PARS allows rapid and uniform clearing and immunolabeling of peripheral organs
Clearing and immunohistochemical labeling was achieved in whole mice through PARS alone. (A) PARS-cleared mouse intestine was stained with lectin, methylene blue, and DAPI, and imaged through a depth of 500 µm. Lower panels shows maximum intensity projection of above rendering, z = 50 µm. (z = 500 µm). (B) A 1 mm thick kidney section was imaged (left) for anti-tubulin antibody and DRAQ5 labeling. Right panels show high magnification images of the indicated region and the structure of glomeruli, demonstrating that PARS enables antibody-based labeling throughout the kidney (z = 1.2 mm). For microscopy see Supplemental Methods. Also see Figure S6, S7, and Supplemental Movie 3 (for 6B).

References

    1. Becker K, Jahrling N, Saghafi S, Dodt HU. Ultramicroscopy: light-sheet-based microscopy for imaging centimeter-sized objects with micrometer resolution. Cold Spring Harbor protocols. 2013;2013:704–713. - PubMed
    1. Becker K, Jahrling N, Saghafi S, Weiler R, Dodt HU. Chemical clearing and dehydration of GFP expressing mouse brains. PLoS One. 2012;7:e33916. - PMC - PubMed
    1. Buxbaum AR, Wu B, Singer RH. Single β-Actin mRNA Detection in Neurons Reveals a Mechanism for Regulating Its Translatability. Science. 2014;343:419–422. - PMC - PubMed
    1. Chung K, Deisseroth K. CLARITY for mapping the nervous system. Nature methods. 2013;10:508–513. - PubMed
    1. Chung K, Wallace J, Kim SY, Kalyanasundaram S, Andalman AS, Davidson TJ, Mirzabekov JJ, Zalocusky KA, Mattis J, Denisin AK, et al. Structural and molecular interrogation of intact biological systems. Nature. 2013;497:332–337. - PMC - PubMed

Publication types