. 2014 Aug 7;8(3):678-87.
doi: 10.1016/j.celrep.2014.06.060. Epub 2014 Jul 31.

Pref-1 marks very early mesenchymal precursors required for adipose tissue development and expansion

Affiliations

Pref-1 marks very early mesenchymal precursors required for adipose tissue development and expansion

Carolyn S Hudak et al. Cell Rep. .

Abstract

Pref-1 is an EGF-repeat-containing protein that inhibits adipocyte differentiation. To better understand the origin and development of white adipose tissue (WAT), we generated transgenic mouse models for transient or permanent fluorescent labeling of cells using the Pref-1 promoter, facilitating inducible ablation. We show that Pref-1-marked cells retain proliferative capacity and are very early adipose precursors, prior to expression of Zfp423 or PPARγ. In addition, the Pref-1-marked cells establish that adipose precursors are mesenchymal, but not endothelial or pericytal, in origin. During embryogenesis, Pref-1-marked cells first appear in the dorsal mesenteric region as early as embryonic day 10.5 (E10.5). These cells become lipid-laden adipocytes at E17.5 in the subcutaneous region, whereas visceral WAT develops after birth. Finally, ablation of Pref-1-marked cells prevents not only embryonic WAT development but also later adult adipose expansion upon high-fat feeding, demonstrating the requirement of Pref-1 cells for adipogenesis.


Figures

Figure 1
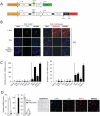
Figure 1. Labeling of Pref-1 Expressing Cells Is Specific to Adipose Tissue
(A) Pref-1-GFP and Pref-1-tdTomato mice were generated by inserting rtTA (Dox-On) directly following −6 kb of the Pref-1 promoter, whereby subsequent crossing allows fluorescent labeling (see supplemental) (B) Cryosections of inguinal WAT from Pref-1-GFP mice or Pref-1-tdTomato mice were treated with or without Dox (P0-21). Scale bars = 200 μm. (C) RT-qPCR of total mRNA from various tissues of Pref-1-rtTA mice. (D) Total mRNA from the SVF and adipocyte fractions of age-matched male Pref-1-GFP mice. Analysis of Pref-1 mRNA at the single cell level. Values are ± SEM of 5 mice per group. Paired t test, *p< 0.05, **p< 0.01.
Figure 2
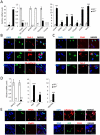
Figure 2. Characterization of Pref-1 Marked Cells Reveals a Mesenchymal Origin of Adipose Precursors
(A and D) GFP positive and negative cells were sorted via FACS from freshly isolated SVF from WAT of Dox treated Pref-1-GFP mice, total mRNA was extracted and expression levels of various endothelial, pericyte, hematopoietic and mesenchymal markers were measured. Age-matched two week old Pref-1 GFP male mice were used. Paired t test; *p< 0.05, **p< 0.01, ***p< 0.005, N=5. (B,C and E) Confocal images of Dox treated (from E0) Pref-1 GFP mouse embryos (E19.5). Scale bar = 150 μm.
Figure 3
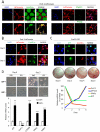
Figure 3. Pref-1 Labeled Cells Differentiate into Adipocytes
(A) Confocal images of cryosectioned WAT from Dox treated Pref-1-tdTomato mice. (B) Cultured SVF from Dox treated Pref-1-tdTomato mice treated with adipogenic cocktail (C) Cultured SVF from Dox treated Pref-1-GFP mice treated with adipogenic cocktail; Oil Red O staining; and RT-qPCR of adipogenic genes from total mRNA of cultured SVF throughout differentiation. (D) Brightfield microscopy of cultured sorted GFP positive and negative cells in adipogenic media. RT-qPCR of adipogenic genes from total mRNA of cultured sorted GFP positive and negative cells. Values are ± SD of biological duplicate and technical triplicates. t test, *p< 0.05, **p< 0.01, ***p< 0.005. Scale bars: (A, B) 100 μm, (C) 150 μm, (D) 250 μm.
Figure 4
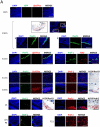
Figure 4. Pref-1 Adipose Precursors are Required for Embryonic Adipose Development and Expansion in Adults
(A) Female Pref-1-GFP mice were treated with Dox at mating and whole embryos were cryosectioned throughout embryogenesis, GFP, DAPI and lipidTox staining were examined. Whole embryo cryosection at E8.5 (top); at E10.5 (second); at E13.5 (third); at E17.5, some lipid droplets were stained by lipidTox, permanently labeled Pref-1 cells overlapped with lipid identified by Oil Red O staining (fourth); at E19.5, permanently labeled Pref-1 cells are developing into lipid containing cells as shown by Oil red O staining (fifth); at birth, GFP positive cells are located near the edge of the developing adipose tissue as shown by overlay with hematoxylin and Oil Red O staining, permanently labeled Pref-1 cells are developing into adipocytes shown by Oil red O staining in the same region (sixth). Direct fluorescence of GFP in epididymal WAT from P6 mice, GFP positive cells are located around the outer edge of the developing tissue (bottom). TdTomato labeled adipocytes are detected in P21 epididymal WAT. Scale bars= 250 μm, images are representative ≥ 5 mice.
Figure 5
Figure 5. Deletion of Pref-1 Adipose Precursors Prevents Adipose Tissue Development and Expansion
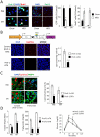
(A) Confocal microscopy of cryosectioned inguinal and epididymal adipose tissue from Dox-treated Pref-1-GFP mice after 3 weeks of high fat feeding; Quantification of BrdU positive and GFP positive cells. Values are ±SEM of ≥ 5 mice. (B) Pref-1-DTA mice were generated by inserting rtTA directly following −6 kb of the Pref-1 promoter; Confocal microscopy of whole embryos at E17.5 following depletion of Pref-1 cells; Quantification of lipid containing cells in control and Pref-1 depleted inguinal and epididymal WAT. (C) Cryosections of inguinal and epididymal WAT from Dox treated Pref-1-rtTA control and Pref-1-DTA mice; Quantification of lipid containing cells in control and Pref-1 depleted inguinal and epididymal WAT. (D) Fat pad mass; Triglyceride content of inguinal and epididymal WAT from Pref-1-rtTA and Pref-1-DTA mice; Glucose tolerance test of Dox treated Pref-1-rtTA control and Pref-1-DTA mice. Values are ±SEM of 5 mice per group. t test, p=0.01,*p<0.05. Scale bars: (A, B, C) 200 μm.

References

    1. Berry R, Rodeheffer MS. Characterization of the adipocyte cellular lineage in vivo. Nat. Cell Biol. 2013;15:302–308. - PMC - PubMed
    1. Billon N, Dani C. The generation of adipocytes by the neural crest. Stem Cell Rev. 2012;8:55–66. - PubMed
    1. Dimov IK, Rong L, Lee EP, Seita J, Sahoo D, Park SM, Wiessman IL, Lee LP. Discriminating cellular heterogeneity using microwell-based RNA cytometry. Nature Comm. 2014;5:3451. - PMC - PubMed
    1. Cawthorn WP, Bree AJ, Yao Y, Du B, Hemati N, Martinez-Santibanez G, MacDougald OA. Wnt6, Wnt10a and Wnt10b inhibit adipogenesis and stimulate osteoblastogenesis through a beta-catenin-dependent mechanism. Bone. 2012;15(2):477–489. - PMC - PubMed
    1. Farmer SR. Transcriptional control of adipocyte formation. Cell Metab. 2006;4:263–273. - PMC - PubMed

Publication types

MeSH terms