

Deletion of the mitochondrial chaperone TRAP-1 uncovers global reprogramming of metabolic networks
- PMID: 25088416
- PMCID: PMC4127146
- DOI: 10.1016/j.celrep.2014.06.061
Deletion of the mitochondrial chaperone TRAP-1 uncovers global reprogramming of metabolic networks
Abstract
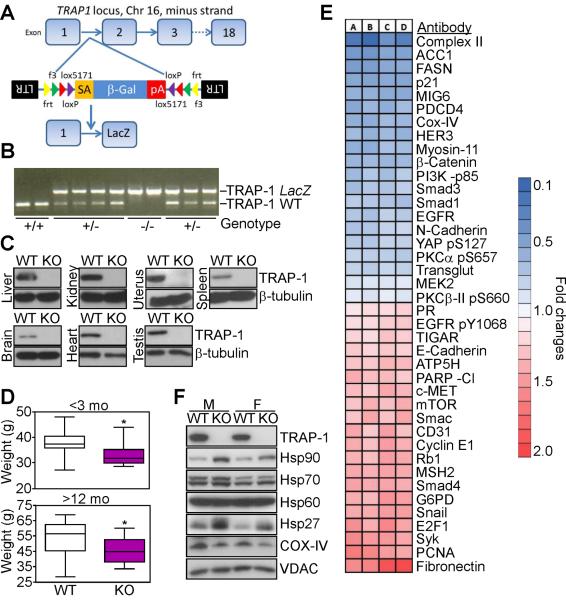
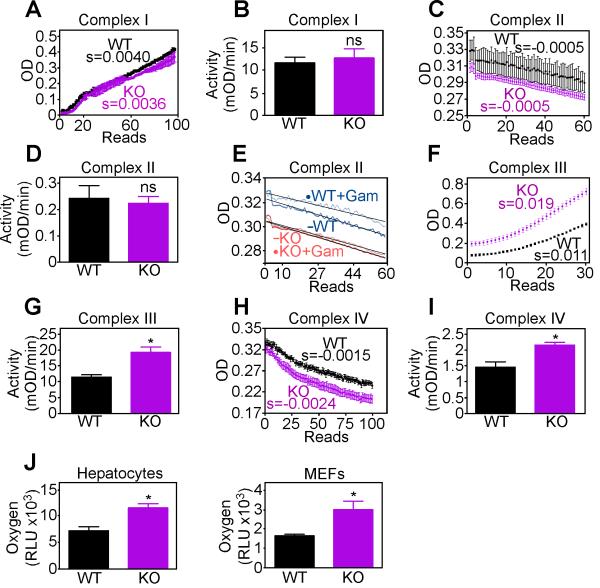
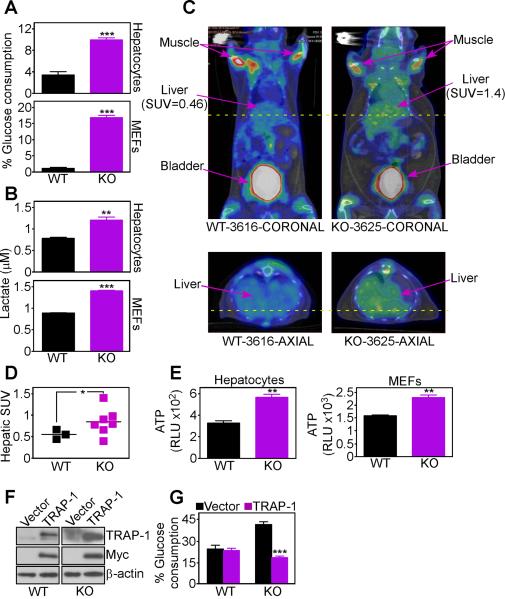
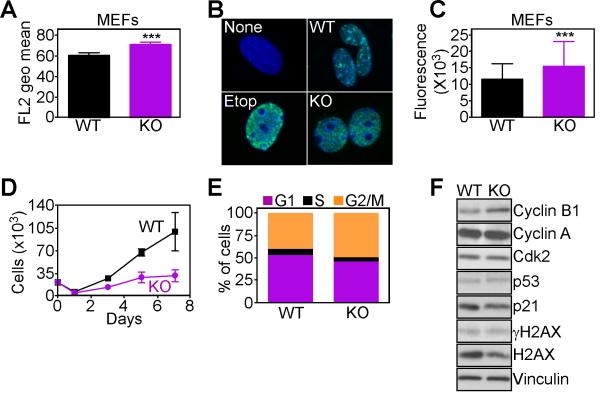
Reprogramming of metabolic pathways contributes to human disease, especially cancer, but the regulators of this process are unknown. Here, we have generated a mouse knockout for the mitochondrial chaperone TRAP-1, a regulator of bioenergetics in tumors. TRAP-1(-/-) mice are viable and showed reduced incidence of age-associated pathologies, including obesity, inflammatory tissue degeneration, dysplasia, and spontaneous tumor formation. This was accompanied by global upregulation of oxidative phosphorylation and glycolysis transcriptomes, causing deregulated mitochondrial respiration, oxidative stress, impaired cell proliferation, and a switch to glycolytic metabolism in vivo. These data identify TRAP-1 as a central regulator of mitochondrial bioenergetics, and this pathway could contribute to metabolic rewiring in tumors.
Copyright © 2014 The Authors. Published by Elsevier Inc. All rights reserved.
Figures
Similar articles
-
Mitochondrial oxidative phosphorylation TRAP(1)ped in tumor cells.Trends Cell Biol. 2014 Aug;24(8):455-63. doi: 10.1016/j.tcb.2014.03.005. Epub 2014 Apr 11. Trends Cell Biol. 2014. PMID: 24731398 Free PMC article. Review.
-
Analysis and functional relevance of the chaperone TRAP-1 interactome in the metabolic regulation and mitochondrial integrity of cancer cells.Sci Rep. 2023 May 10;13(1):7584. doi: 10.1038/s41598-023-34728-1. Sci Rep. 2023. PMID: 37165028 Free PMC article.
-
Metabolic reprogramming identifies the most aggressive lesions at early phases of hepatic carcinogenesis.Oncotarget. 2016 May 31;7(22):32375-93. doi: 10.18632/oncotarget.8632. Oncotarget. 2016. PMID: 27070090 Free PMC article.
-
MYC Induces a Hybrid Energetics Program Early in Cell Reprogramming.Stem Cell Reports. 2018 Dec 11;11(6):1479-1492. doi: 10.1016/j.stemcr.2018.10.018. Epub 2018 Nov 21. Stem Cell Reports. 2018. PMID: 30472011 Free PMC article.
-
Modulation of Mitochondrial Metabolic Reprogramming and Oxidative Stress to Overcome Chemoresistance in Cancer.Biomolecules. 2020 Jan 14;10(1):135. doi: 10.3390/biom10010135. Biomolecules. 2020. PMID: 31947673 Free PMC article. Review.
Cited by
-
The Mitochondrial Unfoldase-Peptidase Complex ClpXP Controls Bioenergetics Stress and Metastasis.PLoS Biol. 2016 Jul 7;14(7):e1002507. doi: 10.1371/journal.pbio.1002507. eCollection 2016 Jul. PLoS Biol. 2016. PMID: 27389535 Free PMC article.
-
The development of cancers research based on mitochondrial heat shock protein 90.Front Oncol. 2023 Nov 30;13:1296456. doi: 10.3389/fonc.2023.1296456. eCollection 2023. Front Oncol. 2023. PMID: 38098505 Free PMC article. Review.
-
The mitochondrial unfolded protein response and mitohormesis: a perspective on metabolic diseases.J Mol Endocrinol. 2018 Oct 1;61(3):R91-R105. doi: 10.1530/JME-18-0005. J Mol Endocrinol. 2018. PMID: 30307158 Free PMC article. Review.
-
Tumor Necrosis Factor Receptor-associated Protein 1 (TRAP1) Mutation and TRAP1 Inhibitor Gamitrinib-triphenylphosphonium (G-TPP) Induce a Forkhead Box O (FOXO)-dependent Cell Protective Signal from Mitochondria.J Biol Chem. 2016 Jan 22;291(4):1841-1853. doi: 10.1074/jbc.M115.656934. Epub 2015 Dec 2. J Biol Chem. 2016. PMID: 26631731 Free PMC article.
-
Inducible aging in Hydra oligactis implicates sexual reproduction, loss of stem cells, and genome maintenance as major pathways.Geroscience. 2020 Aug;42(4):1119-1132. doi: 10.1007/s11357-020-00214-z. Epub 2020 Jun 23. Geroscience. 2020. PMID: 32578072 Free PMC article.
References
Publication types
MeSH terms
Substances
Grants and funding
LinkOut - more resources
Full Text Sources
Other Literature Sources
Medical
Molecular Biology Databases
Research Materials
Miscellaneous
