

Sources of variance in a female fertility signal: exaggerated estrous swellings in a natural population of baboons
- PMID: 25089069
- PMCID: PMC4114734
- DOI: 10.1007/s00265-014-1722-y
Sources of variance in a female fertility signal: exaggerated estrous swellings in a natural population of baboons
Abstract
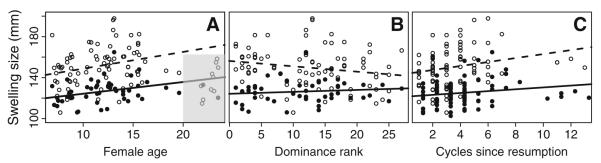
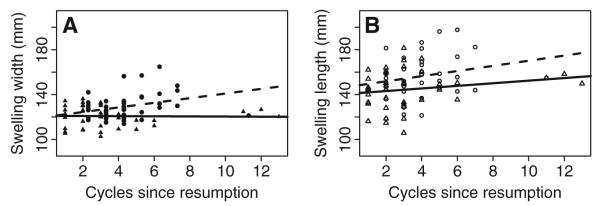
Signals of fertility in female animals are of increasing interest to evolutionary biologists, a development that coincides with increasing interest in male mate choice and the potential for female traits to evolve under sexual selection. We characterized variation in size of an exaggerated female fertility signal in baboons and investigated the sources of that variance. The number of sexual cycles that a female had experienced after her most recent pregnancy ("cycles since resumption") was the strongest predictor of swelling size. Furthermore, the relationship between cycles since resumption and swelling size was most evident during rainy periods and was not evident during times of drought. Finally, we found significant differences in swelling size between individual females; these differences endured across cycles (i.e., were not explained by variation within individuals) and persisted in spite of ecological effects. This study is the first to provide conclusive evidence of significant variation in swelling size between female primates (controlling for cycles since resumption) and to demonstrate that ecological constraints influence variation in this signal of fertility.
Keywords: Baboon; Estrous swelling; Fertility.
Figures


Similar articles
-
Exaggerated sexual swellings and male mate choice in primates: testing the reliable indicator hypothesis in the Amboseli baboons.Anim Behav. 2015 Jun 1;104:175-185. doi: 10.1016/j.anbehav.2015.03.019. Anim Behav. 2015. PMID: 26752790 Free PMC article.
-
Can fertility signals lead to quality signals? Insights from the evolution of primate sexual swellings.Proc Biol Sci. 2009 May 22;276(1663):1889-97. doi: 10.1098/rspb.2008.1923. Epub 2009 Feb 25. Proc Biol Sci. 2009. PMID: 19324772 Free PMC article.
-
Multimodal sexual signals are not precise indicators of fertility in female Kinda baboons.Horm Behav. 2024 Sep;165:105632. doi: 10.1016/j.yhbeh.2024.105632. Epub 2024 Sep 7. Horm Behav. 2024. PMID: 39244874
-
The evolution of male mate choice in insects: a synthesis of ideas and evidence.Biol Rev Camb Philos Soc. 2001 Aug;76(3):305-39. doi: 10.1017/s1464793101005693. Biol Rev Camb Philos Soc. 2001. PMID: 11569787 Review.
-
Glucocorticoids, male sexual signals, and mate choice by females: Implications for sexual selection.Gen Comp Endocrinol. 2020 Mar 1;288:113354. doi: 10.1016/j.ygcen.2019.113354. Epub 2019 Dec 9. Gen Comp Endocrinol. 2020. PMID: 31830474 Review.
Cited by
-
Female ornaments: is red skin color attractive to males and related to condition in rhesus macaques?Behav Ecol. 2021 Jan 28;32(2):236-247. doi: 10.1093/beheco/araa121. eCollection 2021 Mar-Apr. Behav Ecol. 2021. PMID: 33814977 Free PMC article.
-
The evolution of male mate choice and female ornamentation: a review of mathematical models.Curr Zool. 2018 Jun;64(3):323-333. doi: 10.1093/cz/zoy029. Epub 2018 Apr 18. Curr Zool. 2018. PMID: 30402075 Free PMC article.
-
When is Offspring Viability Fitness a Measure of Paternal Fitness and When is it not?J Hered. 2022 Feb 17;113(1):48-53. doi: 10.1093/jhered/esab055. J Hered. 2022. PMID: 34850026 Free PMC article.
-
Gut Microbiota in Dholes During Estrus.Front Microbiol. 2020 Nov 30;11:575731. doi: 10.3389/fmicb.2020.575731. eCollection 2020. Front Microbiol. 2020. PMID: 33329438 Free PMC article.
-
Exaggerated Sexual Swellings and the Probability of Conception in Wild Sanje Mangabeys (Cercocebus sanjei).Int J Primatol. 2017;38(3):513-532. doi: 10.1007/s10764-017-9961-1. Epub 2017 Apr 25. Int J Primatol. 2017. PMID: 28680189 Free PMC article.
References
-
- Akaike H. Information theory as an extension of the maximum likelihood principle. In: Petrov B, Csaki F, editors. Proceedings of the 2nd international symposium of information theory; Akademiai Kiado, Budapest. 1973. pp. 267–281.
-
- Alberts SC. Magnitude and sources of variation in male reproductive performance. In: Mitani J, Call J, Kappeler P, Palombit R, Silk J, editors. Evolution of primate societies. University of Chicago Press; USA: 2012. pp. 412–431.
-
- Alberts SC, Altmann J. Matrix models for primate life history analysis. In: Kappeler P, Pereira ME, editors. Primate life history and socioecology. University of Chicago Press; Chicago: 2003. pp. 66–102.
-
- Alberts SC, Altmann J. Monitoring guide for the Amboseli Baboon Research Project: protocols for long-term monitoring and data collection. 2011 Published online at http://princeton.edu/~baboon/monitoring_guide.html.
-
- Alberts SC, Altmann J. The Amboseli Baboon Research Project: themes of continuity and change. In: Kappeler P, Watts D, editors. Long-term field studies of primates. Springer; Berlin: 2012. pp. 261–288.
Grants and funding
LinkOut - more resources
Full Text Sources
Other Literature Sources