

doi: 10.1080/10407413.2014.877284.
Camera Focal Length and the Perception of Pictures
Affiliations
- PMID: 25089080
- PMCID: PMC4114730
- DOI: 10.1080/10407413.2014.877284
Item in Clipboard
Camera Focal Length and the Perception of Pictures
Ecol Psychol.
.
No abstract available
Figures
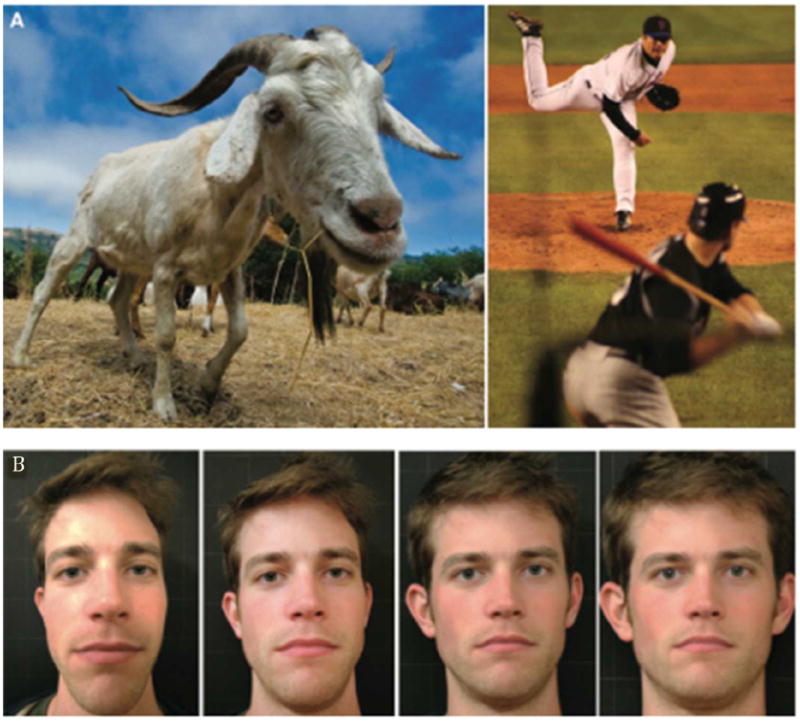
Depth compression and expansion with different focal lengths. A) Left panel: wide-angle effect (short focal length). This picture was taken with a 16mm lens (all focal lengths are reported as 35mm equivalent). The goat looks stretched in depth. Right panel: telephoto effect (long focal - length). This picture was taken with a 486mm focal length. The distance between the pitcher's mound and home plate on an official Major League Baseball field is 18.4 meters. This distance appears compressed. B) Photographs of the same person were taken with focal lengths from left to right of 16, 22, 45, and 216mm. Lens distortion was removed in Adobe PhotoShop, so the pictures are nearly correct perspective projections. Camera distance was proportional to focal length, so the subject's interocular distance in the picture was constant. The subject's face appears rounder with a short focal length and flatter with a long focal length.
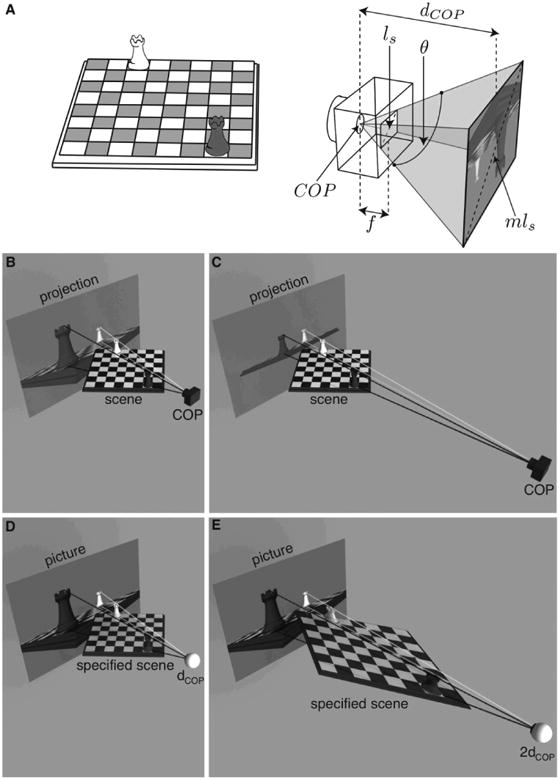
Camera, picture, and viewing parameters. A) Scene, camera, and picture. A camera with focal length f captures a picture on the sensor. The camera's diagonal field of view is θ. The sensor's diagonal length is ls, and the print is magnified by m to have a diagonal length of mls. The COP is located at the optical center of the camera. The distance to the COP, dCOP, is fm and the diagonal field of view subtended by the picture when viewed from the COP is θ. B,C) Perspective projection. The original scene—a chessboard—is projected from two different COPs onto a projection plane. D) If the picture from B is viewed from dCOP, the specified scene is the same as the original chessboard. E) If the same picture is viewed from twice the COP distance (2dCOP), the specified scene is stretched in depth relative to the original chessboard.
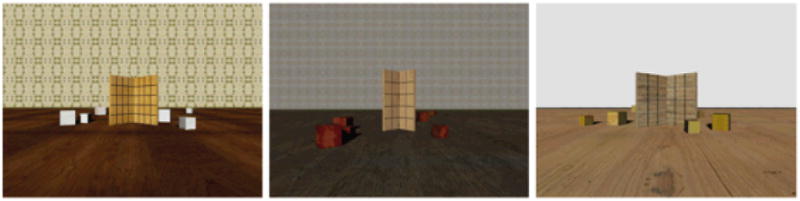
Examples of the hinge stimuli. The environment (background, cubes) and shape of the hinges were randomized to prevent subjects from learning specific pictorial cues to the hinge angle. There were three backgrounds, each with three unique hinge shapes resulting in nine scenes altogether. On each trial, the displayed hinge was selected randomly from these nine scenes.
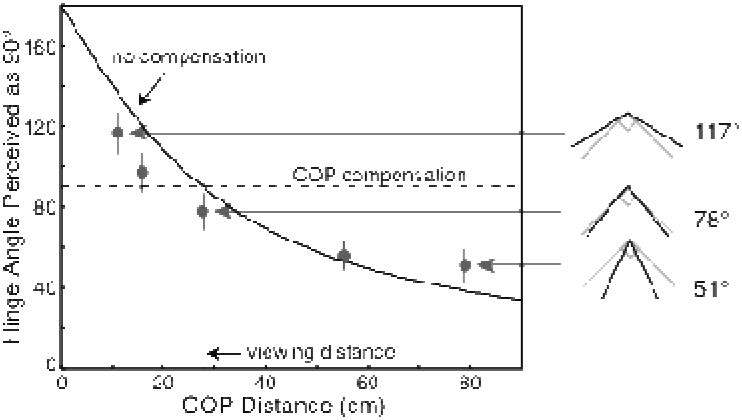
Effect of distance to COP on the angle perceived as 90°. Gray circles represent the mean angle perceived as 90° across subjects; error bars are standard errors. The dotted vertical line indicates the viewing distance. Plan views of the depicted angles that appeared to be 90° are shown in black on the right. The gray hinges indicate 90° for comparison.
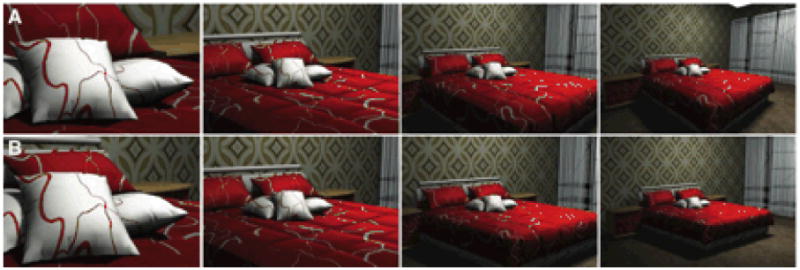
Changing focal length and camera distance to maintain constant size of the focal object (in this case, a pillow). A) The effect of changing focal length while keeping camera position constant. The focal lengths from left to right are 160, 56, 32, and 22mm. B) The effect of changing camera distance while holding focal length constant. From left to right, the camera is moved farther and farther from the focal object. Focal length was always 56mm. By moving the camera farther from the focal object, the sizes of the focal object are matched to those in the upper row without changing COP distance. Differences between the images in A and B are particularly noticeable in the apparent shape of the bed and slant of the wall.
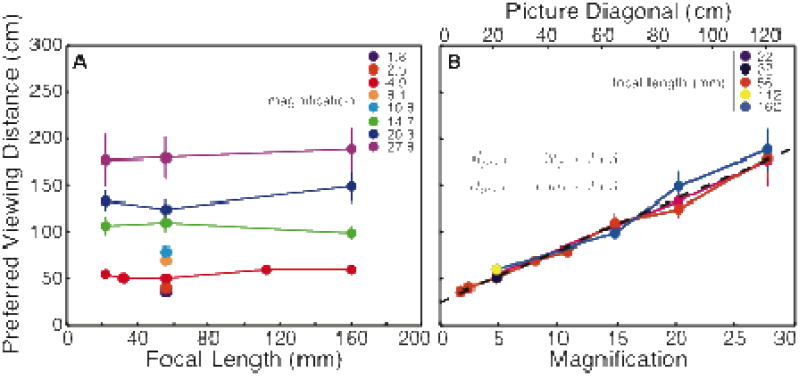
Effects of focal length and magnification on preferred viewing distance. A) Preferred viewing distance is plotted as a function of focal length for each magnification. Circles represent the data: the mean preferred viewing distance across subjects. Error bars represent standard errors of the mean. Each color represents a different picture magnification (and therefore a different picture size), as indicated by the legend. B) Data from panel A re-plotted as a function of magnification for each focal length. The diagonal length of the picture for different magnifications is indicated at the top. A linear regression of the data is represented by the dashed black line and the equation. All five focal length levels are plotted for magnification = 4.9, but the circles are largely overlapping because there was so little effect of focal length.
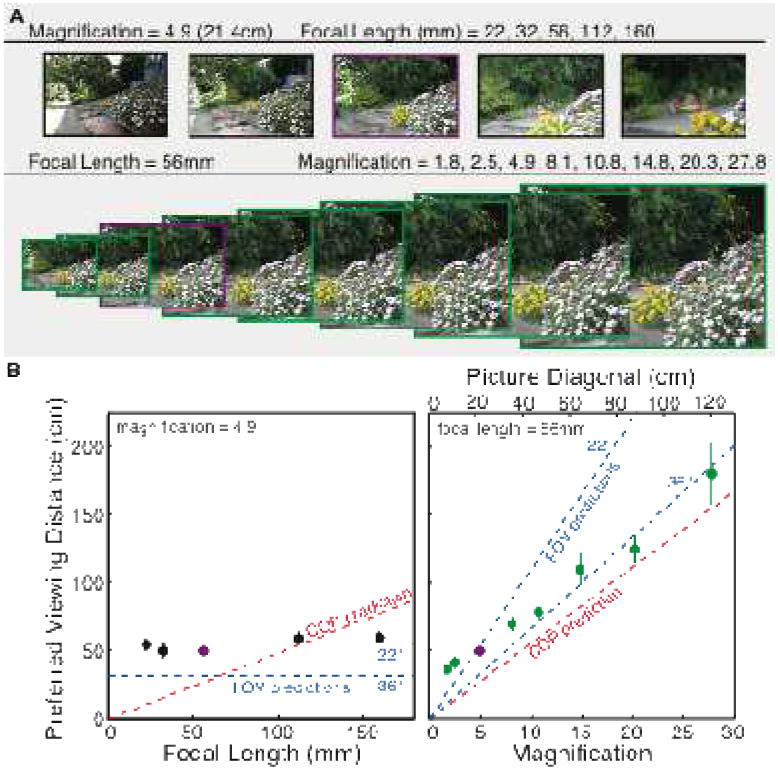
A) Example stimuli for two subsets of conditions. One subset contains five focal lengths with a magnification of 4.9 (diagonal length of the printed picture was 21.4cm). The other subset contains eight magnifications with a focal length of 56mm. The relative sizes of the stimuli actually changed by a factor of 15.4, but we cannot show such a large change in the figure. Therefore, the change in relative size shown above is qualitative. The purple boxes around two of the pictures indicate the one that was in both subsets. B) Two plots of average preferred viewing distance across subjects for each manipulation. Black and green circles represent the focal length and magnification manipulations, respectively, and correspond to the boxes around the pictures in panel A. The purple circles in both plots represent data from one magnification and focal length (4.9 and 56mm, respectively). Error bars represent standard errors of the mean.
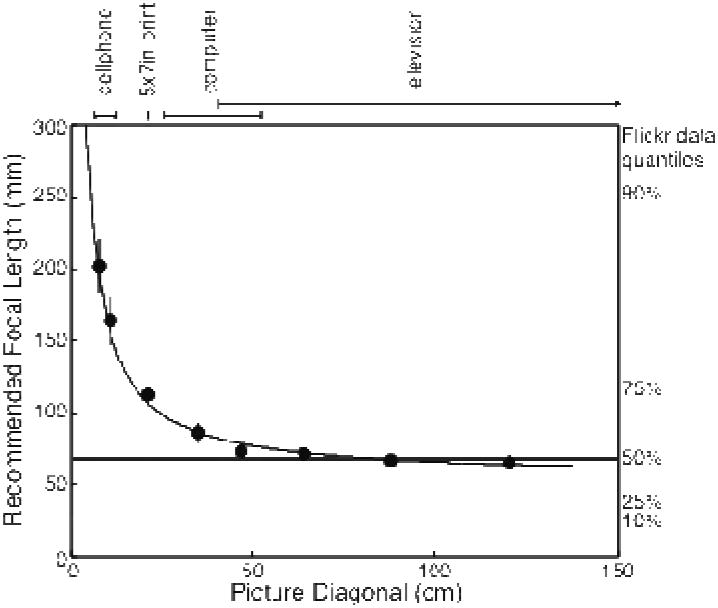
Recommended focal length as a function of picture size. We calculated recommended focal length for each picture size by determining the average preferred viewing distance across all focal lengths from Experiment 2 (Figure 6B), and then calculating the focal length that would produce a COP distance equal to the preferred distance (Equation 4). Circles represent those values and error bars represent standard errors. The black curve shows the linear regression from Figure 6B re-plotted in terms of recommended focal length. Vertical bands indicate some typical images sizes for various formats. Horizontal bands indicate quantiles from several cumulative probability values for 3,930 Flickr photographs taken with SLR cameras.
References
-
- Adams KR. Perspective and the viewpoint. Leonardo. 1972;5:209–217.
-
- Ardito M. Studies of the influence of display size and picture brightness on the preferred viewing distance for HDTV programs. SMPTE Journal. 1994;103:517–522.
-
- Belt AF. The elements of photography: Understanding and creating sophisticated images. 2 Focal Press; Burlington, MA: 2008.
-
- Bengston JK, Stergios JC, Ward JL, Jester RE. Optic array determinants of apparent distance and size in pictures. Journal of Experimental Psychology: Human Perception & Performance. 1980;6:751–759. - PubMed
-
- Carlsson C, Walden P. Mobile TV - to live or die by content. Proceedings of the 40th Hawaii International Conference on System Sciences. 2007;1:1530–1605.
Grants and funding
LinkOut - more resources
Full Text Sources
Other Literature Sources