Toll-like receptor ligands LPS and poly (I:C) exacerbate airway hyperresponsiveness in a model of airway allergy in mice, independently of inflammation
- PMID: 25089623
- PMCID: PMC4121312
- DOI: 10.1371/journal.pone.0104114
Toll-like receptor ligands LPS and poly (I:C) exacerbate airway hyperresponsiveness in a model of airway allergy in mice, independently of inflammation
Abstract
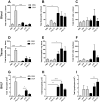
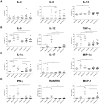
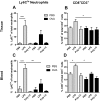
It is well-established that bacterial and viral infections have an exacerbating effect on allergic asthma, particularly aggravating respiratory symptoms, such as airway hyperresponsiveness (AHR). The mechanism by which these infections alter AHR is unclear, but some studies suggest that Toll-like receptors (TLRs) play a role. In this study, we investigated the impact of TLR3 and TLR4 ligands on AHR and airway inflammation in a model of pre-established allergic inflammation. Female BALB/c mice were sensitised and challenged intranasally (i.n.) with either PBS or ovalbumin (OVA) and subsequently i.n. challenged with poly (I:C) (TLR3) or LPS (TLR4) for four consecutive days. The response to methacholine was measured in vivo; cellular and inflammatory mediators were measured in blood, lung tissue and broncheoalveolar lavage fluid (BALF). OVA challenge resulted in an increase in AHR to methacholine, as well as increased airway eosinophilia and TH2 cytokine production. Subsequent challenge with TLR agonists resulted in a significant increase in AHR, but decreased TLR-specific cellular inflammation and production of immune mediators. Particularly evident was a decline in LPS-induced neutrophilia and neutrophil-associated cytokines following LPS and poly (I:C) treatment. The present data indicates that TLRs may play a pivotal role in AHR in response to microbial infection in allergic lung inflammation. These data also demonstrate that aggravated AHR occurs in the absence of an exacerbation in airway inflammation and that allergic inflammation impedes a subsequent inflammatory response to TLRs. These results may parallel clinical signs of microbial asthma exacerbation, including an extended duration of illness and increased respiratory symptoms.
Conflict of interest statement
Figures


Similar articles
-
TNFα-blockade stabilizes local airway hyperresponsiveness during TLR-induced exacerbations in murine model of asthma.Respir Res. 2015 Oct 22;16:129. doi: 10.1186/s12931-015-0292-5. Respir Res. 2015. PMID: 26494305 Free PMC article.
-
Intranasal administration of poly(I:C) and LPS in BALB/c mice induces airway hyperresponsiveness and inflammation via different pathways.PLoS One. 2012;7(2):e32110. doi: 10.1371/journal.pone.0032110. Epub 2012 Feb 15. PLoS One. 2012. PMID: 22355412 Free PMC article.
-
Toll-like receptor activation induces airway obstruction and hyperresponsiveness in guinea pigs.Respir Res. 2024 Nov 29;25(1):421. doi: 10.1186/s12931-024-03050-3. Respir Res. 2024. PMID: 39614276 Free PMC article.
-
The alveolar macrophages in asthma: a double-edged sword.Mucosal Immunol. 2012 Nov;5(6):605-9. doi: 10.1038/mi.2012.74. Epub 2012 Aug 22. Mucosal Immunol. 2012. PMID: 22910216 Review.
-
Dual Role of Toll-like Receptors in Human and Experimental Asthma Models.Front Immunol. 2018 May 15;9:1027. doi: 10.3389/fimmu.2018.01027. eCollection 2018. Front Immunol. 2018. PMID: 29867994 Free PMC article. Review.
Cited by
-
Fungal and bacterial microbiome dysbiosis and imbalance of trans-kingdom network in asthma.Clin Transl Allergy. 2020 Oct 22;10:42. doi: 10.1186/s13601-020-00345-8. eCollection 2020. Clin Transl Allergy. 2020. PMID: 33110490 Free PMC article.
-
MicroRNA-26a/-26b-COX-2-MIP-2 Loop Regulates Allergic Inflammation and Allergic Inflammation-promoted Enhanced Tumorigenic and Metastatic Potential of Cancer Cells.J Biol Chem. 2015 May 29;290(22):14245-66. doi: 10.1074/jbc.M115.645580. Epub 2015 Apr 23. J Biol Chem. 2015. PMID: 25907560 Free PMC article.
-
TNFα-blockade stabilizes local airway hyperresponsiveness during TLR-induced exacerbations in murine model of asthma.Respir Res. 2015 Oct 22;16:129. doi: 10.1186/s12931-015-0292-5. Respir Res. 2015. PMID: 26494305 Free PMC article.
-
Pneumococcal Δpep27 Immunization Attenuates TLRs and NLRP3 Expression and Relieves Murine Ovalbumin-Induced Allergic Rhinitis.J Microbiol Biotechnol. 2022 Jun 28;32(6):709-717. doi: 10.4014/jmb.2203.03006. Epub 2022 Apr 18. J Microbiol Biotechnol. 2022. PMID: 35484967 Free PMC article.
-
Expression and Polymorphism of Toll-Like Receptor 4 and Effect on NF-κB Mediated Inflammation in Colon Cancer Patients.PLoS One. 2016 Jan 15;11(1):e0146333. doi: 10.1371/journal.pone.0146333. eCollection 2016. PLoS One. 2016. PMID: 26771524 Free PMC article.
References
MeSH terms
Substances
LinkOut - more resources
Full Text Sources
Other Literature Sources
Medical

