. 2014 Aug 4;9(8):e103775.
doi: 10.1371/journal.pone.0103775. eCollection 2014.

Long-term physiological alterations and recovery in a mouse model of separation associated with time-restricted feeding: a tool to study anorexia nervosa related consequences

Affiliations

Long-term physiological alterations and recovery in a mouse model of separation associated with time-restricted feeding: a tool to study anorexia nervosa related consequences

Sara Zgheib et al. PLoS One. .

Abstract

Background: Anorexia nervosa is a primary psychiatric disorder, with non-negligible rates of mortality and morbidity. Some of the related alterations could participate in a vicious cycle limiting the recovery. Animal models mimicking various physiological alterations related to anorexia nervosa are necessary to provide better strategies of treatment.

Aim: To explore physiological alterations and recovery in a long-term mouse model mimicking numerous consequences of severe anorexia nervosa.

Methods: C57Bl/6 female mice were submitted to a separation-based anorexia protocol combining separation and time-restricted feeding for 10 weeks. Thereafter, mice were housed in standard conditions for 10 weeks. Body weight, food intake, body composition, plasma levels of leptin, adiponectin, IGF-1, blood levels of GH, reproductive function and glucose tolerance were followed. Gene expression of several markers of lipid and energy metabolism was assayed in adipose tissues.

Results: Mimicking what is observed in anorexia nervosa patients, and despite a food intake close to that of control mice, separation-based anorexia mice displayed marked alterations in body weight, fat mass, lean mass, bone mass acquisition, reproductive function, GH/IGF-1 axis, and leptinemia. mRNA levels of markers of lipogenesis, lipolysis, and the brown-like adipocyte lineage in subcutaneous adipose tissue were also changed. All these alterations were corrected during the recovery phase, except for the hypoleptinemia that persisted despite the full recovery of fat mass.

Conclusion: This study strongly supports the separation-based anorexia protocol as a valuable model of long-term negative energy balance state that closely mimics various symptoms observed in anorexia nervosa, including metabolic adaptations. Interestingly, during a recovery phase, mice showed a high capacity to normalize these parameters with the exception of plasma leptin levels. It will be interesting therefore to explore further the central and peripheral effects of the uncorrected hypoleptinemia during recovery from separation-based anorexia.


Conflict of interest statement

Competing Interests: The authors have declared that no competing interests exist.

Figures

Figure 1
Figure 1. Design of the study.
Forty mice were submitted to separation and time-restriction feeding (Separation-Based Anorexia, SBA). After 2 weeks, 10 mice were sacrificed. The others were kept in SBA conditions. 10 weeks after the beginning of the experiment, 10 mice were sacrificed and the 20 other mice were placed in standard conditions (Recovery, REC) during 2 or 10 more weeks, before sacrifice. Estrous cycles were followed all along the experiment. Forty other mice kept in standard housing conditions all along the experiment were studied and sacrificed according to the pattern used for SBA and REC mice.
Figure 2
Figure 2. Weight, food intake and body composition of mice submitted to a 2-week study.
Measures were performed on mice in standard conditions (CT), separated with food ad libitum (SEP), submitted to time-restricted feeding (TR) or separated and submitted to food access restriction (SBA). A: body weights were recorded daily before the eating period (beginning of the dark phase). B: Cumulative food intake was recorded for each group as the sum of the mean food intake per mouse from day 1 to day 15. C–E: Fat mass, lean mass and bone mineral content respectively were evaluated for each animal at day 0 and day 14, before food access. Data represent mean ± SEM; n = 6/group. In A, differences were tested by a 2-way Anova followed by a Bonferroni post-hoc test. SBA values are significantly different from CT values from day 1 to the end (**P<0.001). SBA values are significantly different from TR values from day 6 to the end ( P<0.05). TR values are significantly different from CT values from day 1 to the end (*p<0.05). In C, D, and E, *p<0.05 and **p<0.005 when compared to day 0 of the same group; p<0.05 and ‡‡ p<0.005 when compared to CT group at the same duration.
Figure 3
Figure 3. Weight, food intake and body composition of mice submitted to a 10-week SBA protocol followed by a 10-week recovery protocol (REC).
Measures were performed on mice in standard conditions (CT) or separated and submitted to food access restriction (SBA). A: body weights were recorded before the eating period (beginning of the dark phase). B: Cumulative food intake was recorded for each group as the sum of the mean food intake per mouse from day 1 to day 140. C–E: Fat mass, lean mass and bone mineral content respectively were evaluated for each animal at the beginning and after 2, 5 and 10 weeks of SBA protocol or after 10 weeks of SBA protocol followed by 2 or 10 weeks of housing in standard conditions. Data represent mean ± SEM; n = 6–10/group. In A, differences were tested by a 2-way Anova followed by a Bonferroni post-hoc test. SBA values are significantly different from CT values from day 1 to day 70 (*p<0.0001). In B, C, D and E, *p<0.05, **p<0.005, when compared to corresponding CT value; p<0.05, ‡‡ p<0.005 when compared to the previous value of the same group.
Figure 4
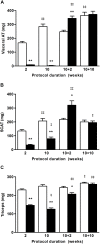
Figure 4. Weight evolution of visceral adipose tissue (AT), subcutaneous AT (SCAT) and triceps surae.
Soft tissues from control and SBA mice were weighted after 2 or 10 weeks of protocol or after 10 weeks of SBA protocol followed by 2 or 10 weeks of housing in standard conditions. A: perigonadal fat was used to estimate the visceral fat mass evolution. B: SCAT, which gathers inguinal AT and AT around the leg, was used to estimate the sub-cutaneous fat mass evolution. C: Triceps surae were weighted to determine the muscle mass evolution. *p<0.05 and **p<0.005 when compared to corresponding CT group; p<0.05 and ‡‡ p<0.005 when compared to the previous value of the same group.
Figure 5
Figure 5. Leptin and adiponectin.
A: Plasma concentrations of leptin and adiponectin of mice in standard conditions, CT(□), or separated and submitted to food access restriction, SBA(▪) after 2 and 10 weeks of protocol, followed by 2 and 10 weeks of standard housing conditions. B: Relative leptin and adiponectin mRNA levels in SCAT and VAT vs HPRT and PPIA housekeeping genes. Data represent mean ± SEM; n = 6–10/group. *p<0.05 and **p<0.005 when compared to CT group at the same duration; p<0.05 and ‡‡ p<0.05 when compared to the previous value of the same group.
Figure 6
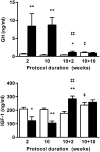
Figure 6. GH and IGF-1.
Whole blood GH levels and plasma IGF-1 levels were assayed on mice in standard conditions (CT), or separated and submitted to food access restriction (SBA) after 2 and 10 weeks of protocol, followed by 2 and 10 weeks of standard housing conditions. Data represent mean ± SEM; n = 6–10/group. *p<0.05 and **p<0.005 when compared to CT group at the same duration; p<0.05 and ‡‡ p<0.005 when compared to the previous value of the same group.
Figure 7
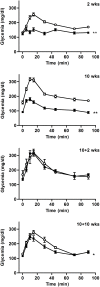
Figure 7. Intraperitoneal glucose tolerance test in mice in standard conditions (CT), or separated and submitted to time-restricted feeding (SBA) after 2 and 10 weeks of protocol, followed by 2 and 10 weeks of standard housing conditions.
Data represent mean ± SEM; n = 6–10/group. *p<0.05 and **p<0.0001 significant differences between the two curves using Two-way ANOVA.
Figure 8
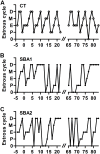
Figure 8. Estrous cycle alteration.
Estrous cycle determined according to the observation of the cell population of vaginal washes was daily followed on mice in standard conditions (CT), or separated and submitted to food access restriction (SBA) from day 0 to day 70, followed by 20 days of standard housing conditions. D = diestrus, M = metestrus, E = estrus, P = proestrus, 0 =  no cell observed. A: A representative example of estrous cycle of CT mice. B: A representative example of cycles observed in SBA mice, with the onset of long duration diestrus during the recovery period. C: A representative example of cycles observed in SBA mice, with the onset of estrus during the recovery period.
Figure 9
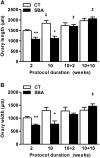
Figure 9. Alterations of reproduction.
Ovary size of mice in standard conditions (CT), or separated and submitted to food access restriction (SBA) after 2 and 10 weeks of protocol, followed by 2 and 10 weeks of standard housing conditions. A: Ovary length measured on ovary slices. B: Ovary width measured on ovary slices. Data represent mean ± SEM; n = 6/group. *p<0.05 and **p<0.005 when compared with CT group at the same duration; p<0.05 when compared with previous value of the same group.
Figure 10
Figure 10. Expression analysis in adipose tissues of genes involved in lipid metabolism.
Relative mRNA levels of Glut4, FASn, ABHD5 and ATGL were determined by real-time PCR experiments, in subcutaneous (SCAT) and visceral adipose tissues (VAT) of control □ and SBA ▪ mice. PPIA and HPRT were used as housekeeping genes. All results are expressed as fold-change compared to one SCAT of the control group after 10 weeks. Analyses were done after 10 weeks of SBA protocol and 10 additional weeks of REC protocol. Data represent mean ± SEM; n = 5–10/group. *p<0.05 and **p<0.005 when compared to CT group at the same duration; p<0.05 and ‡ ‡ p<0.005 when compared to the previous value of the same group.
Figure 11
Figure 11. Expression analysis in adipose tissues of genes involved in brown adipocyte phenotype.
Relative mRNA levels of UCP1, PGC1α, PRDM16 and ACOX1 were determined by real-time PCR experiments, in subcutaneous (SCAT) and visceral adipose tissues (VAT) of control □ and SBA ▪ mice. PPIA and HPRT were used as housekeeping genes. All results are expressed as fold-change compared to one SCAT of the control group after 10 weeks. Analyses were done after 10 weeks of SBA protocol and 10 additional weeks of REC protocol. Data represent mean ± SEM; n = 5–10/group. *p<0.05 and **p<0.005 when compared to CT group at the same duration; p<0.05 and ‡ ‡ p<0.005 when compared to the previous value of the same group.

References

    1. Hoek HW (2006) Incidence, prevalence and mortality of anorexia nervosa and other eating disorders. Curr Opin Psychiatry 19: 389–394. - PubMed
    1. Legroux-Gérot I, Vignau J, D’Herbomez M, Collier F, Marchandise X, et al. (2007) Evaluation of bone loss and mechanisms in anorexia nervosa. Calcif Tissue Int 81: 174–182. - PubMed
    1. Zipfel S, Seibel MJ, Löwe B, Beumont PJ, Kasperk C, et al. (2001) Osteoporosis in eating disorders: a follow-up study of patients with anorexia and bulimia nervosa. J Clin Endocrinol Metab 86: 5227–5233. - PubMed
    1. Faje AT, Fazeli PK, Miller KK, Katzman DK, Ebrahimi S, et al. (2014) Fracture risk and areal bone mineral density in adolescent females with anorexia nervosa. Int J Eat Disord doi:10.1002/eat.22248. - PMC - PubMed
    1. Legroux-Gérot I, Vignau J, Biver E, Pigny P, Collier F, et al. (2010) Anorexia nervosa, osteoporosis and circulating leptin: the missing link. Osteoporos Int 21: 1715–1722. - PubMed

Publication types

MeSH terms

LinkOut - more resources