

Global intravascular and local hyperoxia contrast phase-based blood oxygenation measurements
- PMID: 25091128
- PMCID: PMC4176654
- DOI: 10.1016/j.neuroimage.2014.07.050
Global intravascular and local hyperoxia contrast phase-based blood oxygenation measurements
Abstract
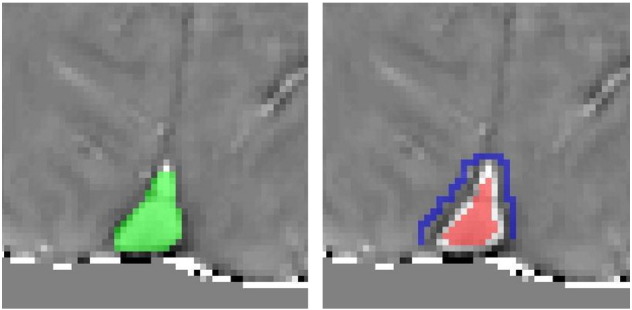
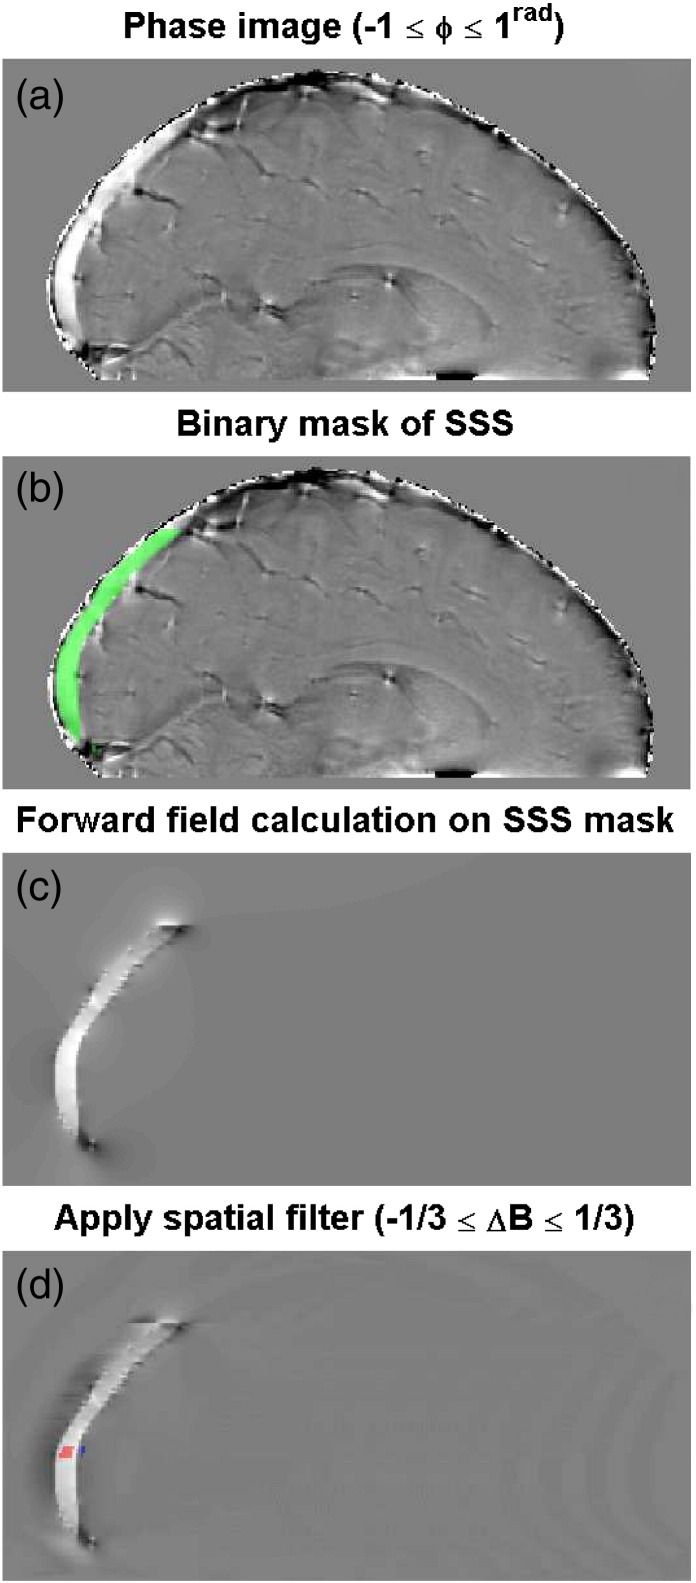
The measurement of venous cerebral blood oxygenation (Yv) has potential applications in the study of patient groups where oxygen extraction and/or metabolism are compromised. It is also useful for fMRI studies to assess the stimulus-induced changes in Yv, particularly since basal Yv partially accounts for inter-subject variation in the haemodynamic response to a stimulus. A range of MRI-based methods of measuring Yv have been developed recently. Here, we use a method based on the change in phase in the MR image arising from the field perturbation caused by deoxygenated haemoglobin in veins. We build on the existing phase based approach (Method I), where Yv is measured in a large vein (such as the superior sagittal sinus) based on the field shift inside the vein with assumptions as to the vein's shape and orientation. We demonstrate two novel modifications which address limitations of this method. The first modification (Method II), maps the actual form of the vein, rather than assume a given shape and orientation. The second modification (Method III) uses the intra and perivascular phase change in response to a known change in Yv on hyperoxia to measure normoxic Yv in smaller veins. Method III can be applied to veins whose shape, size and orientation are not accurately known, thus allowing more localised measures of venous oxygenation. Results demonstrate that the use of an overly fine spatial filter caused an overestimation in Yv for Method I, whilst the measurement of Yv using Method II was less sensitive to this bias, giving Yv = 0.62 ± 0.03. Method III was applied to mapping of Yv in local veins across the brain, yielding a distribution of values with a mode of Yv = 0.661 ± 0.008.
Keywords: Hyperoxia; MR susceptometry; MRI; Oxygen extraction fraction (OEF); Oxygen saturation; Phase imaging.
Copyright © 2014. Published by Elsevier Inc.
Figures


References
-
- Banzett R.B., Garcia R.T., Moosavi S.H. Simple contrivance “clamps” end-tidal PCO(2) and PO-2 despite rapid changes in ventilation. J. Appl. Physiol. 2000;88(5):1597–1600. - PubMed
-
- Baskurt O.K., Yalcin O., Gungor F., Meiselman H.J. Hemorheological parameters as determinants of myocardial tissue hematocrit values. Clin. Hemorheol. Microcirc. 2006;35(1–2):45–50. - PubMed
-
- Boxerman J.L., Hamberg L.M., Rosen B.R., Weisskoff R.M. MR contrast due to intravascular magnetic-susceptibility perturbations. Magn. Reson. Med. 1995;34(4):555–566. - PubMed
Publication types
MeSH terms
Substances
Grants and funding
LinkOut - more resources
Full Text Sources
Other Literature Sources
Medical
