. 2014 Aug 5;16(4):415.
doi: 10.1186/s13058-014-0415-9.

A joint analysis of metabolomics and genetics of breast cancer

A joint analysis of metabolomics and genetics of breast cancer

Xiaohu Tang et al. Breast Cancer Res. .

Abstract

Introduction: Remodeling of cellular metabolism appears to be a consequence and possibly a cause of oncogenic transformation in human cancers. Specific aspects of altered tumor metabolism may be amenable to therapeutic intervention and could be coordinated with other targeted therapies. In breast cancer, the genetic landscape has been defined most comprehensively in efforts such as The Cancer Genome Atlas (TCGA). However, little is known about how alterations of tumor metabolism correlate with this landscape.

Methods: In total 25 cancers (23 fully analyzed by TCGA) and 5 normal breast specimens were analyzed by gas chromatography/mass spectrometry and liquid chromatography/mass spectrometry, quantitating 399 identifiable metabolites.

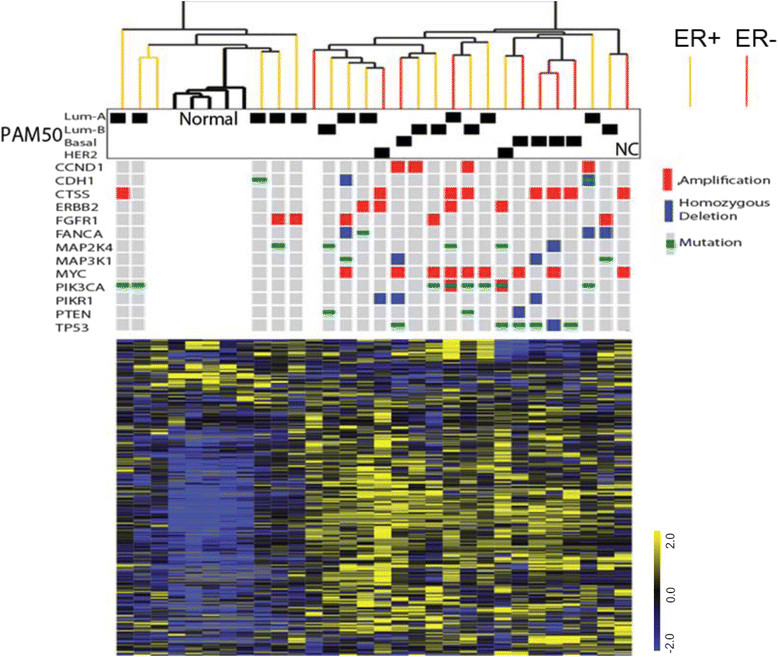
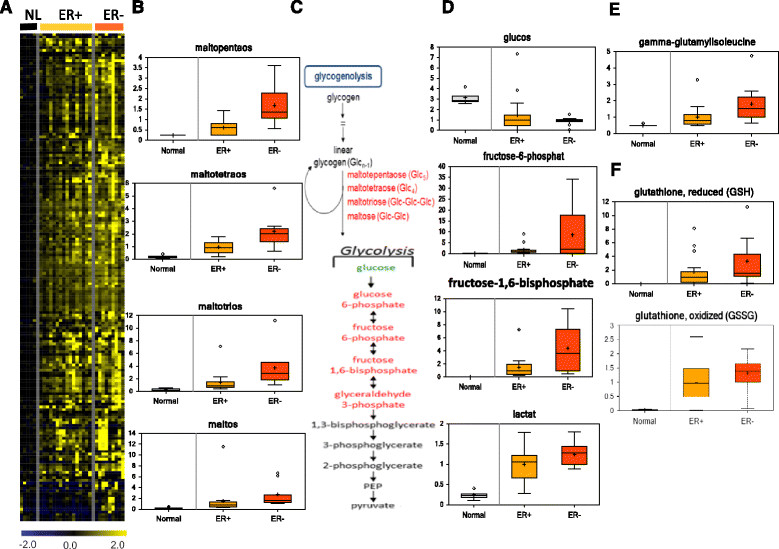
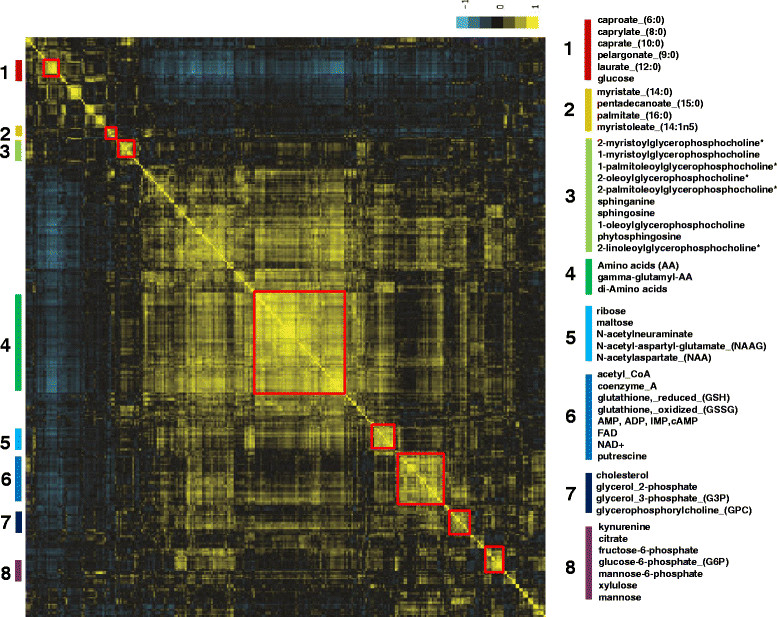
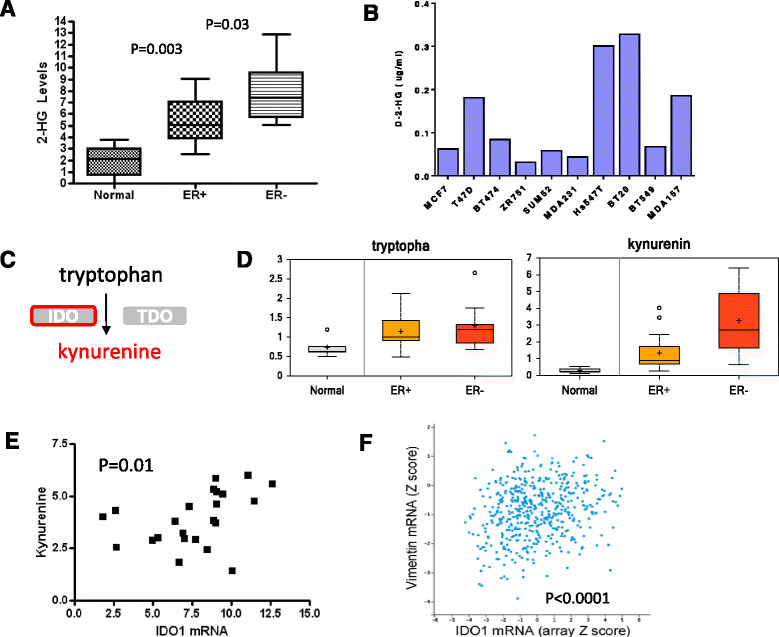
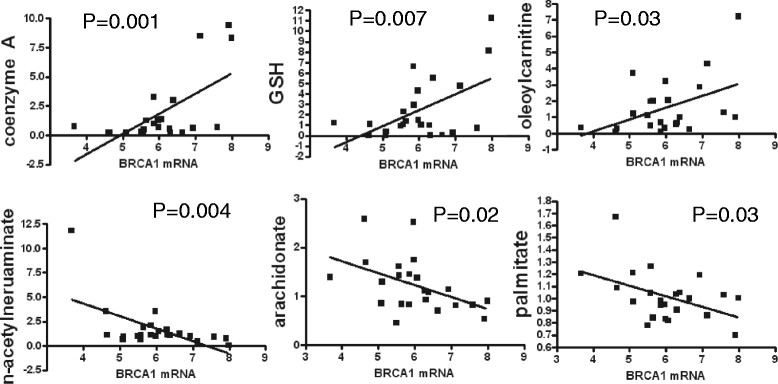
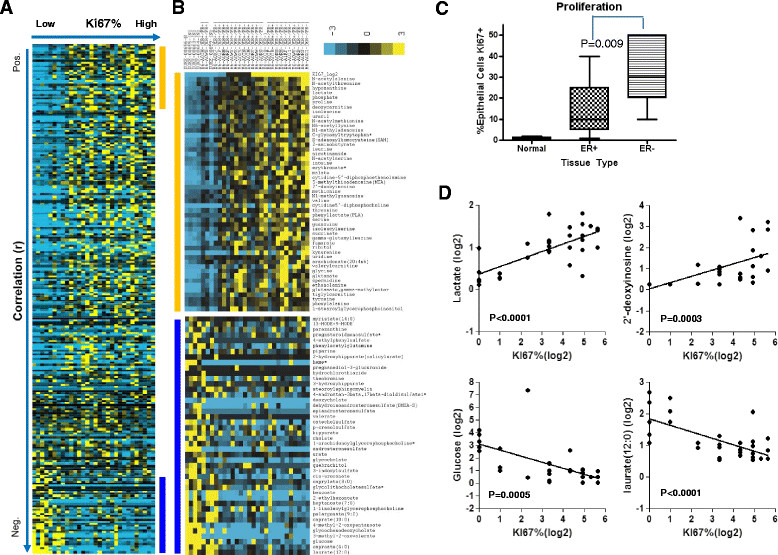
Results: We found strong differences correlated with hormone receptor status with 18% of the metabolites elevated in estrogen receptor negative (ER-) cancers compared to estrogen receptor positive (ER+) including many glycolytic and glycogenolytic intermediates consistent with increased Warburg effects. Glutathione (GSH) pathway components were also elevated in ER- tumors consistent with an increased requirement for handling higher levels of oxidative stress. Additionally, ER- tumors had high levels of the oncometabolite 2-hydroxyglutarate (2-HG) and the immunomodulatory tryptophan metabolite kynurenine. Kynurenine levels were correlated with the expression of tryptophan-degrading enzyme (IDO1). However, high levels of 2-HG were not associated with somatic mutations or expression levels of IDH1 or IDH2. BRCA1 mRNA levels were positively associated with coenzyme A, acetyl coenzyme A, and GSH and negatively associated with multiple lipid species, supporting the regulation of ACC1 and NRF2 by BRCA1. Different driver mutations were associated with distinct patterns of specific metabolites, such as lower levels of several lipid-glycerophosphocholines in tumors with mutated TP53. A strong metabolomic signature associated with proliferation rate was also observed; the metabolites in this signature overlap broadly with metabolites that define ER status as receptor status and proliferation rate were correlated.

Conclusions: The addition of metabolomic profiles to the public domain TCGA dataset provides an important new tool for discovery and hypothesis testing of the genetic regulation of tumor metabolism. Particular sets of metabolites may reveal insights into the metabolic dysregulation that underlie the heterogeneity of breast cancer.


Figures

Figure 1
Figure 1
Breast cancers (n = 25) and normal breast tissues (n = 5) were grouped by unsupervised hierarchical clustering of metabolite levels and overlaid with intrinsic subtype and status of the somatic mutations of genetic drivers. Normalized metabolite levels were mean-centered, selected based on at least two-fold changes in two samples and arranged by hierarchical clustering. The estrogen receptor (ER) status, intrinsic subtypes, and identified somatic mutations in the indicated genes are shown for 23 tumors which were characterized by The Cancer Genome Atlas (TCGA).
Figure 2
Figure 2
Supervised analysis of metabolites by estrogen receptor (ER) status. (A) Tumor-specific metabolites were zero-transformed against the mean of the five normal breast tumors, filtered and arranged by hierarchical clustering based on 16 ER + and 9 ER- tumors. (B-D) Significantly higher levels of metabolites in the glycogenolysis (B) and glycolysis (D) pathways, as shown in (C), were found in the ER- compared to ER + tumors. The names of elevated (labeled in red) and reduced (labeled in green) metabolites in the glycolysis (B) and glycogenolysis (D) pathways are shown in the metabolism diagram (C). Increased levels of gamma-glutamyl-isoleucine (E) and reduced (GSH) and oxidized (GSSG) glutathione (F) were also found. Primary data and P values for these comparisons can be found in Table S2 in Additional file 2 and Table S3 in Additional file 3.
Figure 3
Figure 3
Hierarchical clustering of metabolites based on correlation coefficients. The correlation coefficients were calculated using Pearson product-moment of each pair of metabolites (log base 2 normalized) among 399 metabolites from 25 breast cancers and 5 normal breast tissues. Eight clusters of highly correlated metabolites are highlighted on the right panel.
Figure 4
Figure 4
Specific metabolic/genetic associations. (A) The mean level of 2-hydroxyglutarate (2-HG) in 5 normal tissues, 16 estrogen receptor (ER) + and 9 ER- tumors. (B) The level of 2-HG in breast cancer cell lines (4 luminal type and 5 basal type cells). (C) Kynurenine is derived from tryptophan by indoleamine 2,3-dioxygenase (IDO) or tryptophan 2,3-dioxygenase (TDO) enzymatic activity. (D) The level of tryptophan and kynurenine in 5 normal tissues, 16 ER + and 9 ER- tumors. (E) The correlation between the level of kynurenine and IDO1 gene expression measured by RNAseq in 23 tumors analyzed by The Cancer Genome Atlas (TCGA). (F) The correlation between RNA expression of the mesenchymal/basal marker vimentin and IDO1 in TCGA breast cancers.
Figure 5
Figure 5
Correlation between selected metabolite levels and BRCA1 mRNA expression. Three representative metabolites (coenzyme A (CoA), reduced glutathione (GSH) and oleoyl-carnitine) that are positively and three (N-acetylneuraminate, arachidonate and palmitate) that are inversely correlated with BRCA1 mRNA levels from The Cancer Genome Atlas (TCGA) RNAseq data on 23 cancers are shown. The full list of metabolites correlated with BRCA1 is provided in Table S6 in Additional file 7 showing listing both normalized metabolite levels and metabolite levels with an additional log2 transformation to reduce the impact of outliers.
Figure 6
Figure 6
Proliferation rate is correlated with the level of many metabolites. (A) Supervised clustering of normalized metabolite levels as ordered by the proliferation rate (Ki-67%) (from low (left) to high (right)). (B) Zoomed views of the metabolites that are most positively (orange bar) or negatively (blue bar) correlated with proliferation. (C) Proliferation associated with receptor status and cancer status from the 30 samples in this study. (D) The correlation of representative metabolites positively or negatively associated with proliferation rate.

References

    1. Comprehensive molecular portraits of human breast tumours. Nature. 2012, 490: 61-70. 10.1038/nature11412. - PMC - PubMed
    1. Levine AJ, Puzio-Kuter AM. The control of the metabolic switch in cancers by oncogenes and tumor suppressor genes. Science. 2010;330:1340–1344. doi: 10.1126/science.1193494. - DOI - PubMed
    1. Reitman ZJ, Jin G, Karoly ED, Spasojevic I, Yang J, Kinzler KW, He Y, Bigner DD, Vogelstein B, Yan H. Profiling the effects of isocitrate dehydrogenase 1 and 2 mutations on the cellular metabolome. Proc Natl Acad Sci U S A. 2011;108:3270–3275. doi: 10.1073/pnas.1019393108. - DOI - PMC - PubMed
    1. Yuneva MO, Fan TW, Allen TD, Higashi RM, Ferraris DV, Tsukamoto T, Mates JM, Alonso FJ, Wang C, Seo Y, Chen X, Bishop JM. The metabolic profile of tumors depends on both the responsible genetic lesion and tissue type. Cell Metab. 2012;15:157–170. doi: 10.1016/j.cmet.2011.12.015. - DOI - PMC - PubMed
    1. Maddocks OD, Berkers CR, Mason SM, Zheng L, Blyth K, Gottlieb E, Vousden KH. Serine starvation induces stress and p53-dependent metabolic remodelling in cancer cells. Nature. 2013;493:542–546. doi: 10.1038/nature11743. - DOI - PMC - PubMed

Publication types