

Retinal microangiopathy in a mouse model of inducible mural cell loss
- PMID: 25092275
- PMCID: PMC4715212
- DOI: 10.1016/j.ajpath.2014.06.011
Retinal microangiopathy in a mouse model of inducible mural cell loss
Abstract
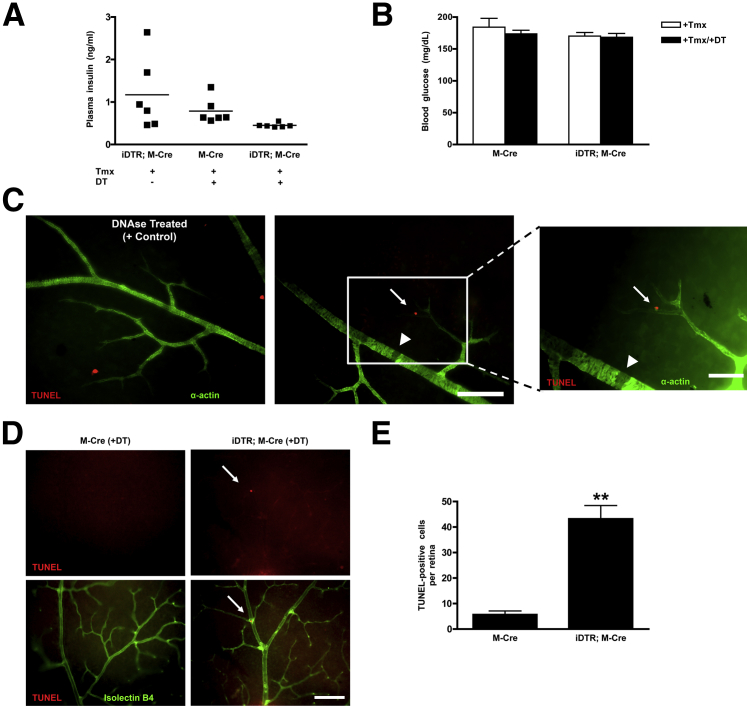
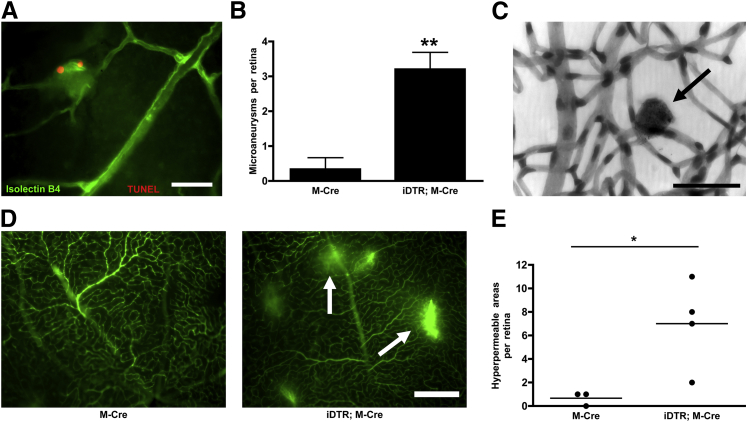
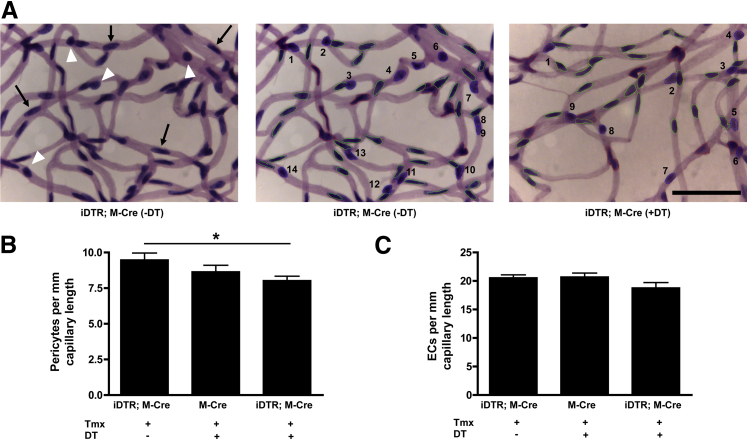
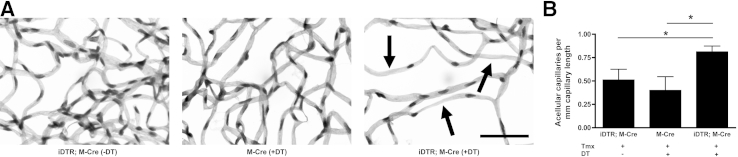
Diabetes can lead to vision loss because of progressive degeneration of the neurovascular unit in the retina, a condition known as diabetic retinopathy. In its early stages, the pathology is characterized by microangiopathies, including microaneurysms, microhemorrhages, and nerve layer infarcts known as cotton-wool spots. Analyses of postmortem human retinal tissue and retinas from animal models indicate that degeneration of the pericytes, which constitute the outer layer of capillaries, is an early event in diabetic retinopathy; however, the relative contribution of specific cellular components to the pathobiology of diabetic retinopathy remains to be defined. We investigated the phenotypic consequences of pericyte death on retinal microvascular integrity by using nondiabetic mice conditionally expressing a diphtheria toxin receptor in mural cells. Five days after administering diphtheria toxin in these adult mice, changes were observed in the retinal vasculature that were similar to those observed in diabetes, including microaneurysms and increased vascular permeability, suggesting that pericyte cell loss is sufficient to trigger retinal microvascular degeneration. Therapies aimed at preventing or delaying pericyte dropout may avoid or attenuate the retinal microangiopathy associated with diabetes.
Copyright © 2014 American Society for Investigative Pathology. Published by Elsevier Inc. All rights reserved.
Figures
Similar articles
-
Retinal capillary pericyte apoptosis in early human diabetic retinopathy.Chin Med J (Engl). 1997 Sep;110(9):659-63. Chin Med J (Engl). 1997. PMID: 9642318
-
Endothelium-specific platelet-derived growth factor-B ablation mimics diabetic retinopathy.EMBO J. 2002 Aug 15;21(16):4307-16. doi: 10.1093/emboj/cdf418. EMBO J. 2002. PMID: 12169633 Free PMC article.
-
Pericytes and the pathogenesis of diabetic retinopathy.Diabetes. 2002 Oct;51(10):3107-12. doi: 10.2337/diabetes.51.10.3107. Diabetes. 2002. PMID: 12351455
-
Pericytes and the pathogenesis of diabetic retinopathy.Horm Metab Res. 2005 Apr;37 Suppl 1:39-43. doi: 10.1055/s-2005-861361. Horm Metab Res. 2005. PMID: 15918109 Review.
-
Histopathology of diabetic retinopathy in man.Eye (Lond). 1993;7 ( Pt 2):250-3. doi: 10.1038/eye.1993.58. Eye (Lond). 1993. PMID: 7607344 Review.
Cited by
-
Assessment of Macular Peripapillary Nerve Fiber Layer and Choroidal Thickness Changes in Pregnant Women with Gestational Diabetes Mellitus, Healthy Pregnant Women, and Healthy Non-Pregnant Women.Med Sci Monit. 2015 Jun 18;21:1759-64. doi: 10.12659/MSM.893221. Med Sci Monit. 2015. PMID: 26084958 Free PMC article.
-
Characterization of Retinal Microvascular Complications and the Effects of Endoplasmic Reticulum Stress in Mouse Models of Diabetic Atherosclerosis.Invest Ophthalmol Vis Sci. 2020 Aug 3;61(10):49. doi: 10.1167/iovs.61.10.49. Invest Ophthalmol Vis Sci. 2020. PMID: 32852545 Free PMC article.
-
VEGFR1 signaling in retinal angiogenesis and microinflammation.Prog Retin Eye Res. 2021 Sep;84:100954. doi: 10.1016/j.preteyeres.2021.100954. Epub 2021 Feb 25. Prog Retin Eye Res. 2021. PMID: 33640465 Free PMC article. Review.
-
Characterization of cells from patient-derived fibrovascular membranes in proliferative diabetic retinopathy.Mol Vis. 2015 Jun 12;21:673-87. eCollection 2015. Mol Vis. 2015. PMID: 26120272 Free PMC article.
-
Ablation of Pericyte-Like Cells in Lungs by Oropharyngeal Aspiration of Diphtheria Toxin.Am J Respir Cell Mol Biol. 2017 Feb;56(2):160-167. doi: 10.1165/rcmb.2016-0083MA. Am J Respir Cell Mol Biol. 2017. PMID: 27779900 Free PMC article.
References
-
- Roy M.S., Klein R., O'Colmain B.J., Klein B.E., Moss S.E., Kempen J.H. The prevalence of diabetic retinopathy among adult type 1 diabetic persons in the United States. Arch Ophthalmol. 2004;122:546–551. - PubMed
-
- Cheung N., Mitchell P., Wong T.Y. Diabetic retinopathy. Lancet. 2010;376:124–136. - PubMed
-
- Cogan D.G. Diabetic retinopathy. N Engl J Med. 1964;270:787–788. - PubMed
-
- Antonetti D.A., Klein R., Gardner T.W. Diabetic retinopathy. N Engl J Med. 2012;366:1227–1239. - PubMed
Publication types
MeSH terms
Grants and funding
LinkOut - more resources
Full Text Sources
Other Literature Sources
Medical
Molecular Biology Databases
