. 2014 Sep 19;289(38):26314-26326.
doi: 10.1074/jbc.M114.568253. Epub 2014 Aug 4.

Translationally controlled tumor protein is a novel biological target for neurofibromatosis type 1-associated tumors

Affiliations

Translationally controlled tumor protein is a novel biological target for neurofibromatosis type 1-associated tumors

Daiki Kobayashi et al. J Biol Chem. .

Abstract

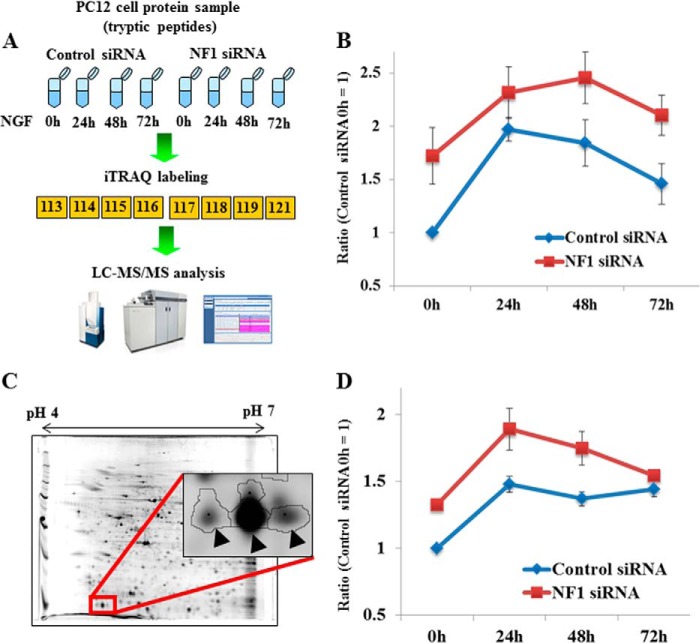
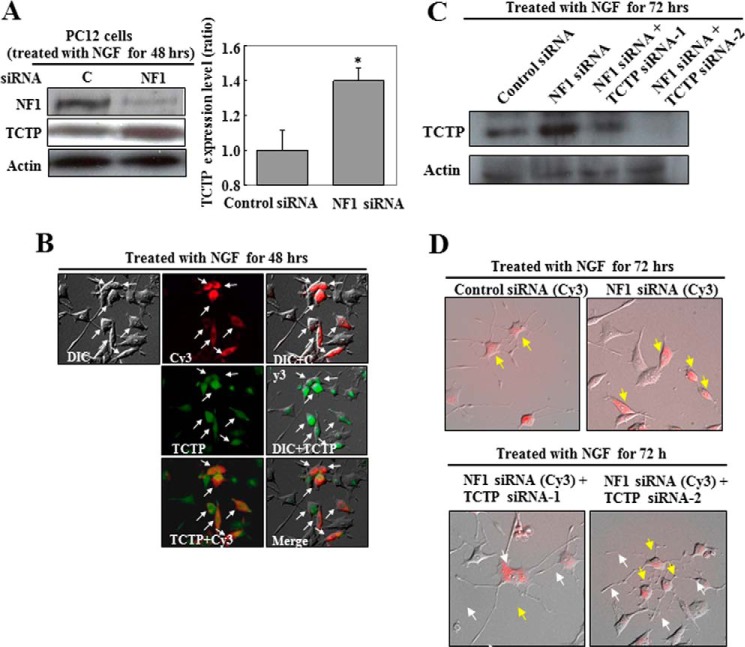
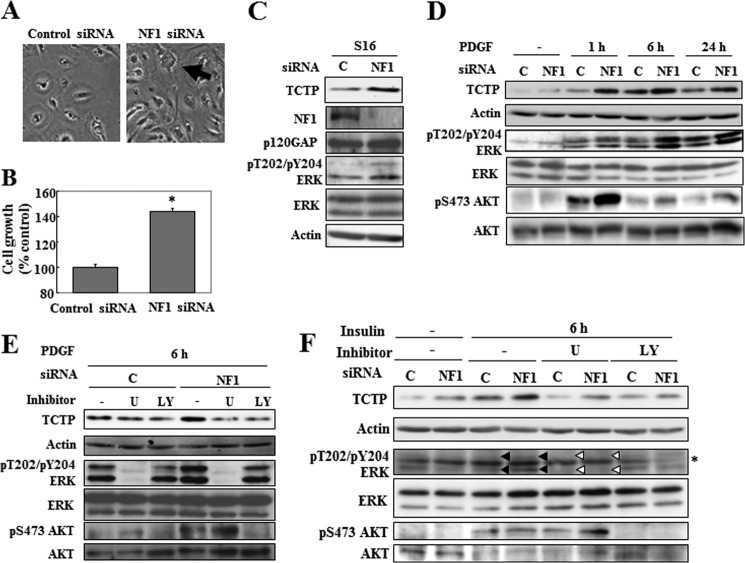
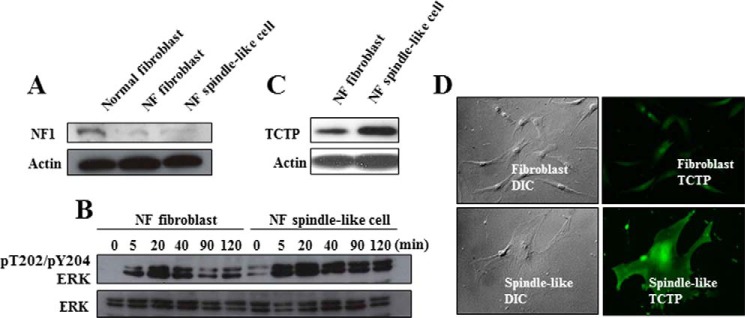
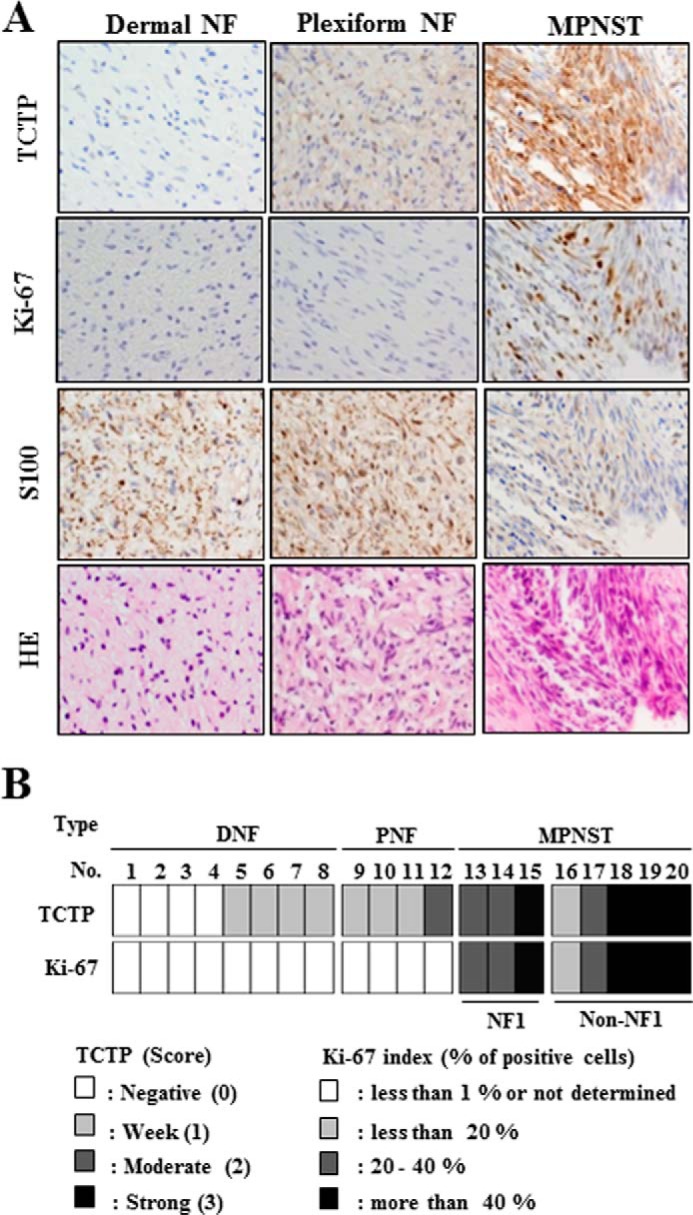
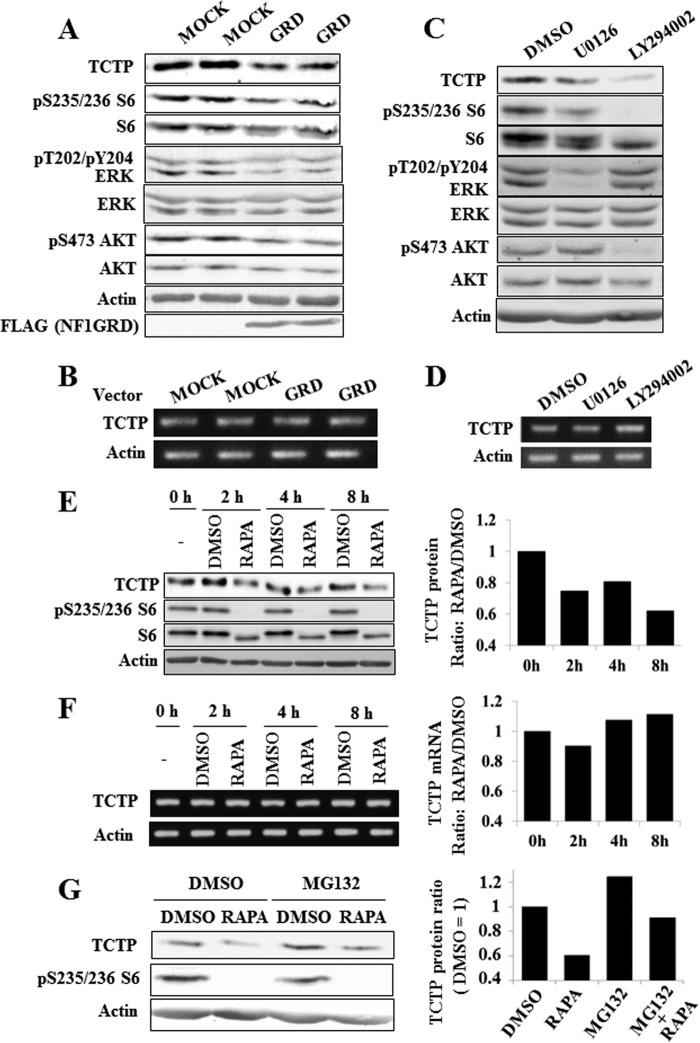
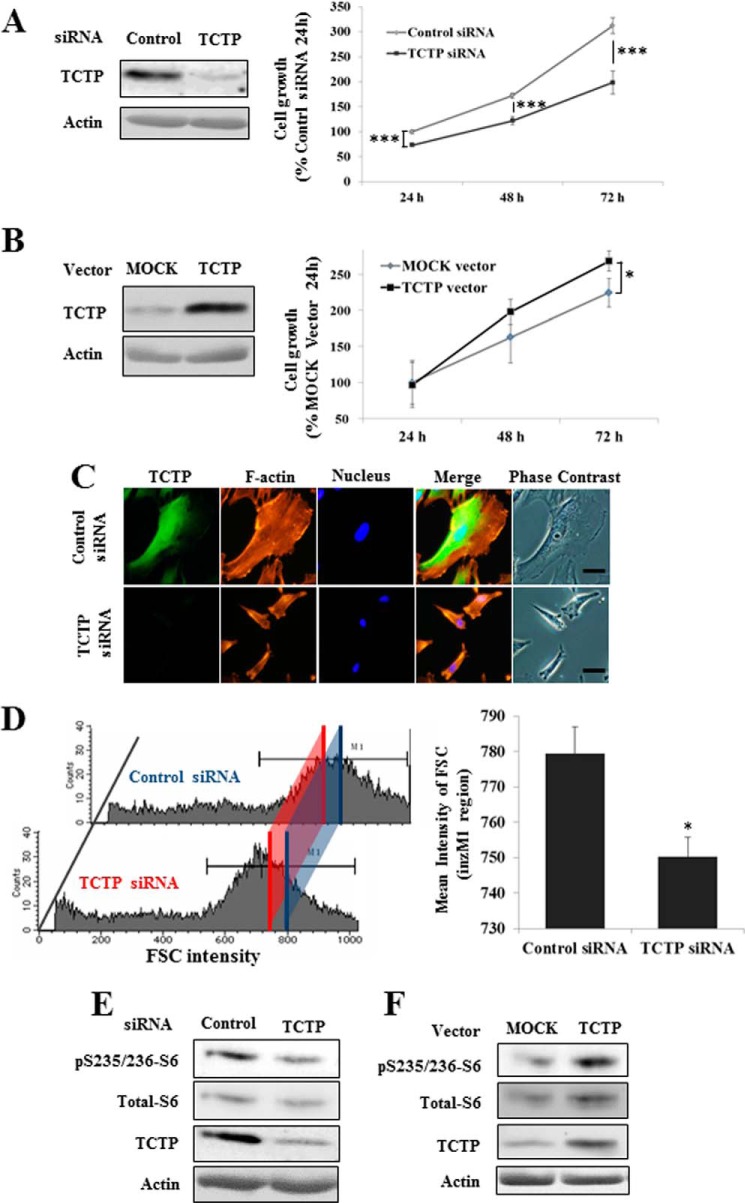
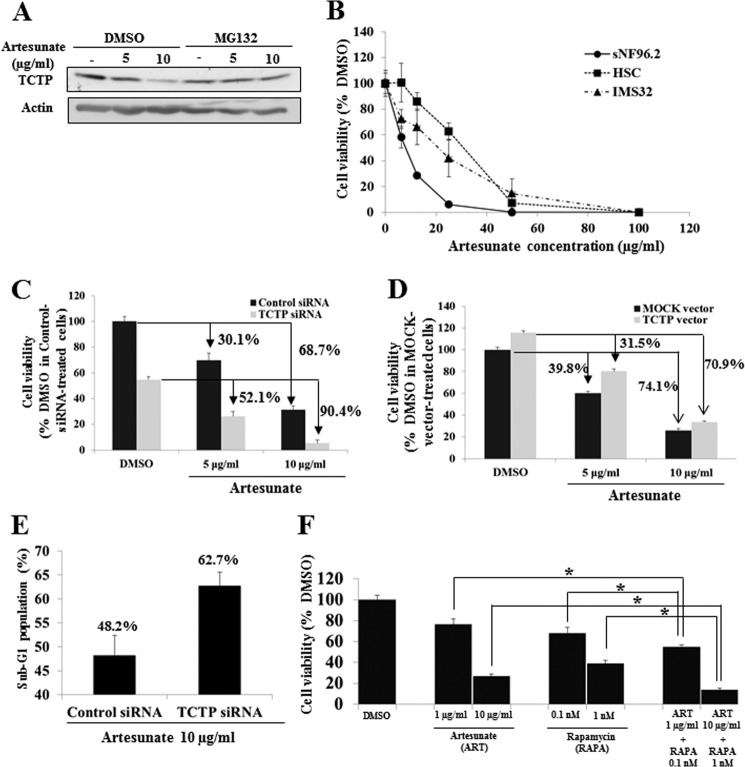
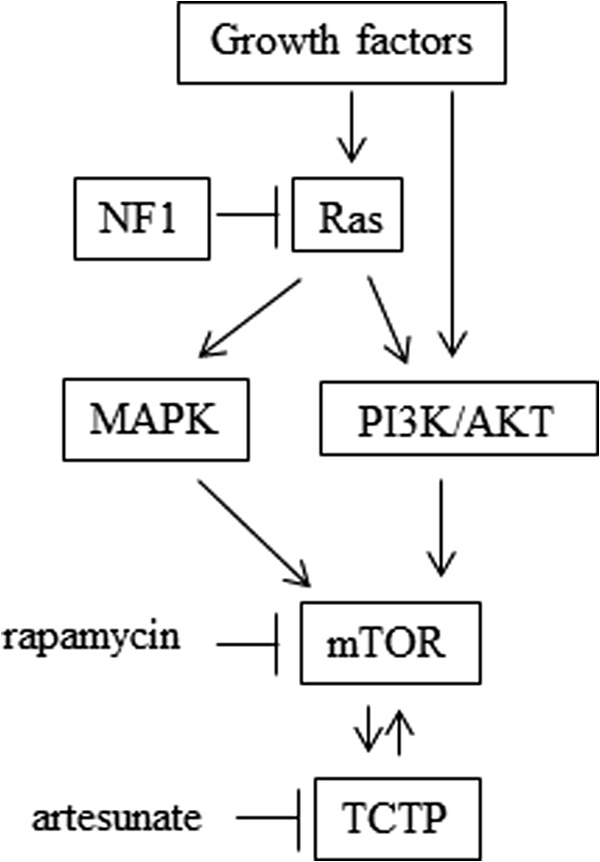
Neurofibromatosis type 1 (NF1) is an autosomal dominant disease that predisposes individuals to develop benign neurofibromas and malignant peripheral nerve sheath tumors (MPNSTs). Due to the lack of information on the molecular mechanism of NF1-associated tumor pathogenesis or biomarkers/therapeutic targets, an effective treatment for NF1 tumors has not been established. In this study, the novel NF1-associated protein, translationally controlled tumor protein (TCTP), was identified by integrated proteomics and found to be up-regulated via activated MAPK/PI3K-AKT signaling in response to growth factors in NF1-deficient Schwann cells. Immunohistochemical analysis of NF1-associated tumors revealed that the TCTP expression level correlated with tumorigenicity. In NF1-deficient MPNST cells, TCTP protein but not mRNA was down-regulated by NF1 GTPase-activating protein-related domain or MAPK/PI3K inhibitors, and this correlated with suppression of mammalian target of rapamycin (mTOR) signaling. mTOR inhibition by rapamycin also down-regulated TCTP protein expression, whereas knockdown or overexpression of TCTP suppressed or activated mTOR signaling, respectively, and affected cell viability. These results suggest that a positive feedback loop between TCTP and mTOR contributes to NF1-associated tumor formation. Last, the anti-tumor effect of artesunate, which binds to and degrades TCTP, was evaluated. Artesunate significantly suppressed the viability of MPNST cells but not normal Schwann cells, and the TCTP level inversely correlated with artesunate sensitivity. Moreover, combinational use of artesunate and rapamycin enhanced the cytotoxic effect on MPNST cells. These findings suggest that TCTP is functionally implicated in the progression of NF1-associated tumors and could serve as a biological target for their therapy.

Keywords: Malignant Peripheral Nerve Sheath Tumors (MPNST); Neurofibroma; Neurofibromatosis Type 1 (NF1); Proteomics; Translationally Controlled Tumor Protein (TCTP); Tumor Marker; Tumor Suppressor Gene; Tumor Therapy; mTOR.


Figures

FIGURE 1.
FIGURE 1.
Quantitative time course analysis of TCTP expression in NF1-deficient PC12 cells stimulated with NGF by the integrated proteomics. A, overview of iTRAQ analysis. The cells were transfected with NF1 or control siRNA, cultured for 24 h, and then stimulated with NGF. Cell lysates were prepared at different time points, as indicated, and digested with trypsin. The tryptic peptides were labeled with 8-plex iTRAQ, and the iTRAQ method was applied. B, quantitative analysis of TCTP expression determined by iTRAQ. The ratios were calculated by the intensities of 8-plex iTRAQ ions obtained from spectra of TCTP-derived peptides. The intensities at 0 h (before NGF stimulation) in control cells were used as the standard (ratio = 1). Error bars, S.E. C, a representative image of a two-dimensional polyacrylamide gel of pH range 4–7 and a close-up view of TCTP protein spots (arrowheads). D, quantitative TCTP expression data from two-dimensional difference in gel electrophoresis analysis. The data show the average ratios calculated using the intensities of four TCTP protein spots. For all four spots, TCTP was significantly up-regulated by NF1 knockdown (6). The mean of the intensities at 0 h (before NGF stimulation) in control cells was used as the standard (ratio = 1). Error bars, S.E. The materials and methods were described in our previous report (6).
FIGURE 2.
FIGURE 2.
TCTP is up-regulated in NF1-deficient PC12 cells stimulated with NGF. PC12 cells were transfected with NF1 or control siRNA for 24 h and then treated with NGF for 48 h. A, cell lysates were analyzed by immunoblot to assess TCTP expression. Actin expression was assessed to ensure equal loading. The representative images reflect three independent experiments. C, control siRNA; NF1, NF1 siRNA-1. The TCTP expression levels in control siRNA-treated versus NF1 siRNA-treated PC12 cells from three separate experiments are shown in the histogram. The average ratio of the expression level in control siRNA-treated cells was used as the standard (ratio = 1). Error bars, S.D. *, p < 0.01 versus control siRNA treatment (Student's t test). B, cells treated with Cy3-labeled NF1 siRNA were fixed and exposed to antibodies directed against the indicated proteins, followed by detection with Alexa Fluor 488-labeled secondary antibodies. The differential interference contrast (DIC), Cy3, DIC + Cy3, DIC + TCTP, TCTP + Cy3, and merged images in the same field of PC12 cells are shown. C and D, knockdown of up-regulated TCTP recovered neurite formation in NF1-deficient PC12 cells stimulated with NGF. Cells were transfected with Cy3-labeled NF1 siRNA or Cy3-labeled control siRNA and one of two TCTP siRNAs for 24 h and then treated with NGF for 72 h. C, cell lysates were analyzed by immunoblot to assess the knockdown of TCTP expression. D, the merged DIC and Cy3 images show the phenotypes of PC12 cells treated with the indicated siRNAs. Yellow arrows, Cy3-positive cells; white arrows, neurites in NF1-deficient PC12 cells treated with TCTP siRNAs.
FIGURE 3.
FIGURE 3.
TCTP is up-regulated in response to growth factor stimulation in NF1-deficient cultured Schwann cells. A–C, rat S16 Schwann cells were transfected with NF1 or control siRNA and then cultured for 48 h. A, images of cells transfected with control siRNA and NF1 siRNA 1. The arrow shows the representative phenotype of S16 cells treated with NF1 siRNA. B, the viability of cells transfected with NF1 siRNA 1 was evaluated. The average viability of cells transfected with control siRNA was used as the standard (100%). The data are expressed as the means and S.D. (error bars) of three independent experiments (n = 3). *, p < 0.01 versus control siRNA treatment (Student's t test). C, cell lysates were analyzed by immunoblot to assess neurofibromin and TCTP expression levels and ERK phosphorylation status. Actin and p120GAP expression were assessed as loading controls for TCTP and neurofibromin expression, respectively. C, control siRNA; NF1, NF1 siRNA 1. D, rat S16 Schwann cells were transfected with NF1 or control siRNA and then cultured for 48 h. The cells were serum-starved for 16 h and stimulated with 20 ng/ml PDGF. Cell lysates were prepared at different time points, as indicated, and analyzed by immunoblot for TCTP expression and ERK and AKT phosphorylation status. The upper and lower arrows indicate the phosphorylated forms of p44 and p42 ERK, respectively. C, control siRNA; NF1, NF1 siRNA 1. E and F, rat S16 Schwann cells were transfected with NF1 or control siRNA and then cultured for 48 h. The cells were serum-starved for 16 h and then treated with the MEK inhibitor U0126 (U; 20 μm) or the PI3K inhibitor LY294002 (LY; 30 μm) for 30 min prior to stimulation with 20 ng/ml PDGF (E) and 200 nm insulin (F). Cell lysates were prepared at 6 h after PDGF or insulin stimulation, as indicated, and analyzed by immunoblot to assess TCTP expression. The representative images reflect three reproducible experiments. The black upper and lower arrowheads indicate the phosphorylated forms of p44 and p42 ERK, respectively. The white upper and lower arrowheads indicate the inhibition of the phosphorylation of p44 and p42 ERK by U0126. C, control siRNA; NF1, NF1 siRNA 1. The asterisk indicates nonspecific bands.
FIGURE 4.
FIGURE 4.
TCTP is up-regulated in neurofibroma-derived primary spindle-like tumor cells. Fibroblast-like cells and spindle-like cells were isolated from dermal neurofibroma. A, the expression level of neurofibromin was assessed by immunoblot analysis. Lysate from primary fibroblasts from the abdominal dermis of a non-NF1 patient was used as a positive control. B, the fibroblast-like and spindle-like cells were serum-starved for 16 h and then stimulated with 1% FBS. The ERK phosphorylation status was analyzed by immunoblot. C and D, TCTP expression in the two cell types was analyzed by immunoblotting and immunocytochemistry.
FIGURE 5.
FIGURE 5.
TCTP expression correlates with the malignancy of NF1-associated neurofibromas. A, representative images show the H&E staining and S100, TCTP, and Ki-67 immunostaining of NF1-associated dermal neurofibroma, plexiform neurofibroma, and MPNST at ×400 magnification. The dermal neurofibroma, plexiform neurofibroma, and MPNST tissues correspond to tissue sample numbers 1, 10, and 15 in B. B, immunohistochemical analysis in various types of neurofibroma. DNF, dermal neurofibroma; PNF, plexiform neurofibroma. TCTP expression was scored according to staining intensity (0, faint; 1, weak; 2, moderate; 3, strong).
FIGURE 6.
FIGURE 6.
Suppression of mTOR signaling down-regulates TCTP expression in MPNST cells. A and B, overexpression of NF1-GRD down-regulates TCTP expression at the protein level in an MPNST cell line. A, immunoblot images taken after treatment with NF1-GRD for 24 h. Down-regulation of TCTP and phosphorylated ERK, AKT, and ribosomal S6 protein was observed. B, RT-PCR analysis reveals that TCTP mRNA was not down-regulated in sNF96.2 cells transfected with the NF1-GRD vector. C and D, sNF96.2 cells were cultured for 16 h and then treated with the MEK inhibitor U0126 (20 μm) or the PI3K inhibitor LY294002 (10 μm). At 12 h after inhibitor treatment, cell lysates were prepared and analyzed by immunoblot to assess TCTP expression. The representative images reflect three reproducible experiments. D, RT-PCR analysis reveals that TCTP mRNA was not down-regulated in sNF96.2 cells treated with U0126 or LY294002. E, sNF96.2 cells were cultured for 24 h and then treated with 100 nm rapamycin. Cell lysates were prepared at different time points, as indicated, and analyzed by immunoblot to assess TCTP expression. F, RT-PCR analysis reveals that TCTP mRNA was not down-regulated in sNF96.2 cells treated with 100 nm rapamycin. G, down-regulation of TCTP by suppression of mTOR signaling is not due to proteasomal degradation. sNF96.2 cells were cultured for 24 h and then treated with 100 nm rapamycin and 1 μm MG132 for 8 h. Cell lysates were analyzed by immunoblot to assess TCTP expression.
FIGURE 7.
FIGURE 7.
TCTP positively regulates viability and mTOR activity in MPNST cells. A and C–E, knockdown of TCTP using siRNA suppresses the viability of an MPNST cell line. sNF96.2 MPNST cells were transfected with TCTP or control siRNA. A, the viability of cells transfected with TCTP siRNA was evaluated by a CCK-8 assay. The average viability of cells transfected with control siRNA for 24 h was used as the standard (100%). *, p < 0.05; ***, p < 0.001 versus control siRNA treatment (Student's t test). C, sNF96.2 cells were transfected with TCTP siRNA and cultured for 72 h. The cells were fixed, permeabilized, and immunostained with a TCTP antibody. Then F-actin and cell nuclei were stained with rhodamine-phalloidin and Hoechst 33342, respectively. Bars, 20 μm. D, measurement of the forward scatter (FSC) of sNF96.2 cells transfected with TCTP or control siRNA. The blue and red lines indicate the mean forward scatter in the M1 region in control siRNA-treated cells and in TCTP siRNA-treated cells, respectively (786.06 in control siRNA-treated cells and 744.60 in TCTP siRNA-treated cells) (left). The data in the bar graph represent the mean and S.D. (error bars) of measurements from three independent experiments (n = 3). *, p < 0.01 versus control siRNA treatment (Student's t test). E, immunoblot analysis after treatment with TCTP siRNA for 24 h. Down-regulation of TCTP was confirmed, and phosphorylated ribosomal S6 protein was also found to be down-regulated. B and F, overexpression of TCTP enhanced the viability of the MPNST cell line (B). The viability of cells transfected with the TCTP overexpression vector was evaluated by CCK-8 assay. The average viability of cells transfected with the mock vector for 24 h was used as the standard (100%). F, immunoblot analysis after treatment with the TCTP overexpression vector for 48 h. Up-regulation of TCTP was confirmed, and phosphorylated ribosomal S6 protein was found to be up-regulated.
FIGURE 8.
FIGURE 8.
Treatment with artesunate for the induction of MPNST cell death. A, immunoblot analysis after treatment with artesunate and proteasomal inhibitor MG132. The sNF96.2 cells were cultured for 24 h and then treated with artesunate (0, 5, or 10 μg/ml) with/without MG132 (1 μm) for 48 h. Cell lysates were prepared and analyzed by immunoblot to assess TCTP expression. B, comparison of viability of sNF96.2 and human and mouse normal Schwann cells (HSC and IMS32) treated with artesunate. Cell viability was evaluated by a CCK-8 assay. The average viability of cells treated with DMSO was used as the standard (100%). The data are expressed as the mean and S.D. (error bars) of four independent experiments (n = 4). C and D, evaluation of viability of TCTP-depleted or -overexpressing MPNST cells treated with artesunate. sNF96.2 cells were transfected with TCTP siRNA (C) or the TCTP overexpression vector (D) for 24 h and then treated with artesunate for 48 h. The average viability of DMSO-treated cells transfected with control siRNA (C) or the mock expression vector (D) was used as the standard (100%). The data are expressed as the mean and S.D. of four independent experiments (n = 4). The decreases in viability in response to artesunate are indicated (control siRNA, 30.1%; TCTP siRNA, 52.1%; mock vector, 39.8%; and TCTP vector, 31.5% in cells treated with 5 μg/ml artesunate; control siRNA, 68.7%; TCTP siRNA, 90.4%; mock vector, 74.1%; and TCTP vector, 70.9% in cells treated with 10 μg/ml artesunate). E, measurement of the sub-G1 population in TCTP-depleted MPNST cells treated with artesunate. sNF96.2 cells were transfected with TCTP siRNA and then treated with artesunate for 48 h. Sub-G1 cells were quantified by flow cytometry. The data are expressed as the means and S.D. of two independent experiments (n = 2). F, evaluation of the viability of MPNST cells treated with artesunate in combination with rapamycin. sNF96.2 cells were cultured for 24 h and then treated with artesunate (1 and 10 μg/ml), rapamycin (0.1 and 1 nm), 1 μg/ml artesunate plus 0.1 nm rapamycin, or 10 μg/ml artesunate plus 1 nm rapamycin for 48 h. The data are expressed as the means and S.D. of four independent experiments (n = 4). *, p < 0.01 versus control siRNA treatment (Student's t test).
FIGURE 9.
FIGURE 9.
The possible mechanism of TCTP induction and mTOR activation in NF1-associated tumors. In NF1-deficient MPNST cells or tissues, up-regulation of the TCTP protein was observed (Fig. 5), whereas when NF1-GRD was overexpressed to compensate for NF1 RAS-GAP function in the NF1-deficient MPNST cells, TCTP expression was down-regulated at the protein level but not at the mRNA level (Fig. 6, A and B). TCTP protein (but not mRNA) was also down-regulated by MAPK/PI3K inhibitors (Fig. 6, C and D) as well as by the mTOR inhibitor rapamycin (Fig. 6, E and F). Importantly, mTOR inhibition seemed to down-regulate TCTP translation in MPNST cells, because rapamycin had no effect on the expression of TCTP mRNA but down-regulated TCTP protein (Fig. 6, E and F). This effect may not be mediated by proteasomal degradation of TCTP (Fig. 6G). Conversely, TCTP knockdown suppressed mTOR/S6K/S6 signaling (Fig. 7E), which is activated by overexpression of TCTP (Fig. 7F). Taken together, these results indicate a positive feedback loop between TCTP induction and mTOR activation caused by NF1 deficiency in NF1-associated tumors. Therefore, combinational use of the TCTP inhibitor artesunate, which significantly degrades TCTP protein (Fig. 8A), and the mTOR inhibitor rapamycin, which down-regulates TCTP translation (Fig. 6, E–G), could be effective at inhibiting the proliferation of NF1-associated tumors (Fig. 8F).

Similar articles

Cited by

References

    1. Stephens K., Riccardi V. M., Rising M., Ng S., Green P., Collins F. S., Rediker K. S., Powers J. A., Parker C., Donis-Keller H. (1987) Linkage studies with chromosome 17 DNA markers in 45 neurofibromatosis 1 families. Genomics 1, 353–357 - PubMed
    1. Cawthon R. M., Weiss R., Xu G. F., Viskochil D., Culver M., Stevens J., Robertson M., Dunn D., Gesteland R., O'Connell P. (1990) A major segment of the neurofibromatosis type 1 gene: cDNA sequence, genomic structure, and point mutations. Cell 62, 193–201 - PubMed
    1. Costa R. M., Federov N. B., Kogan J. H., Murphy G. G., Stern J., Ohno M., Kucherlapati R., Jacks T., Silva A. J. (2002) Mechanism for the learning deficits in a mouse model of neurofibromatosis type 1. Nature 415, 526–530 - PubMed
    1. Yunoue S., Tokuo H., Fukunaga K., Feng L., Ozawa T., Nishi T., Kikuchi A., Hattori S., Kuratsu J., Saya H., Araki N. (2003) Neurofibromatosis type I tumor suppressor neurofibromin regulates neuronal differentiation via its GTPase-activating protein function toward Ras. J. Biol. Chem. 278, 26958–26969 - PubMed
    1. Patrakitkomjorn S., Kobayashi D., Morikawa T., Wilson M. M., Tsubota N., Irie A., Ozawa T., Aoki M., Arimura N., Kaibuchi K., Saya H., Araki N. (2008) Neurofibromatosis type 1 (NF1) tumor suppressor, neurofibromin, regulates the neuronal differentiation of PC12 cells via its associating protein, CRMP-2. J. Biol. Chem. 283, 9399–9413 - PubMed

Publication types

MeSH terms