. 2014 Aug 19;111(33):E3395-404.
doi: 10.1073/pnas.1412897111. Epub 2014 Aug 4.

Protective hinge in insulin opens to enable its receptor engagement

Affiliations

Protective hinge in insulin opens to enable its receptor engagement

John G Menting et al. Proc Natl Acad Sci U S A. .

Abstract

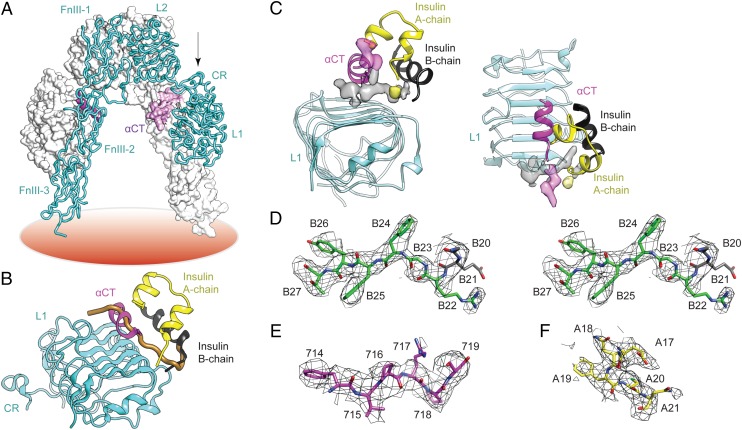
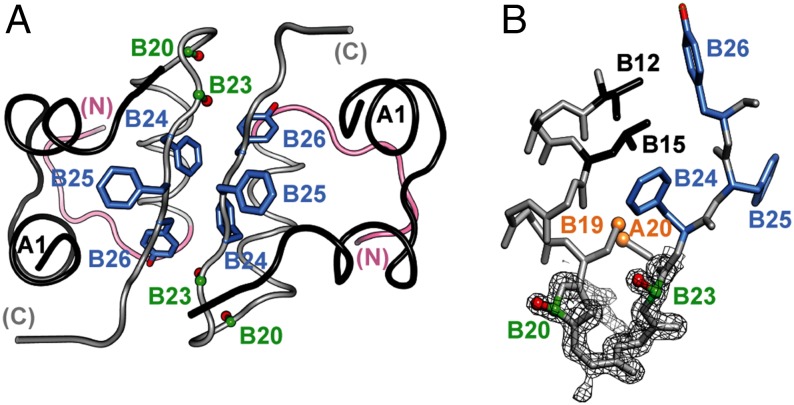
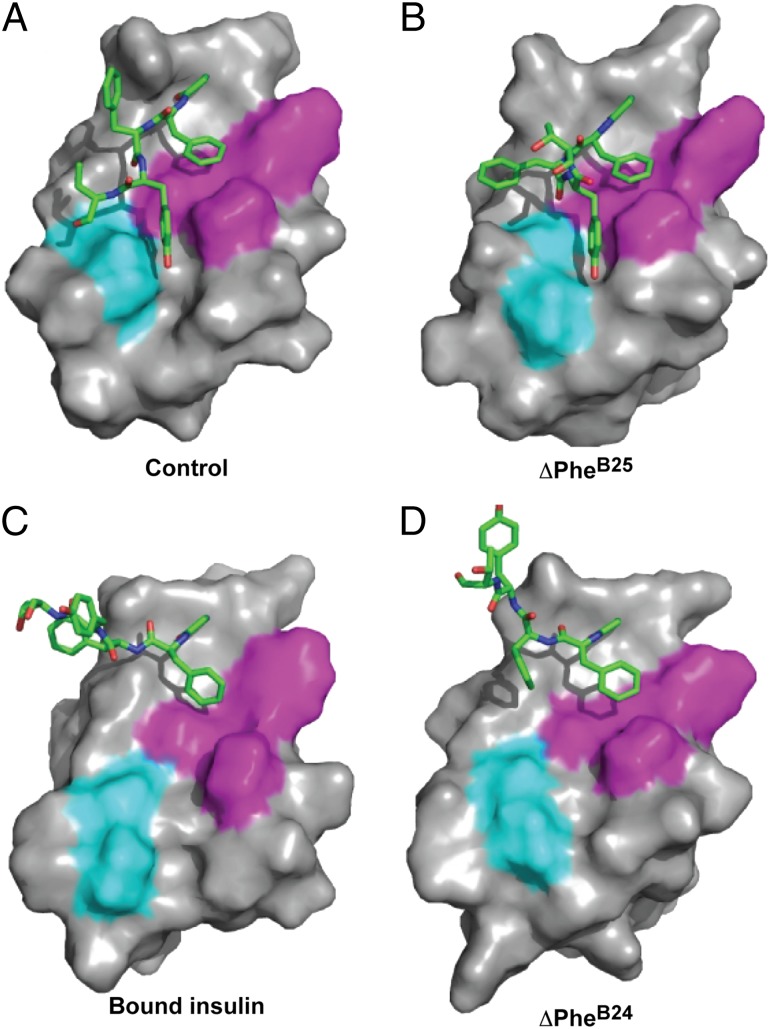
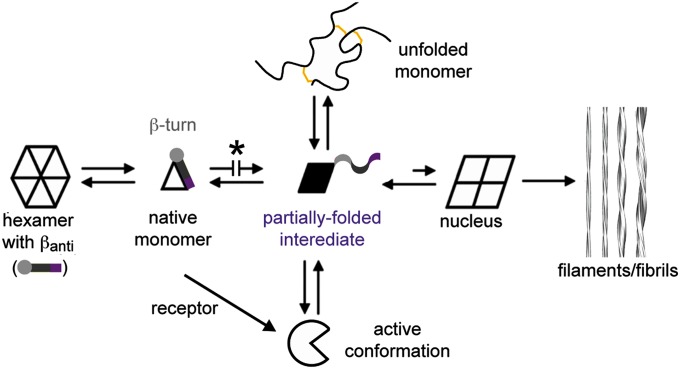
Insulin provides a classical model of a globular protein, yet how the hormone changes conformation to engage its receptor has long been enigmatic. Interest has focused on the C-terminal B-chain segment, critical for protective self-assembly in β cells and receptor binding at target tissues. Insight may be obtained from truncated "microreceptors" that reconstitute the primary hormone-binding site (α-subunit domains L1 and αCT). We demonstrate that, on microreceptor binding, this segment undergoes concerted hinge-like rotation at its B20-B23 β-turn, coupling reorientation of Phe(B24) to a 60° rotation of the B25-B28 β-strand away from the hormone core to lie antiparallel to the receptor's L1-β2 sheet. Opening of this hinge enables conserved nonpolar side chains (Ile(A2), Val(A3), Val(B12), Phe(B24), and Phe(B25)) to engage the receptor. Restraining the hinge by nonstandard mutagenesis preserves native folding but blocks receptor binding, whereas its engineered opening maintains activity at the price of protein instability and nonnative aggregation. Our findings rationalize properties of clinical mutations in the insulin family and provide a previously unidentified foundation for designing therapeutic analogs. We envisage that a switch between free and receptor-bound conformations of insulin evolved as a solution to conflicting structural determinants of biosynthesis and function.

Keywords: diabetes mellitus; metabolism; protein structure; receptor tyrosine kinase; signal transduction.


Conflict of interest statement

Conflict of interest statement: F.I.-B. and M.A.W. hold stock in Thermalin Diabetes, LLC (Cleveland, OH), for which N.B.P. and J.W. are consultants; M.A.W. is Chief Scientific Officer and a Director. Part of M.C.L.'s research is funded by Sanofi (Germany).

Figures

Fig. 1.
Fig. 1.
Insulin B-chain C-terminal β-strand in the μIR complex. (A) Structure of apo-receptor ectodomain. One monomer is in tube representation (labeled), the second is in surface representation. L1, first leucine-rich repeat domain; CR, cysteine-rich domain; L2, second leucine-rich repeat domain; FnIII-1, -2 and -3; first, second and third fibronectin type III domains, respectively; αCT, α-subunit C-terminal segment; coral disk, plasma membrane. (B) Insulin bound to μIR; the view direction with respect to L1 in the apo-ectodomain is indicated by the arrow in A. Only B-chain residues indicated in black were originally resolved (11). The brown tube indicates classical location of residues B20-B30 in free insulin, occluded in the complex by αCT. (C) Orthogonal views of unmodeled 2Fobs-Fcalc difference electron density (SI Appendix), indicating association of map segments with the αCT C-terminal extension (transparent magenta), insulin B-chain C-terminal segment (transparent gray), and AsnA21 (transparent yellow). Difference density is sharpened (Bsharp = −160 Å2). (D–F) Refined models of respective segments insulin B20–B27, αCT 714–719, and insulin A17-A21 within postrefinement 2Fobs-Fcalc difference electron density (Bsharp = −160 Å2). D is in stereo.
Fig. 2.
Fig. 2.
Structure of ∆Phe. (A and B) Respective line drawings of E and Z configurational isomers of (α,β)-dehydro-Phe. The present studies use the more stable Z isomer (23).
Fig. 3.
Fig. 3.
TROSY NMR analysis of unlabeled L1–CR fragment of the receptor α-subunit (construct IR310.T) complexed with labeled KP-porcine insulin and labeled αCT peptide (complex 1). [1H-13C]-TROSY spectrum of selected aromatic ring resonances in the μIR complex (black) is shown relative to [1H-13C] HSQC spectra of KP-porcine insulin (red) and free αCT (blue). Labeled aromatic sites in the insulin analog were PheB24 and TyrB26; labeled aromatic sites in αCT were Tyr708 and Phe714 as indicated. The characteristic upfield secondary chemical shifts of PheB24 and TyrB26 in free insulin are attenuated in the complex. For aliphatic [1H-13C] HSQC spectra, see SI Appendix, Fig. S3.
Fig. 4.
Fig. 4.
Structural change in the B-chain C-terminal segment on μIR engagement. (A) Overlay of the B-chain of free insulin onto the μIR complex. Brown, B1–B30 conformation in free insulin; black, B7–B19 conformation of μIR-bound insulin; green, B20–B27 conformation of μIR-bound insulin; yellow, A-chain conformation of μIR-bound insulin; magenta, αCT segment. In the μIR complex, αCT side chains His710 and Phe714 fill a volume occupied by TyrB26 in free insulin; the location of the PheB24 side chain is approximately maintained by rotameric change. (B and C) Environments of PheB24 (B) and residues B25–B27 (C) in the μIR complex. Colors are as in A, with the L1 domain in cyan. (D) Dissection of the hinge-like opening of residues B20–B30 into a ∼10° rotation of B20–B30 about B20 followed by a ∼50° rotation of B24–B30 about B24. Brown, B20–B30 conformation in free insulin; black/green, B-chain conformation in μIR complex; blue, intermediate conformation illustrating ∼10° rotation of the B20–B23 β-turn. (E) Packing of residues B20–B27 between αCT and L1–β2 sheet surfaces (C, green; N, blue; O, red). Black, residues B8–B19; yellow, insulin A chain. Contact surfaces of αCT with B24–B26 are highlighted in magenta, and those of L1 with B24–B26 in cyan; surfaces not abutting B24–B26 are in lighter shades. Main- and side-chain surfaces of Val715 are labeled M and S. (F) Orthogonal view to E, showing interactions of PheB24 side chain with nonpolar surface of L1–β2 sheet and those of conserved residues A1–A3 with αCT.
Fig. 5.
Fig. 5.
Structure of analog 1. (A) Ribbon model of zinc-free dimer showing residues d-AlaB20 and d-AlaB23 in each protomer in red (side chain methyl groups) and green (Cα atoms). Side chains of PheB24, PheB25, and TyrB26 (and their dimer-related mates) are shown in blue. B-chain ribbons are pink (residues B1–B8) or light gray (B9–B30); A chains are black. (B) Expanded view of residues B12–B26, overlaid with weighted 2Fobs-Fcalc difference electron density. The sulfur atoms of cystine B19-A20 are shown in gold; the coloring scheme is otherwise as in A.
Fig. 6.
Fig. 6.
NMR studies of ∆Phe insulin analogs. (A) Baseline NOESY spectrum of KP-insulin. Cross-peak (ω1, ω2) assignments are (a) LeuB15 δ1-CH3/PheB24 Hδ, (b) LeuB15 δ1-CH3/PheB24 Hε, (c) LeuB15 δ1-CH3/PheB24 Hζ, (d) LeuB15 δ1-CH3/TyrB26 Hε, (e) LeuB15 δ1-CH3/TyrB26 Hδ, and (f) LeuB15 δ1-CH3/TyrA19 Hδ. *B15-δ1-CH3/B25 Hδ. (B) Solution structure of parent DKP-insulin (PDB ID code 2JMN). (C) NOESY spectrum of ∆PheB25-KP-insulin. Peak assignments are as labeled in A. (D) Superposition of 20 DG/RMD structures of ∆PheB25-DKP-insulin. In each case the A chain is shown in yellow, residues B1–B20 in orange, and B-chain segment B21–B30 in dark brown. Selected side chains are labeled. (E) NOESY spectrum of ∆PheB24-KP-insulin. Red box indicates upfield region of NOESY spectrum in which contacts from the native A19, B24, and B26 aromatic rings to the methyl resonances of LeuB15 δ1,2-CH3 are ordinarily observed due to ring-current effects; such upfield-shifted methyl resonances are absent in spectra of the ∆PheB24 analog. (F) Models of ∆PheB24-DKP-insulin. NOESY spectra in AC were acquired at 25 °C with a mixing time of 200 ms.
Fig. 7.
Fig. 7.
Solution structure of analog 2 superposed on the μIR complex. Yellow, insulin A chain; black, insulin residues B1–B20; brown, B21–B24; gray, B27–B30; magenta, αCT; cyan, L1 domain. Side-chain atoms are shown for αCT residues His-710 and Phe-714 (magenta), ∆PheB25 (dark pink, space-filling), and TyrB26 (light green, space-filling). Conformational restriction by ∆PheB25 predicts steric clashes (see main text).
Fig. 8.
Fig. 8.
Orientation of B23–B27 segments in free insulin analogs. The closed B-chain conformation in DKP-insulin (A) is recapitulated in the inactive constrained conformation of ∆PheB25-DKP-insulin (B). The open conformation observed in the μIR complex (C) is in accordance with molecular models of the active but less stable ∆PheB24 analog (D). Green, B23–B27 segment; magenta, the insulin internal contact surface of PheB24 (which includes ValB12, LeuB15, TyrB16, and CysB19; TyrB26 also packs against ValB12); cyan, additional contact surface of TyrB26 with A-chain residues IleA2 and ValA3. The latter nonpolar side chains are exposed in C and D and so poised to engage αCT on receptor binding.
Fig. 9.
Fig. 9.
Mechanism of insulin fibrillation via partial unfolding. The native state is protected by classical self-assembly (far left), mediated in part by an anti-parallel β-sheet (βanti) at the dimer interfaces of the hexamer. C-terminal segment of B-chain is represented by light gray circle (B20–B23 β-turn), gray bar (B24–B28 β-strand), and purple bar (less ordered C-terminal residues B29 and B30) (1, 2). Disassembly leads to equilibrium between native- and partially folded monomers (open triangle and black trapezoid). Detachment of the C-terminal B-chain segment within a partial fold (5, 6) may lead to the off-pathway, active conformation (open circle) or to an aggregated nucleus en route to a protofilament assembly (far right). Asterisk highlights protective modifications stabilizing the closed conformation: d-Ala–locked β-turn (analog 1), ∆PheB25 (analog 2 relative to ∆PheB24), and SCIs (25, 32, 70, 71). The unfolded state, constrained by native disulfide bridges (gold), shown in schematic form at the top, is off-pathway. Reproduced with permission from ref. .

References

    1. Adams MJ, et al. Structure of rhombohedral 2 zinc insulin crystals. Nature. 1969;224(5218):491–495.
    1. Baker EN, et al. The structure of 2Zn pig insulin crystals at 1.5 A resolution. Philos Trans R Soc Lond B Biol Sci. 1988;319(1195):369–456. - PubMed
    1. Derewenda U, et al. X-ray analysis of the single chain B29-A1 peptide-linked insulin molecule. A completely inactive analogue. J Mol Biol. 1991;220(2):425–433. - PubMed
    1. Mirmira RG, Nakagawa SH, Tager HS. Importance of the character and configuration of residues B24, B25, and B26 in insulin-receptor interactions. J Biol Chem. 1991;266(3):1428–1436. - PubMed
    1. Hua QX, Shoelson SE, Kochoyan M, Weiss MA. Receptor binding redefined by a structural switch in a mutant human insulin. Nature. 1991;354(6350):238–241. - PubMed

Publication types