. 2014 Sep 16;111(37):13295-300.
doi: 10.1073/pnas.1321089111. Epub 2014 Aug 4.

Convex lens-induced nanoscale templating

Affiliations

Convex lens-induced nanoscale templating

Daniel J Berard et al. Proc Natl Acad Sci U S A. .

Abstract

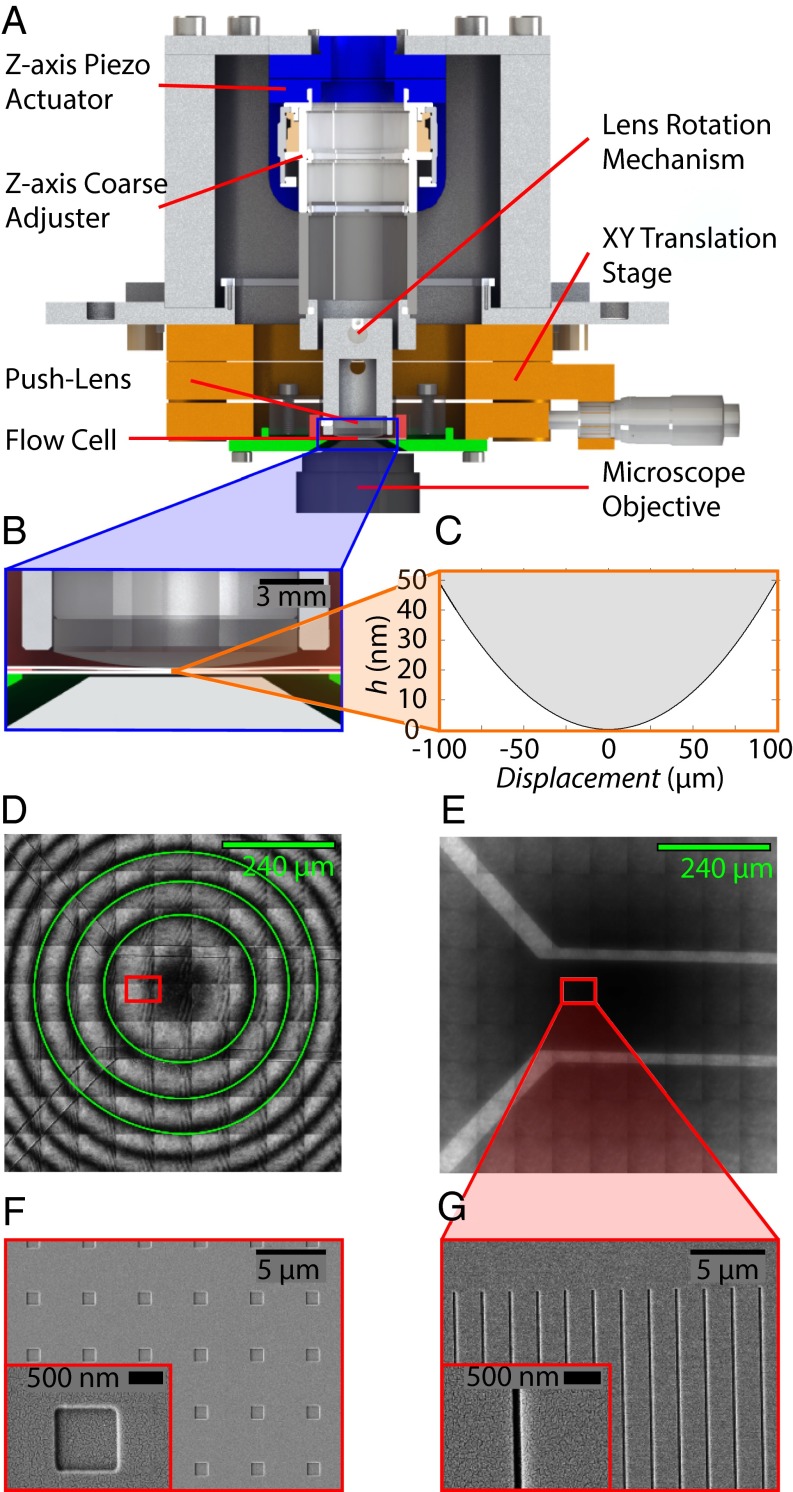
We demonstrate a new platform, convex lens-induced nanoscale templating (CLINT), for dynamic manipulation and trapping of single DNA molecules. In the CLINT technique, the curved surface of a convex lens is used to deform a flexible coverslip above a substrate containing embedded nanotopography, creating a nanoscale gap that can be adjusted during an experiment to confine molecules within the embedded nanostructures. Critically, CLINT has the capability of transforming a macroscale flow cell into a nanofluidic device without the need for permanent direct bonding, thus simplifying sample loading, providing greater accessibility of the surface for functionalization, and enabling dynamic manipulation of confinement during device operation. Moreover, as DNA molecules present in the gap are driven into the embedded topography from above, CLINT eliminates the need for the high pressures or electric fields required to load DNA into direct-bonded nanofluidic devices. To demonstrate the versatility of CLINT, we confine DNA to nanogroove and nanopit structures, demonstrating DNA nanochannel-based stretching, denaturation mapping, and partitioning/trapping of single molecules in multiple embedded cavities. In particular, using ionic strengths that are in line with typical biological buffers, we have successfully extended DNA in sub-30-nm nanochannels, achieving high stretching (90%) that is in good agreement with Odijk deflection theory, and we have mapped genomic features using denaturation analysis.

Keywords: CLIC imaging; genomic mapping; nanotechnology; polymer confinement; single-molecule manipulation.


Conflict of interest statement

The authors declare no conflict of interest.

Figures

Fig. 1.
Fig. 1.
Illustration of the DNA-loading procedure. (A) When the chamber height has microscale vertical dimensions, DNA molecules are unconfined and take on coiled conformations. (B) When the push-lens is lowered, the imposed vertical nanoscale confinement causes DNA molecules to align in the nanochannels, their energetically preferred state.
Fig. 2.
Fig. 2.
Schematic of the CLINT imaging platform. (A) Schematic of the CLIC device. (B) Close-up showing flow cell deformation by the push-lens, with aqueous sample inserted before deformation. Adhesive tape thickness exaggerated to 100 μm (in reality ∼30 μm or 10 μm). (C) Fourth-order polynomial fit to the chamber height profile (10). (D) An array of high-resolution images (80 μm) is acquired to span a large region (720 μm). Interferometry pattern corresponds to Newton’s rings. The contours of the chamber height fit (green) are overlaid on the intensity minima. (E) Fluorescence image of a dye solution in the same CLINT chamber. Because fluorescence intensity is proportional to the chamber height, the microchannels are bright. The nanochannels, which run from one microchannel to the other, are not visible. SEM images of nanopits (F) and nanochannels (G) (Insets are close-ups) embedded in the lower coverslip.
Fig. 3.
Fig. 3.
Sequence of frames for a λ-DNA molecule extending in a nanochannel while the push-lens is lowered. (A) Extension in a 27-nm channel. The time between frames is 364 ms. (B) Extension in a 50-nm channel. The time between frames is 910 ms. See Movie S1 of DNA loading and SI Text for a description of the experimental loading procedure.
Fig. 4.
Fig. 4.
Templated DNA end-to-end length as a function of chamber height. (A) Schematic of the chamber geometry close to the contact point. Nanochannels are not to scale. (B) Representative DNA molecules at different chamber heights. Images represent the time average of single-molecule movies taken at equilibrium, processed using a Gaussian filter (radius = 1 pixel; SD = 0.6 pixel). See Movie S2 for the corresponding single-molecule movies. A single-molecule histogram of end-to-end lengths is shown below each image, representing the observed temporal fluctuations in length throughout a 100-frame movie. (C) Plot of measured end-to-end lengths as a function of chamber height, superimposed with prediction curves from Odijk theory (red) and Odijk theory with S and C loops (blue) (SI Text, Confinement Theory) (16). At each height, a distribution of DNA lengths is observed, lowering the average extension from its maximum value. The observed maximum extension agrees with the theoretical prediction by Odijk for a fully extended molecule. (D) Probability density of DNA length at several chamber heights, calculated using the indicated ensembles of molecules.
Fig. 5.
Fig. 5.
CLINT demonstration using nanopits. (A) Loading T4 DNA into nanopits (600- and 900-nm width, 50-nm depth, 4-μm spacing). Time between frames is 1.1 s. See Movies S3 and S4 for single-molecule loading movies. (B) Representative images of T4 DNA at equilibrium, confined to 600-nm pits at different heights within the imaging chamber.
Fig. 6.
Fig. 6.
Denaturation mapping of λ-DNA in 50-nm channels. (A) Kymograph showing initial loading of DNA into a nanochannels and release of YOYO-1 dye to reveal the characteristic λ-DNA melting profile. (B) Kymograph taken ∼1 min after loading a molecule into a nanochannel. (C) DNA image produced by averaging all 497 frames from the kymograph in B. (D) Intensity profile along the central axis of the molecule shown in C (blue) and theoretical melting profile (red), assuming a helicity of 0.7.

Comment in

  • How to get into that "room at the bottom".
    Flyvbjerg H. Flyvbjerg H. Proc Natl Acad Sci U S A. 2014 Sep 16;111(37):13249-50. doi: 10.1073/pnas.1414387111. Epub 2014 Sep 3. Proc Natl Acad Sci U S A. 2014. PMID: 25187558 Free PMC article. No abstract available.

References

    1. Lam ET, et al. Genome mapping on nanochannel arrays for structural variation analysis and sequence assembly. Nat Methods. 2012;30(8):771–776. - PMC - PubMed
    1. Reisner W, et al. Single-molecule denaturation mapping of DNA in nanofluidic channels. Proc Natl Acad Sci USA. 2010;107(30):13294–13299. - PMC - PubMed
    1. Reisner W, Larsen NB, Flyvbjerg H, Tegenfeldt JO, Kristensen A. Directed self-organization of single DNA molecules in a nanoslit via embedded nanopit arrays. Proc Natl Acad Sci USA. 2009;106(1):79–84. - PMC - PubMed
    1. Reisner W, Pedersen JN, Austin RH. DNA confinement in nanochannels: Physics and biological applications. Rep Prog Phys. 2012;75(10):106601–106610. - PubMed
    1. Bruus H, Microfuidics C. 2008. Theoretical Microfluidics (Oxford University Press, Oxford)

Publication types