. 2014 Aug 19;111(33):E3476-85.
doi: 10.1073/pnas.1401883111. Epub 2014 Aug 4.

Robust efficiency and actuator saturation explain healthy heart rate control and variability

Affiliations

Robust efficiency and actuator saturation explain healthy heart rate control and variability

Na Li et al. Proc Natl Acad Sci U S A. .

Abstract

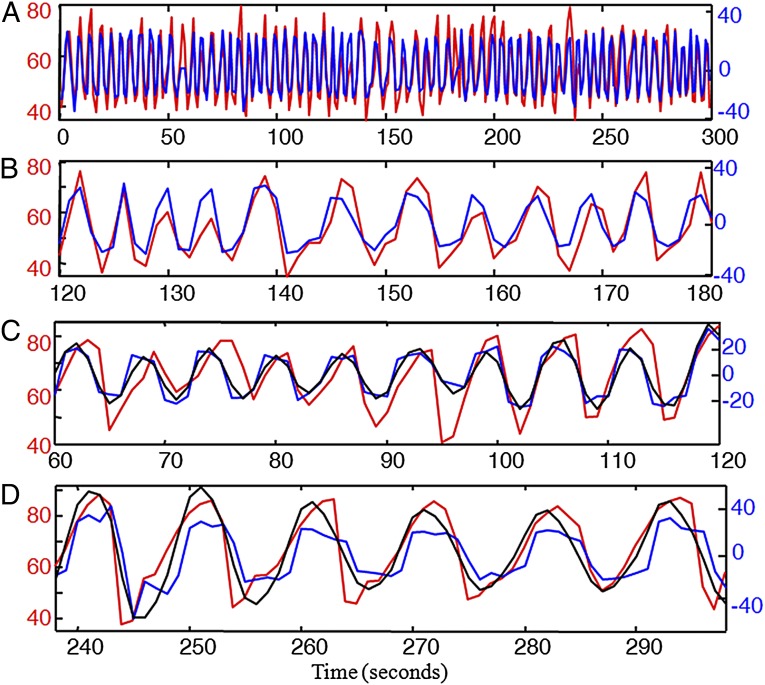
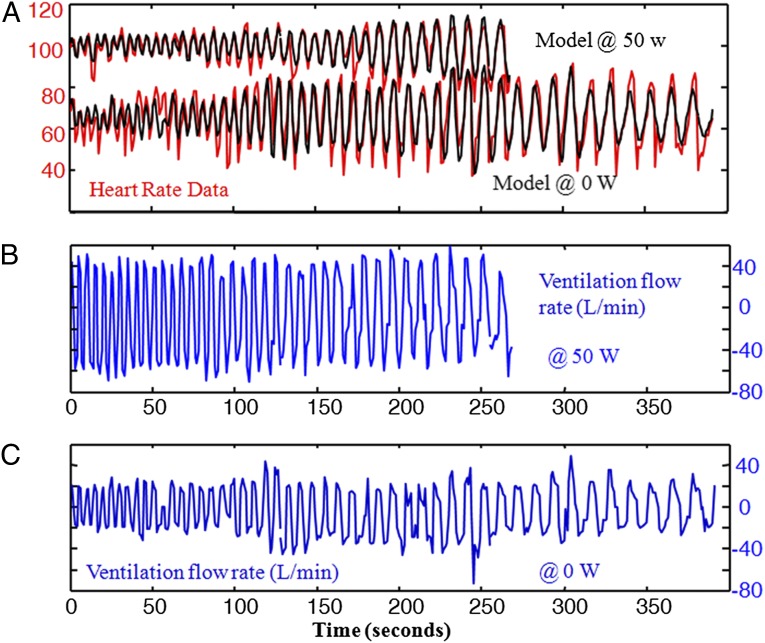
The correlation of healthy states with heart rate variability (HRV) using time series analyses is well documented. Whereas these studies note the accepted proximal role of autonomic nervous system balance in HRV patterns, the responsible deeper physiological, clinically relevant mechanisms have not been fully explained. Using mathematical tools from control theory, we combine mechanistic models of basic physiology with experimental exercise data from healthy human subjects to explain causal relationships among states of stress vs. health, HR control, and HRV, and more importantly, the physiologic requirements and constraints underlying these relationships. Nonlinear dynamics play an important explanatory role--most fundamentally in the actuator saturations arising from unavoidable tradeoffs in robust homeostasis and metabolic efficiency. These results are grounded in domain-specific mechanisms, tradeoffs, and constraints, but they also illustrate important, universal properties of complex systems. We show that the study of complex biological phenomena like HRV requires a framework which facilitates inclusion of diverse domain specifics (e.g., due to physiology, evolution, and measurement technology) in addition to general theories of efficiency, robustness, feedback, dynamics, and supporting mathematical tools.

Keywords: optimal control; respiratory sinus arrhythmia; system identification.


Conflict of interest statement

The authors declare no conflict of interest.

Figures

Fig. 1.
Fig. 1.
HR responses to simple changes in muscle work rate on a stationary bicycle: Each experimental subject performed separate stationary cycle exercises of ∼10 min for each workload profile, with different means but nearly identical square wave fluctuations around the mean. A typical result is shown from subject 1 for three workload profiles with time on the horizontal axis (zoomed in to focus on a 6-min window). (A) HR (red) and workload (blue); linear local piecewise static fits (black) with different parameters for each exercise. The workload units (most strenuous exercise on top of graph) are shifted and scaled so that the blue curves are also the best global linear fit. (B) Corresponding dynamics fits, either local piecewise linear (black) or global linear (blue). Note that, on all time scales, mean HR increases and variability (HRV) goes down with the increasing workload. Breathing was spontaneous (not controlled).
Fig. 2.
Fig. 2.
Schematic for cardiovascular control of aerobic metabolism and summary of main variables: Blue arrows represent venous beds, red arrows are arterial beds, and dashed lines represent controls. Four types of signals, distinct in both functional role and time series behavior, together define the required elements for robust efficiency. The main control requirement is to maintain (i) small errors in internal variables for brain homeostasis (e.g., arterial O2 saturation SaO2, mean arterial blood pressure Pas, and CBF), and muscle efficiency (oxygen extraction ∆O2 across working muscle) despite (ii) external disturbances (muscle work rate W), and (iii) internal sensor noise and perturbations (e.g., pressure changes from different respiratory patterns due to pulsatile ventilation V) using (iv) actuators (heart rate H, minute ventilation VE, vasodilatation and peripheral resistance R, and local cerebral autoregulation).
Fig. 3.
Fig. 3.
Static analysis of cardiovascular control of aerobic metabolism as workload increases: Static data from Fig. 1A are summarized in A and the physiological model explaining the data is in B and C. The solid black curves in A and B are idealized (i.e., piecewise linear) and qualitatively typical values for H = h(W) that are globally consistent with static piecewise linear fits (black in Fig. 1A) at the two lower workload levels. The dashed line in A shows h(W) from the global static linear fit (blue in Fig. 1A) and in B shows a hypothetical but physiologically implausible linear continuation of increasing HR at the low workload level (solid line). The mesh plot in C depicts Pas–∆O2 (mean arterial blood pressure–tissue oxygen difference) on the plane of the H–W mesh plot in B using the physiological model (Pas, ∆O2) = f(H, W) for generic, plausible values of physiological constants. Thus, any function H = h(w) can be mapped from the H, W plane (B) using model f to the (P, ∆O2) plane (C) to determine the consequences of Pas and ∆O2. The reduction in slope of H = h(W) with increasing workload is the simplest manifestation of changing HRV addressed in this study.
Fig. 4.
Fig. 4.
Optimal control model response using first-principle model to two different workload (blue) demands, approximately square waves of 0–50 W (Lower) and 100–150 W (Upper): For each data set (using subject 2's data), a physiological model with optimal controller is simulated with workload as input (blue) and HR (black) as output, and compared with collected HR data (red). Simulations of blood pressure (Pas, purple) and tissue oxygen saturation ([O2]T, green) are consistent with the literature but data were not collected from subjects. Breathing is spontaneous (not controlled).
Fig. 5.
Fig. 5.
HR response (red) to ventilation V (blue) at rest (0 W): The ventilatory data are raw speed of inhalation and exhalation measured at the mouthpiece. In each case the units for V (blue) are chosen to show the optimal static fit h(V) = b·V + c to the collected HR data. A and B show natural breathing, with B zoomed in to focus on a smaller window to help visualize the data and fit. C and D are similar focused smaller windows from a longer controlled breathing experiment at resting (0 W) where the subject followed a frequency sweep from fast to slow breathing (see Fig. 6 for the full frequency range). C focuses on breathing frequencies close to natural breathing, whereas D focuses on frequencies slower than natural. Both C and D show simulated dynamic fits (black), and optimal static fits h(V) = b·V + C (blue). The dynamic fits improve on the static fits more for the controlled sweep than for natural breathing (Table 2).
Fig. 6.
Fig. 6.
HR response to sweep ventilation on different workload levels: Two experiments with (A) HR (red) and dynamic fit (black) to input of controlled ventilation frequency sweeps with measured ventilatory flow rate (blue) on a fixed background workload of (B) 0 W or (C) 50 W. Ventilatory flow (with spontaneous ventilation magnitude) was necessarily larger at 50 W and the subject was unable to breathe slowly enough to complete the entire frequency sweep.

References

    1. Chandra FA, Buzi G, Doyle JC. Glycolytic oscillations and limits on robust efficiency. Science. 2011;333(6039):187–192. - PubMed
    1. Pool R. Is it healthy to be chaotic? Science. 1989;243(4891):604–607. - PubMed
    1. Buzsáki G. Rhythms of the Brain. New York: Oxford Univ Press; 2006.
    1. Glass L. Synchronization and rhythmic processes in physiology. Nature. 2001;410(6825):277–284. - PubMed
    1. Buchman TG. The community of the self. Nature. 2002;420(6912):246–251. - PubMed

Publication types