. 2014 Oct 16;33(20):2295-313.
doi: 10.15252/embj.201387500. Epub 2014 Aug 4.

Neutral competition of stem cells is skewed by proliferative changes downstream of Hh and Hpo

Affiliations

Neutral competition of stem cells is skewed by proliferative changes downstream of Hh and Hpo

Marc Amoyel et al. EMBO J. .

Abstract

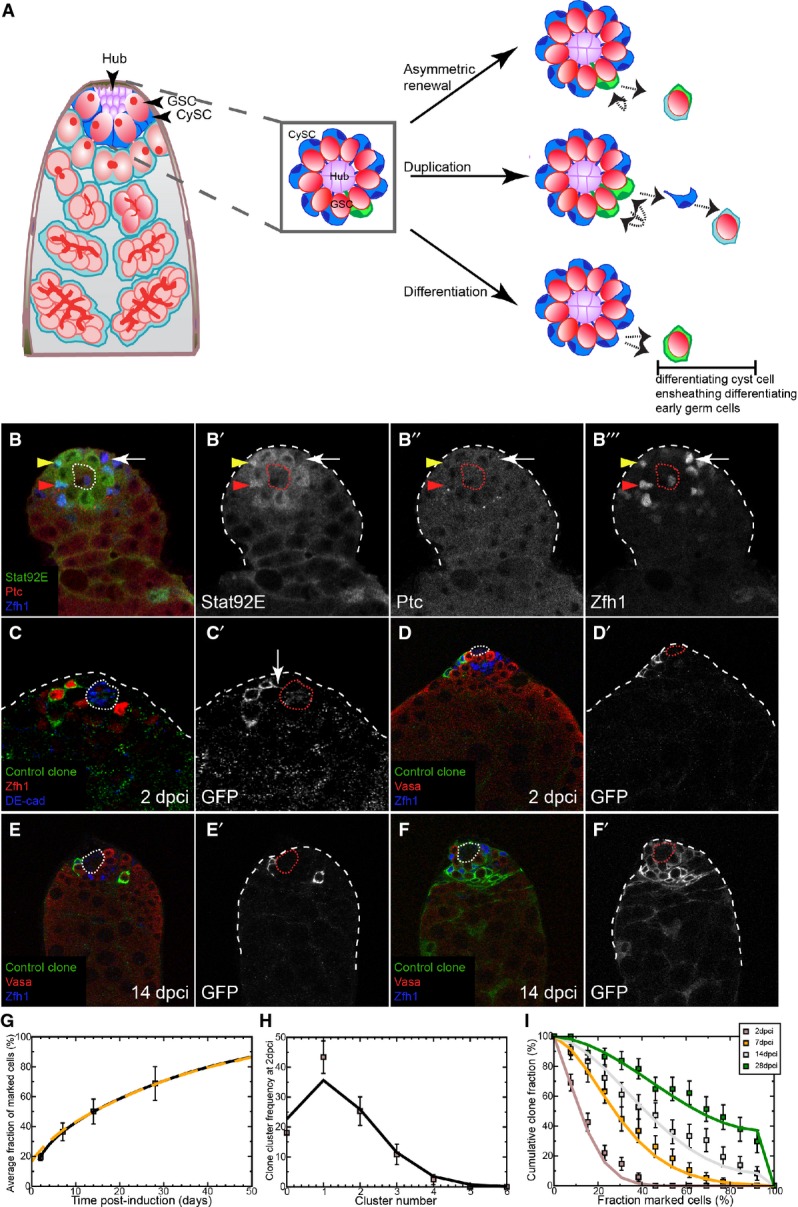
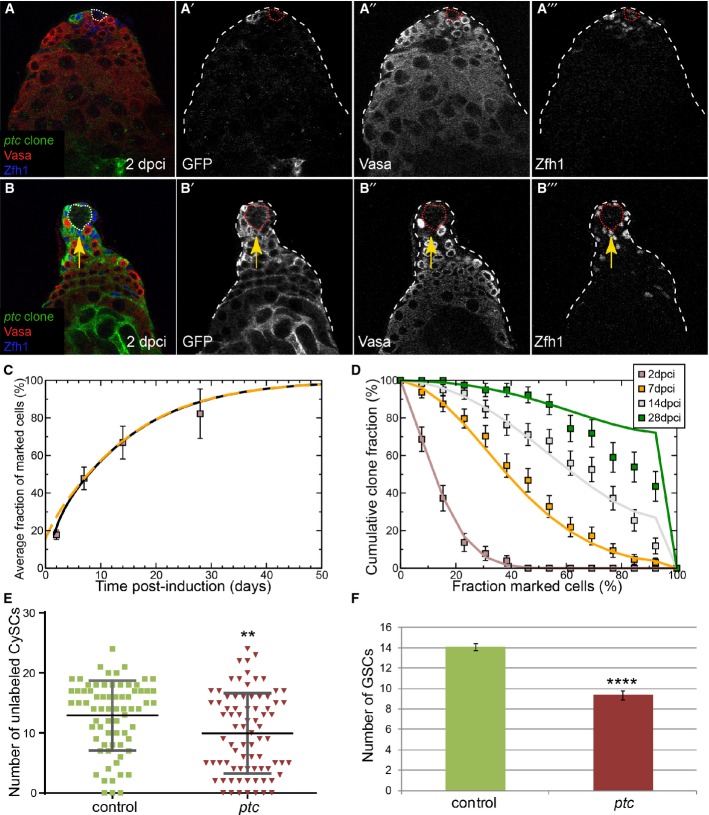
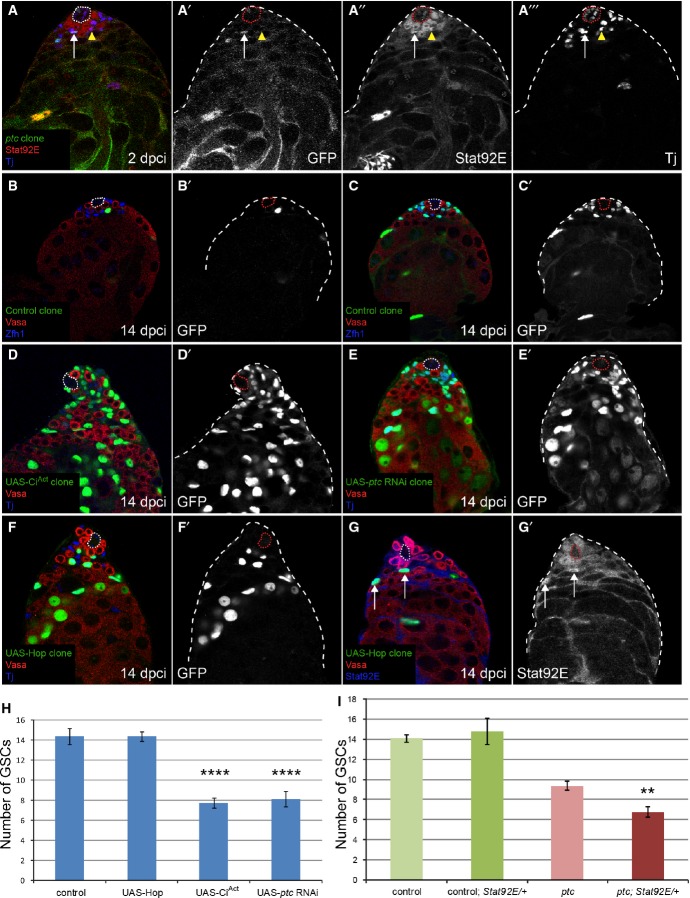
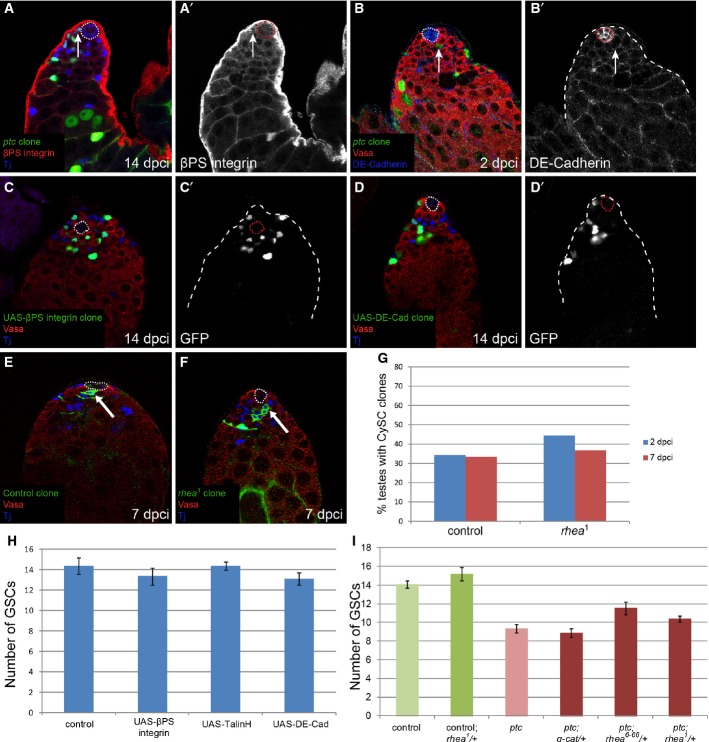
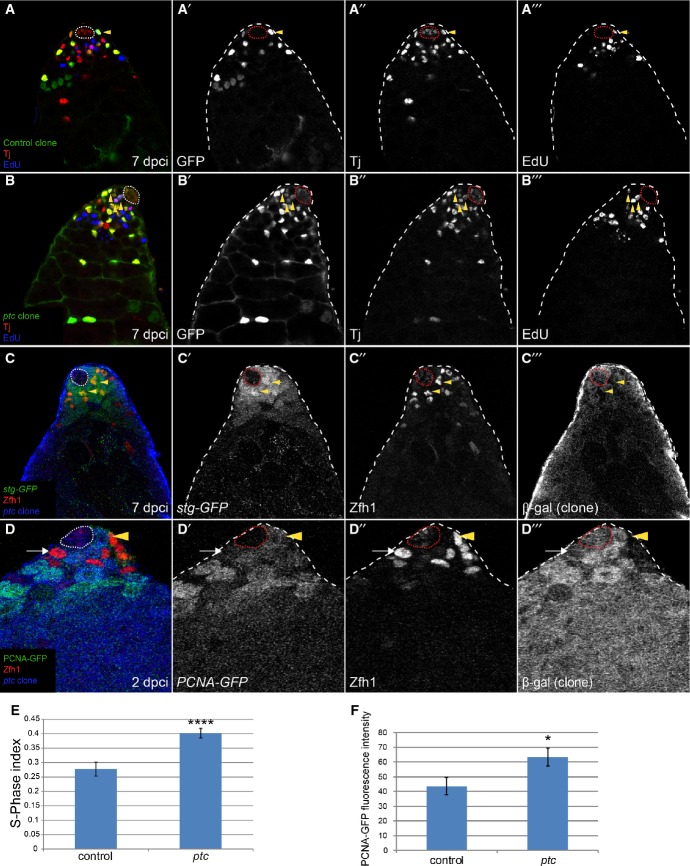
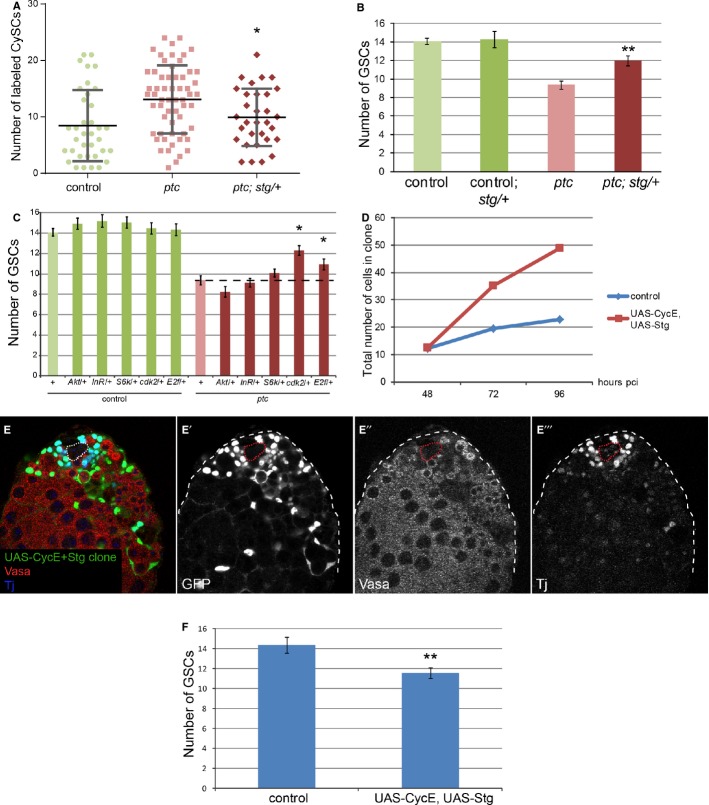
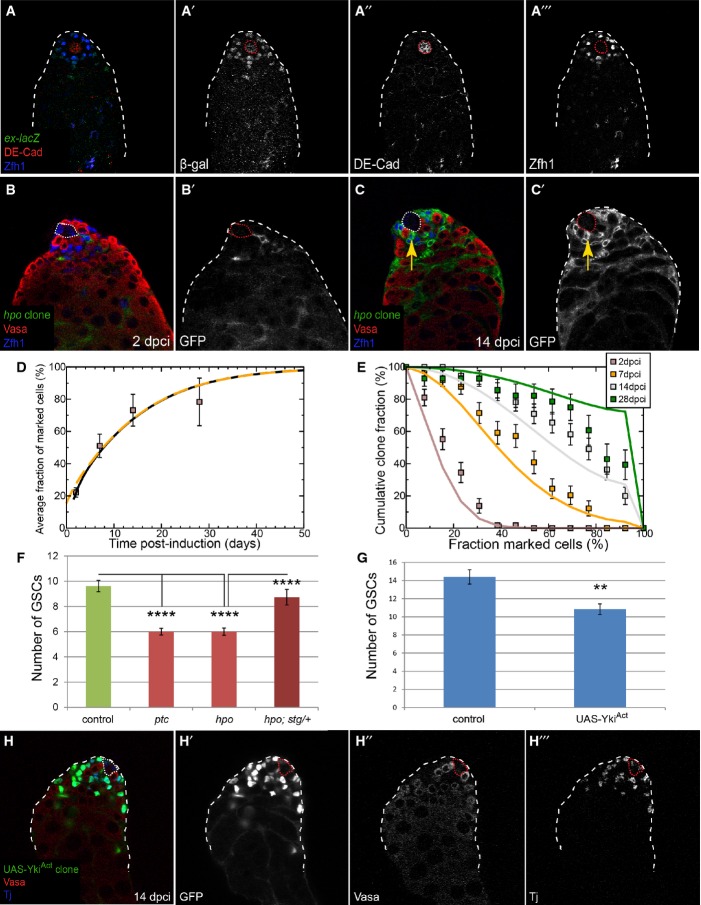
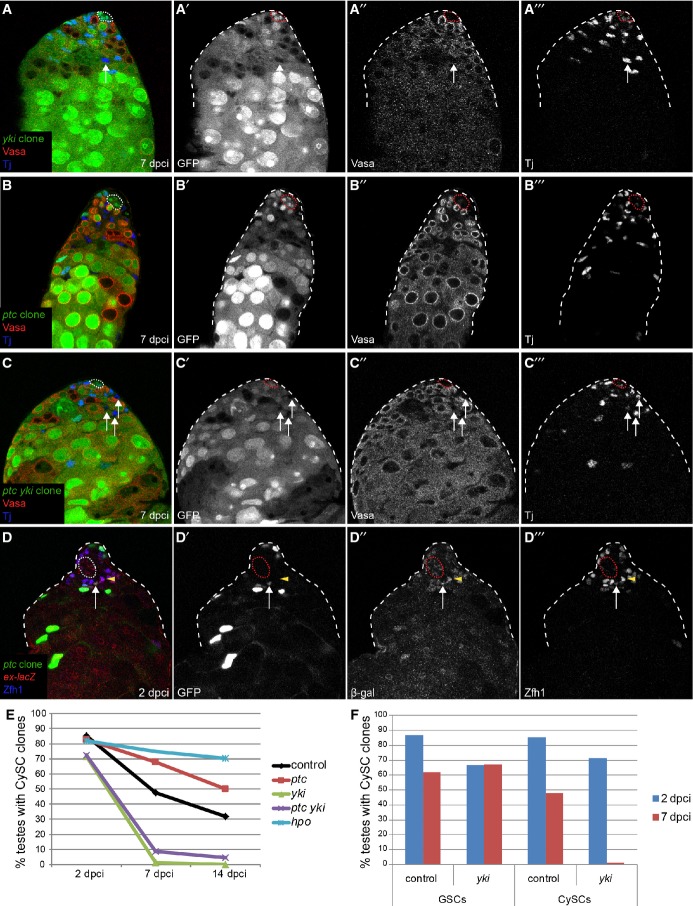
Neutral competition, an emerging feature of stem cell homeostasis, posits that individual stem cells can be lost and replaced by their neighbors stochastically, resulting in chance dominance of a clone at the niche. A single stem cell with an oncogenic mutation could bias this process and clonally spread the mutation throughout the stem cell pool. The Drosophila testis provides an ideal system for testing this model. The niche supports two stem cell populations that compete for niche occupancy. Here, we show that cyst stem cells (CySCs) conform to the paradigm of neutral competition and that clonal deregulation of either the Hedgehog (Hh) or Hippo (Hpo) pathway allows a single CySC to colonize the niche. We find that the driving force behind such behavior is accelerated proliferation. Our results demonstrate that a single stem cell colonizes its niche through oncogenic mutation by co-opting an underlying homeostatic process.

Keywords: Hedgehog; Hippo; competition; stem cell; testis.


Figures

Figure 1
Figure 1. Characterizing the CySC pool
A Left: Schematic of the apical tip of the Drosophila testis. GSCs (red) and CySCs (dark blue) contact the hub (purple). Differentiating progeny move away from the hub to form germ cysts (red), which are ensheathed by two cyst cells (light blue). Center: Boxed enlargement showing that CySCs form a ring around the hub and contact the hub in between the GSCs. The CySC nucleus (dark blue) resides just ‘behind’ the row of GSCs. A marked CySC (green) will undergo division with possible outcomes depicted at right. Right: In asymmetric renewal (top), the two daughters of the clone give rise to one CySC and one differentiating cyst cell, which ensheaths a gonialblast along with an unmarked cyst cell (light blue). In duplication (middle), both marked daughters remain at the niche as CySCs, displacing an unmarked CySC (blue) in the process. This displaced unmarked cell differentiates into an ensheathing cyst cell. In differentiation (bottom), both daughters of the marked CySC differentiate into cyst cells, resulting in no marked CySCs at the hub. B A control testis labeled with Stat92E (green, single channel B’), Ptc (red, single channel B”), and Zfh1 (blue, single channel B’”) showing that while some Zfh1-positive cells co-labeled for Ptc and Stat92E (red arrowhead), others were only positive for one factor (yellow arrowhead) or for neither (arrow). C CySC MARCM clones labeled with membrane-targeted CD8-GFP (C’) showing identifiable single cells, some of which contacted the hub (DE-cadherin, blue) with membrane extensions (arrow in C’). D–F Clonal analysis, GFP (single channels D’–F’) indicates the clone, Vasa (red) labels germ cells and Zfh1 (blue) CySCs and early cyst cells; the hub is indicated by a dotted line. GFP-labeled control clones were generated by the MARCM technique and analyzed at 2 (D) and 14 dpci (E, F). Although clones were small at 2 dpci (D), they varied markedly by 14 dpci (E, F). G Variation of average size of control clones as a function of time. The data points (boxes) show the mean fraction of labeled CySCs in persisting clones. The black line shows a fit of the neutral drift model to the data using an induction frequency of CySCs at a ratio of one in 10 (i.e., 10%). The dashed orange line represents the predicted clonal evolution if only a single CySC clone was induced with a time-shift of 3 days with the same set of parameters. One may note that the clone sizes observed from multiple independent induction events and from a single induction event converge rapidly. For details of the neutral drift model and the notation, see Supplementary Materials and Methods. n = 83, 74, 73, 81 for 2, 7, 14, 28 dpci, respectively. Error bars denote SEM. H Comparison of observed (boxes) and predicted (line) frequency of clusters of somatic cell clones. Each cluster is presumed to represent an independent labeling event. The line was generated by a least-squares fit and suggests a labeling efficiency of 11% (q = 0.11). Error bars denote SEM. I Distribution of persisting clone sizes in wild-type testes. The boxes show experimental data, and lines show the predictions of the model. n = 83, 74, 73, 81 for 2, 7, 14, 28 dpci, respectively. Error bars denote SEM.
Figure 2
Figure 2. Neutral drift dynamics are skewed by ptc mutant clones
A, B Clonal analysis, GFP (single channels A’, B’) indicates the clone, Vasa (red, single channels A”, B”) labels germ cells and Zfh1 (blue, single channels A’”, B’”) CySCs and early cyst cells; the hub is indicated by a dotted line. GFP-labeled ptc mutant clones were generated by the MARCM technique and analyzed at 2 (A) and 14 dpci (B). Arrow (B–B’”) shows displacement of GSCs by ptc mutant CySCs. C Variation of average size of ptc mutant clones as a function of time. The data points (boxes) show the mean fraction of labeled CySCs in persisting clones. The black line shows a fit of the neutral drift model, modified to have a bias in favor of the labeled cell, to the data using an induction frequency of 10%. The dashed orange line represents the predicted clonal evolution if only a single CySC clone were induced with a time-shift of 3 days with the same set of parameters. One may note that the clone sizes observed from multiple independent induction events and from a single induction event converge rapidly. For details of the biased drift model and the notation, see Supplementary Materials and Methods. n = 63, 81, 79, 66 for 2, 7, 14, 28 dpci, respectively. Error bars denote SEM. D Distribution of clone sizes of persistent ptc mutant clones. The boxes show experimental data, and lines show the predictions of the model. Error bars denote SEM. E Number of unlabeled CySCs at 14 dpci in testes containing either control (green) or ptc mutant (red) clones. Lines show mean and standard deviation. Asterisks denote statistically significant difference from control. n = 73 and 79 for control and ptc mutant, respectively. F Number of GSCs at 14 dpci when control or ptc CySC clones were present. ptc mutant CySCs displaced wild-type GSCs, leading to a significant decrease in the number of GSCs. Asterisks denote statistically significant difference from control. n = 48 and 49 for control and ptc mutant, respectively. Error bars denote SEM.
Figure 3
Figure 3. Clonal overactivation of the Hh pathway, but not JAK/STAT, causes niche competition phenotypes
A No increase in Stat92E staining (red, single channel in A”) was seen in a ptc mutant CySC (green, arrow, single channel in A’) compared to neighboring wild-type CySCs (arrowhead) at 2 dpci. Somatic cells were labeled with Tj (blue, single channel in A’”). See also Supplementary Fig S5 for Stat92E staining in clones at 7 and 14 dpci. B–G MARCM clones at 14 dpci, with single channels showing the clone marker GFP in (B’–F’), Vasa in red and Zfh1 (B, C) or Tj (D–F) in blue. Control clones (B, C) showed variation in the number of cells labeled. Overexpression of CiAct (D) or RNAi against ptc (E) recapitulated the ptc mutant phenotype (compare with Fig 2B), but overexpression of Hop did not (F). Hop overexpression activated JAK/STAT signaling (G), as seen by stabilization of Stat92E protein (blue, single channel in G’) in the clones (green, arrows). H Number of GSCs at 14 dpci when CySC clones of the indicated genotype were induced. Hop overexpression did not affect GSC number, while CiAct and ptc RNAi-expressing clones caused loss of GSCs, similar to ptc mutant clones (see Fig 2F). Asterisks denote statistically significant change from control. n = 15, 24, 27, 8 for control, UAS-Hop, UAS-CiAct, UAS-ptc RNAi, respectively. Error bars denote SEM. I Number of GSCs at 14 dpci when control or ptc mutant CySCs were present, showing an enhancement of GSC loss when ptc mutant clones were induced in a background lacking one copy of the Stat92E gene. Asterisks denote statistically significant change from the ptc mutant clones alone. n = 48 (control), 36 (control; Stat92E/+), 49 (ptc), 20 (ptc; Stat92E/+). Error bars denote SEM.
Figure 4
Figure 4. Increased adhesion is not causal to niche competition
A, B ptc mutant clones did not upregulate adhesion molecules. No change in βPS-integrin (A, red, single channel in A’) or in DE-cadherin expression (B, blue, single channel in B’) was seen at the hub in testes with ptc mutant clones (green). Vasa labels germ cells in red (B), Tj labels somatic cells in blue (A). The hub is indicated with a dotted line. C, D GFP-positive MARCM clones (green, single channels in C’,D’) overexpressing βPS-integrin (C) or DE-cadherin (D) did not outcompete neighboring wild-type CySCs or GSCs. Vasa labels germ cells in red, Tj labels somatic cells in blue. The hub is indicated with a dotted line. E, F Control (E) and rhea mutant (F) MARCM clones showing marked CySCs which contacted the hub at 7 dpci (arrows). Vasa labels germ cells in red, Tj labels somatic cells in blue. The hub is indicated with a dotted line. G CySC clone recovery rates at 2 (blue bars) and 7 (red bars) dpci for control (left) and rhea mutant (right). The presence of rhea mutant clones at the niche at the 7-day time point indicates that rhea was not required in CySCs for self-renewal. n = 38 and 24 for control at 2 and 7 dpci, respectively, and n = 9 and 49 for rhea1 at 2 and 7 dpci, respectively. H Number of GSCs present when CySC clones of the indicated genotype were generated at 14 dpci. Overexpression of βPS-integrin, TalinH or DE-cadherin did not affect GSC numbers. n = 15, 19, 25, 17 for control, UAS-βPS-integrin, UAS-TalinH or UAS-DE-cadherin, respectively. Error bars denote SEM. I Number of GSCs when ptc mutant CySC clones were present along with a single mutant copy of the indicated genes at 14 dpci. Reduction of α-cat had no effect on the ptc phenotype, while one rhea allele partly suppressed GSC loss. n = 48 (control); 21 (control; rhea1/+); 49 (ptc); 26 (ptc; α-cat/+); 19 (ptc; rhea6-66/+); 35 (ptc; rhea1/+). Error bars denote SEM.
Figure 5
Figure 5. ptc mutant CySCs proliferate faster than controls
A, B There was an increase in the S-phase index in CySCs mutant for ptc. Quantification of S-phase in control (A) or ptc mutant (B) clones. Clones expressing GFP (green, single channel A’, B’) were labeled with Tj (red, single channel A”, B”) and EdU (blue, single channel A”’, B’”). Triply labeled cells (yellow arrowheads) were counted as a ratio of total cells double positive for GFP and Tj, with quantification shown in (E). C stg-GFP (green, single channel C’) was upregulated in ptc mutant CySCs (yellow arrowheads). Zfh1 (red, single channel C”) labels CySCs, and their offspring and clones are identified by loss of the βgal marker (blue, single channel C’”). D PCNA-GFP (green, single channel D’) was upregulated in ptc mutant clones. Clones are labeled by loss of βgal (blue, single channel D”’). Zfh1 (red, single channel D”) marks CySCs and their offspring. Arrow shows control CySC, and arrowhead shows a ptc mutant CySC. E S-phase index. See legend of (A) above. Asterisks denote statistically significant change from control. Error bars denote SEM. F Quantification of PCNA-GFP fluorescence intensity in control or ptc mutant CySCs. n = 11 for both genotypes. An asterisk denotes statistically significant change from control. Error bars denote SEM.
Figure 6
Figure 6. Increased proliferation downstream of ptc is necessary and sufficient for colonizing behavior
A, B Loss of one copy of stg suppressed the ptc mutant phenotype at 14 dpci. Graph showing number of labeled CySCs in the indicated genotypes (A). Lines in (A) show mean and standard deviation. n = 36 (control), 59 (ptc), 31 (ptc; stg/+). Graph showing the number of GSCs when CySC clones were present in the indicated genotype (B). Asterisks denote statistically significant change from the ptc mutant clones alone (A, B). n = 48 (control), 10 (control; stg/+), 49 (ptc), 17 (ptc; stg/+). Error bars in (B) denote SEM. C Graph showing the number of GSCs when CySC clones were present in the indicated genotypes at 14 dpci. An asterisk indicates statistically significant suppression of the ptc mutant phenotype. n = 48 (control), 25 (control; Akt/+), 21 (control; InR/+), 30 (control; S6k/+), 19 (control; cdk2/+), 21 (control, E2f/+), 49 (ptc), 21 (ptc; Akt/+), 30 (ptc; InR/+), 35 (ptc; S6k/+), 28 (ptc; cdk2/+), 30 (ptc, E2f/+). Error bars denote SEM. D Graph showing the total number of labeled cells within control clones (blue line) or clones overexpressing UAS-CycE + UAS-Stg (red line) at 48, 72, and 96 h pci. n = 21, 21, and 26 for control at 48, 72, and 96 h pci, respectively. n = 6, 12, and 15 for UAS-CycE+UAS-Stg at 48, 72 and 96 h pci, respectively. E Clonal overexpression of CycE and Stg caused CySC overproliferation and GSC loss. Clones are labeled by GFP expression (green, single channel E’), Vasa (red, single channel E”) marks germ cells, and Tj (blue, single channel E’“) marks the somatic lineage. The hub is indicated by a dotted line. F Quantification of GSC loss in the presence of CycE+Stg overexpressing CySC clones. Asterisks denote statistically significant difference from control. n = 15 and 22 for control and UAS-CycE, UAS-Stg, respectively. Error bars denote SEM.
Figure 7
Figure 7. hpo mutant CySCs also skew neutral drift dynamics and outcompete GSCs
A ex-lacZ (green, single channel A’) expression in the testis was observed in the somatic lineage (Zfh1, blue, single channel A’“) near the hub (DE-cadherin, red, single channel A”). B, C Clonal analysis, GFP (single channels, B’, C’) indicates the clone, Vasa (red) labels germ cells and Zfh1 (blue) CySCs and early cyst cells; the hub is indicated by a dotted line. GFP-labeled hpo mutant clones were generated by the MARCM technique and analyzed at 2 (B) and 14 dpci (C). Arrow (C, C’) shows displacement of wild-type GSCs by hpo mutant CySCs. D Variation of average size of hpo mutant clones as a function of time. The data points (boxes) show the mean fraction of labeled CySCs in persisting clones. The black line shows a fit of the neutral drift model, modified to have a bias in favor of the labeled cell, to the data using an induction frequency of 10%. The dashed orange line represents the predicted clonal evolution if only a single CySC clone were induced with a time-shift of 3 days with the same set of parameters. For details of the biased drift model and the notation, see Supplementary Materials and Methods. n = 69, 64, 71, 43 for 2, 7, 14, 28 dpci, respectively. Error bars denote SEM. E Distribution of clone sizes of persistent hpo mutant clones. The boxes show experimental data, and lines show the predictions of the model. Error bars denote SEM. F Graph showing the number of GSCs at 14 dpci when CySC clones of the indicated genotype were present. Asterisks denote statistically significant change for the comparisons indicated. n = 26 (control), 36 (ptc), 47 (hpo), 15 (hpo; stg/+). Error bars denote SEM. G, H YkiAct-overexpressing clones outcompeted both CySCs and GSCs at 14 dpci. Graph in (G) shows the number of GSCs when clones overexpressing YkiAct were present. Asterisks denote statistically significant change for the comparisons indicated. n = 15 (control), 19 (UAS-YkiAct). Error bars denote SEM. Clones are green (single channel H’), Vasa is red (single channel H”), and Tj is blue (single channel H”’). The hub is indicated by a dotted line.
Figure 8
Figure 8. Hh and Yki regulate niche competition and self-renewal independently
A–C yki mutant CySCs did not self-renew (A) and loss of yki suppressed the ptc colonization phenotype (C). Testes with negatively marked yki (A), ptc (B), or ptc yki double mutant (C) clones at 7 dpci. Absence of GFP (single channel A’, B’, C’) marks the clones, Vasa (single channel A”, B”, C”) is red, and Tj (single channel A”’, B’”, C’”) is blue. Arrows point to differentiated mutant cyst cells in (A) and (C). D ptc mutant clones (arrow) did not display increases in ex-lacZ expression compared to wild type (arrowhead). Clones are labeled by GFP (single channel D’), β-gal is in red (single channel D”), and Zfh1 is in blue (single channel D’”). The hub is outlined with a dotted line in all panels. E Graph of clone recovery rates over time for the indicated genotypes. n = 61, 21, 88 for control at 2, 7, 14 dpci, respectively; n = 46, 39, 89 for ptc at 2, 7, 14 dpci, respectively; n = 50, 94, 35 for yki at 2, 7, 14 dpci, respectively; n = 40, 59, 64 for ptc yki at 2, 7, 14 dpci, respectively; n = 39, 67 for hpo at 2, 14 dpci, respectively. F yki mutant GSCs could be recovered at 2 and 7 dpci. yki mutant CySCs could be recovered at 2 dpci but not 7 dpci. n = 61, 21 for control at 2, 7 dpci, respectively. n = 50, 94 for yki at 2, 7 dpci, respectively.

Comment in

References

    1. Amoyel M, Bach EA. Cell competition: how to eliminate your neighbours. Development. 2014;141:988–1000. - PMC - PubMed
    1. Amoyel M, Sanny J, Burel M, Bach EA. Hedgehog is required for CySC self-renewal but does not contribute to the GSC niche in the Drosophila testis. Development. 2013;140:56–65. - PMC - PubMed
    1. Chen C, Jack J, Garofalo RS. The Drosophila insulin receptor is required for normal growth. Endocrinology. 1996;137:846–856. - PubMed
    1. Chen Y, Struhl G. Dual roles for patched in sequestering and transducing Hedgehog. Cell. 1996;87:553–563. - PubMed
    1. Chen HW, Chen X, Oh SW, Marinissen MJ, Gutkind JS, Hou SX. mom identifies a receptor for the Drosophila JAK/STAT signal transduction pathway and encodes a protein distantly related to the mammalian cytokine receptor family. Genes Dev. 2002;16:388–398. - PMC - PubMed

Publication types

MeSH terms

Substances

LinkOut - more resources