. 2014 Aug 25;211(9):1733-40.
doi: 10.1084/jem.20140145. Epub 2014 Aug 4.

Nfil3 is required for the development of all innate lymphoid cell subsets

Affiliations

Nfil3 is required for the development of all innate lymphoid cell subsets

Cyril Seillet et al. J Exp Med. .

Abstract

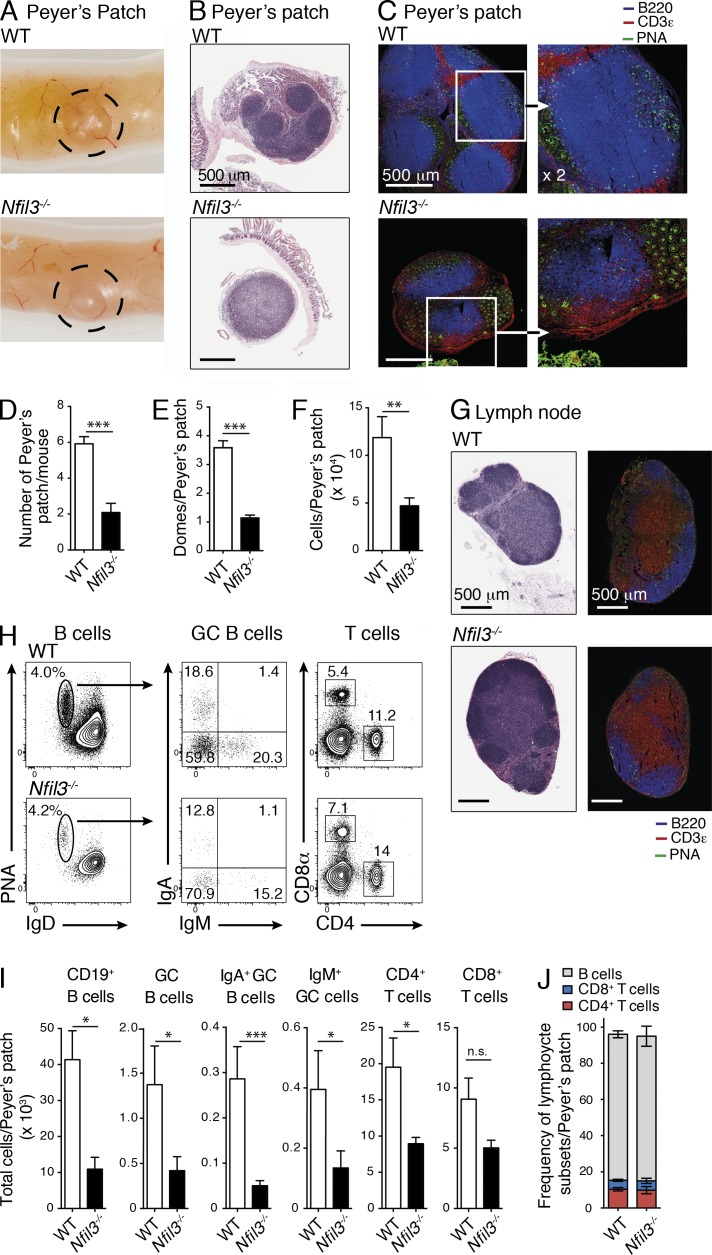
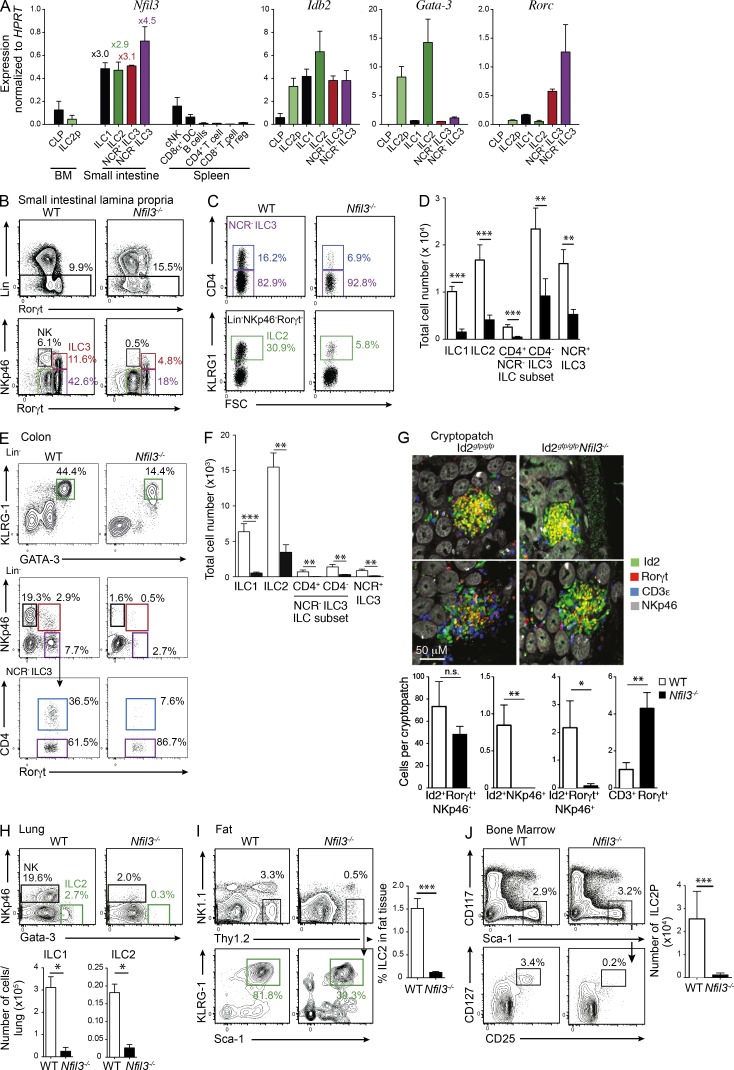
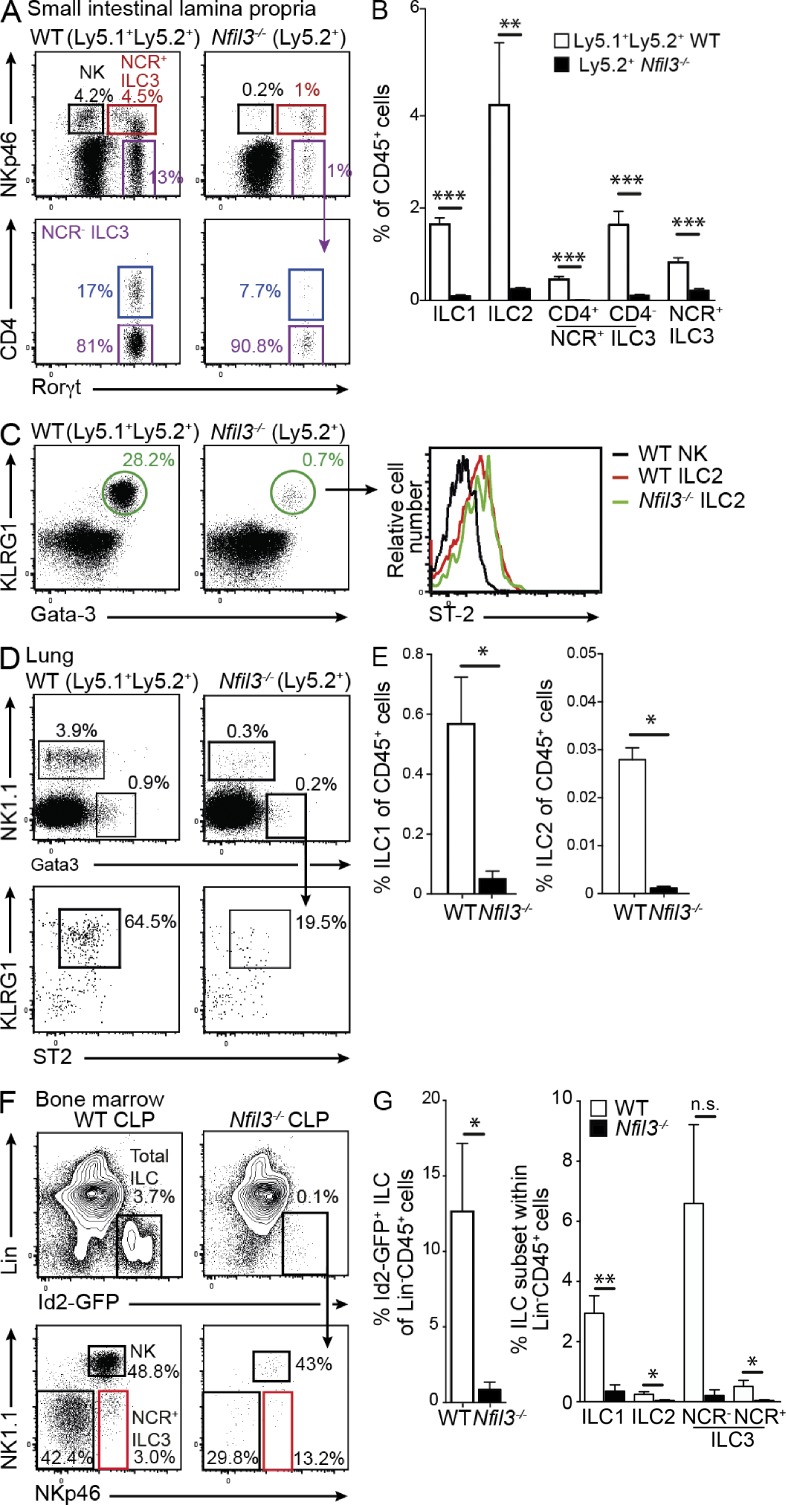
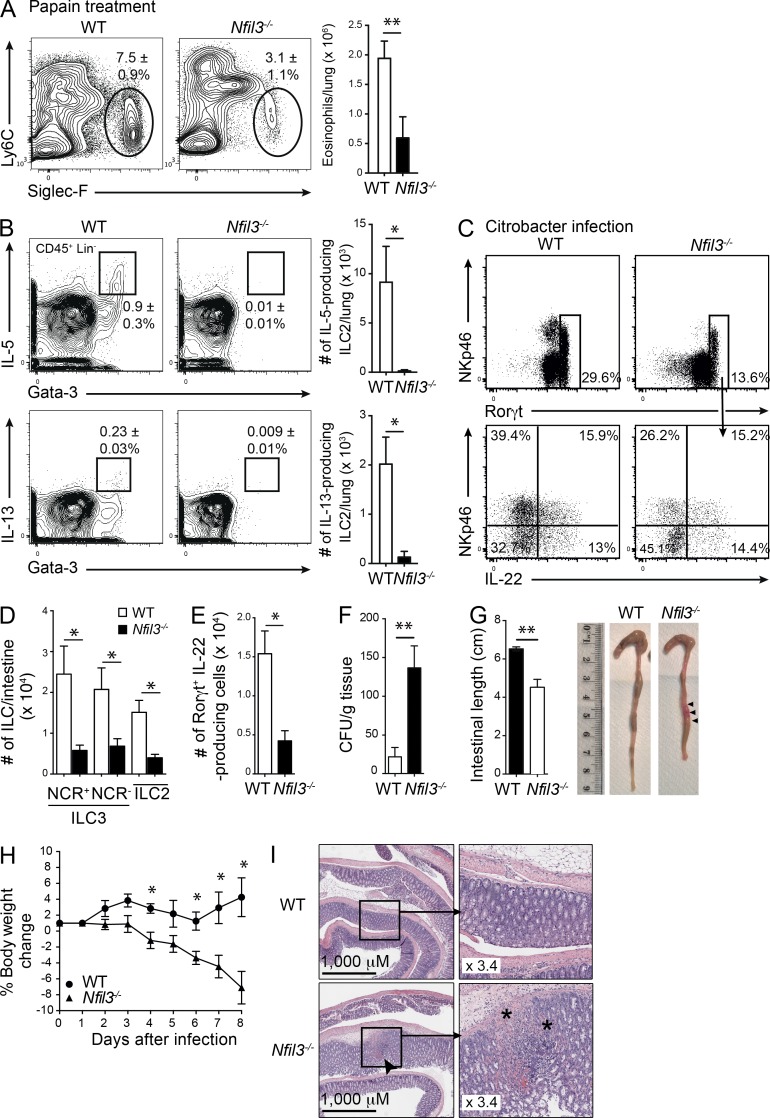
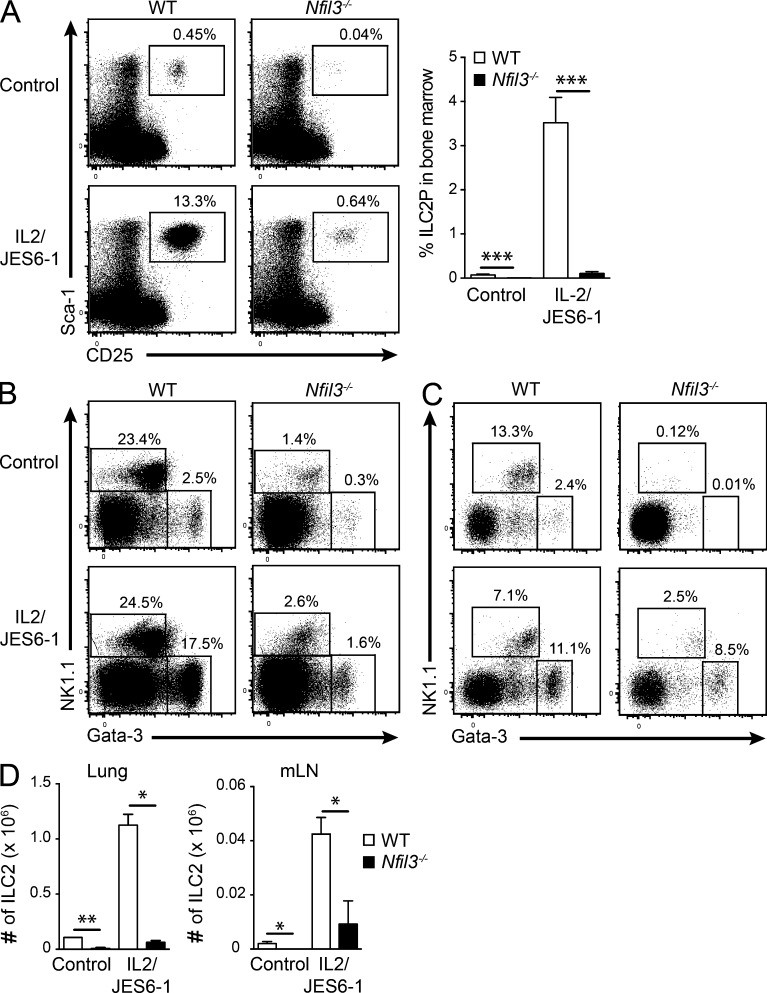
Innate lymphoid cell (ILC) populations protect against infection and are essential for lymphoid tissue formation and tissue remodeling after damage. Nfil3 is implicated in the function of adaptive immune lineages and NK cell development, but it is not yet known if Nfil3 regulates other innate lymphoid lineages. Here, we identify that Nfil3 is essential for the development of Peyer's patches and ILC2 and ILC3 subsets. Loss of Nfil3 selectively reduced Peyer's patch formation and was accompanied by impaired recruitment and distribution of lymphocytes within the patches. ILC subsets exhibited high Nfil3 expression and genetic deletion of Nfil3 severely compromised the development of all subsets. Subsequently, Nfil3(-/-) mice were highly susceptible to disease when challenged with inflammatory or infectious agents. Thus, we demonstrate that Nfil3 is a key regulator of the development of ILC subsets essential for immune protection in the lung and gut.


Figures

Figure 1.
Figure 1.
Characterization of secondary lymphoid organs in WT and Nfil3-deficient mice. (A) Gross, (B) histological and (C) immunohistological analysis of Peyer’s patch in WT (C57BL/6) and Nfil3−/− mice. (B and G) Histological sections of Peyer’s patch (B) and LN (G) were stained with H&E, and (C and G) confocal images were stained with anti-B220 (blue), anti-CD3ε (red), and anti–peanut agglutinin (PNA, green). Bar, 500 µm. (C) Inset shown in higher magnification (×2) in right panel. (B, C, and G) H&E sections are representative of analyses performed on five mice/genotype; immunohistochemistry was performed on two mice/genotype. (D) Enumeration of the number of Peyer’s patch, (E) Peyer’s patch domes, and (F) total cells. (D–F) Data show mean ± SEM pooled from 2–4 independent experiments (n = 3–4 mice/genotype). Statistical differences were calculated using an unpaired Student’s t test. (H) Flow cytometric analyses of B and T cell subsets in Peyer’s patch of naive C57BL/6 and Nfil3−/− mice. (I) Enumeration of the total B (mean ± SEM of 3–9 mice/genotype pooled from 2 experiments) and T cell subsets (mean ± SEM of one of two similar experiments, n = 3–5 mice/genotype) within the Peyer’s patch. (J) Cumulative frequency of B and T cells from analyses in (I). Statistical differences were calculated with an unpaired Mann-Whitney U test. *, P < 0.05; **, P < 0.01; ***, P < 0.001; n.s., not significant.
Figure 2.
Figure 2.
Nfil3 is essential for the development of innate lymphocytes. (A) Quantitative PCR analysis of Nfil3, Idb2 (Id2), Gata3, and Rorγt in the indicated populations purified from the indicated tissues of Rorγtgfp/+ mice. The fold change relative to conventional NK cells is shown for each ILC subset. Data show the mean ± SEM of samples analyzed in triplicate, pooled from two independent experiments. (B) Flow cytometric analysis of total hematopoietic cells (top) and Lin (CD3CD19) CD45+ cells (bottom) isolated from the small intestine of WT or Nfil3-deficient mice and stained for intracellular expression of Rorγt. (C) Frequency of CD4+ (top) and KLRG1+ (bottom) cells within the NKp46Rorγt+ ILC3 and NKp46Rorγt cells, respectively. (D) Enumeration of total ILC1 (CD45+LinRorγtNKp46+), ILC2 (CD45+LinRorγtNKp46KLRG1+), CD4+ or CD4 ILC3 (CD45+LinRorγt+NKp46), and NCR+ ILC3 (CD45+LinRorγt+NKp46+) subsets isolated from the small intestine of WT and Nfil3−/− mice. Data are pooled from three experiments (n = 3–15 mice/genotype). Statistical differences were tested using an unpaired student’s t test. (E) Representative flow cytometric profiles of ILC populations isolated from the lamina propria of the colon. (F) Total cell number and frequency of ILC populations in colon. (E and F) Data show the mean ± SEM 4 mice/genotype from one of two similar experiments.. (G) Immunohistological (top) and cellular composition (bottom) of cryptopatches in Id2gfp/gfpNfil3+/+ and Id2gfp/gfpNfil3−/− mice. Sections were stained with anti-Rorγt, CD3ε, and NKp46 and confocal images were acquired. Id2-GFP represents endogenous expression. Sections show 2 of 5 mice analyzed for each genotype. Bar, 50 µm. Enumeration of the ILC and lymphocytes in cryptopatches show mean ± SEM of 15 images/genotype. Statistical differences were determined using an unpaired Student’s t test. (H) Expression of NKp46 and Gata-3 in Lin(CD3,CD19,Gr1) CD45+ cells isolated from the lungs of WT or Nfil3−/− mice (left) and total number of ILC1 (CD45+Lin NKp46+) and ILC2 (CD45+LinNKp46 Gata-3+) recovered from lungs of WT or Nfil3−/− mice (right). Data are representative of 3 independent experiments (n = 4 mice/genotype). (I) Flow cytometric analysis of ILC2 (CD45+LinThy1.2+KLRG1+Sca-1+) localized to visceral adipose tissue (left) and their frequency (right). Data are pooled from 2 independent experiments (n = 4 mice/genotype). (J) Frequency (left) and number (top right) of ILC2P (CD3CD19Gr1CD11bB220Ter119CD122Sca-1+CD127+CD25+) isolated from bone marrow of WT and Nfil3−/− mice. Id2-GFP expression within the ILC2P populations (bottom left). Data are pooled from 3 experiments showing the mean ± SEM (n = 5 WT; n = 10 Nfil3−/− mice). Statistical differences were calculated using a two-tailed Mann-Whitney U test. *, P < 0.05; **, P < 0.01; ***, P < 0.001.
Figure 3.
Figure 3.
Nfil3 regulation of ILC development is cell intrinsic. Lethally irradiated WT (Ly5.1+) recipient mice were reconstituted with an equal mix of WT (Ly5.1+Ly5.2+) and Nfil3−/− (Ly5.2+) bone marrow cells. After 8 wk, the proportion of ILC1, ILC2, and ILC3 were determined in the small intestinal lamina propria (A–C) and the lung (D and E). (A and C) Dot plots show representative profiles of ILC3 (A) and ILC2 (C, left) in Nfil3-sufficient and -deficient compartments gated on Lin (CD3CD19) CD45+ hematopoietic cells. (B) Frequency of ILC subsets within the WT (Ly5.1+Ly5.2+) and Nfil3−/− (Ly5.2+/+) populations in mixed chimeric mice. Data show the mean ± SEM (n = 3 mice/genotype) of one representative of two experiments. Statistical differences were tested using an unpaired student’s t test. (C) Expression of ST-2 within the KLRG1+Gata-3+ ILC2 subset (right). (D) Expression of NK1.1 and Gata-3 in Lin (CD3CD19Gr1) CD45+ cells isolated from the lungs and KLRG1 and ST2 expression on ILC2 (bottom). (E) Frequency of the different ILC1 and ILC2 in lung in each WT (Nfil3+/+) and Nfil3−/− compartment in mixed chimeras. (A–E) Analyses show representative profiles of two experiments with 6 mice/genotype. (F and G) Flow cytometrically purified CLP (LinCD127+Flt3/Flk2+Sca1intCD117int) isolated from bone marrow of Id2gfp/gfp mice were adoptively transferred into Rag2γc−/− mice. After 2 wk, the reconstitution of ILC subsets in the small intestinal lamina propria was analyzed. Representative flow cytometric plots show the proportion of total Id2-GFP+CD45+Lin (CD3CD19CD11cGr1) ILC (top) and ILC subsets within that gate (bottom) in WT and Nfil3−/− mice. (F) Data show representative flow cytometric profiles from (G) individuals pooled from two experiments and show mean ± SEM (n = 4 mice/genotype). Statistical differences were tested using an unpaired Student’s t test. *, P < 0.05; **, P < 0.01; ***, P < 0.001; n.s., not significant.
Figure 4.
Figure 4.
Nfil3−/− mice fail to mount effective immune responses in the absence of ILC2 and ILC3. (A) Representative flow cytometric profiles of eosinophils recovered in the lungs of Papain-treated WT and Nfil3−/− mice 1 d after the final treatment (left). Profiles are gated on CD45+ total live cells. Total number of eosinophils recovered from lungs showing mean ± SEM (right). (B) Expression of IL-5 and IL-13 among CD45+CD3CD19 hematopoietic cells stained for intracellular Gata-3 (left). Total number of IL-5– and IL-13–expressing ILC2 in the lung (right). (A and B) Data show the mean ± SEM of data from 1 of 2 independent experiments (n = 4 mice/genotype). (C) IL-22 cytokine production by ILCs isolated from the small intestine of WT and Nfil3−/− mice gated on Lin (CD3CD19) CD45+ cells 8 d after intragastric infection with C. rodentium. Cells were stimulated with IL-23 ex vivo in the presence of Brefeldin A. (D) Enumeration of the number of ILCs found in the intestine 8 d after infection of Nfil3−/− and WT mice with C. rodentium. (E) Enumeration of the number of IL-22–producing ILC3 cells recovered from the small intestine after infection. (F) Bacterial load in spleen, (G) colon length, and (H) weight loss in WT and Nfil3−/− mice after C. rodentium infection. (I) Representative H&E staining of the colon of C. rodentium–infected WT and Nfil3−/− mice on day 8. Bar, 1,000 µm; inset magnification 3.4×. Arrow indicates site of damage; * shows damage and lymphocyte infiltration. (C–I) Data are representative of two independent experiments (n = 3–4 mice/genotype). Error bars show the mean ± SEM. Statistical differences were tested using an unpaired Student’s t test. n.s. not significant. *, P < 0.05; **, P < 0.01.
Figure 5.
Figure 5.
Expansion of ILC populations after IL-2–IL-2mAb complex stimulation. WT and Nfil3−/− mice were injected i.p. for 2–3 wk with PBS or IL-2–JES6-1 to stimulate ILC expansion. (A) The proportion of ILC2P (CD3CD19Gr1CD11bB220Ter119CD122 cells) in the bone marrow, (B) ILC1 and ILC2 (CD45+CD3CD19Gr1 cells) in lung, and (C) mesenteric LNs (mLN) of cytokine complex-treated and control PBS-treated WT and Nfil3−/− mice. (D) Total number of ILC1 and ILC2 in the lung and mLNs of treated mice. (A–D) Data show representative flow cytometric profiles or mean ± SEM pooled from 2 independent experiments (n = 4 mice/genotype). Statistical differences were calculated using a two-tailed Mann-Whitney U test. *, P < 0.05; **, P < 0.01; ***, P < 0.001.

References

    1. Boyman, O., Kovar M., Rubinstein M.P., Surh C.D., and Sprent J.. 2006. Selective stimulation of T cell subsets with antibody-cytokine immune complexes. Science. 311:1924–1927 10.1126/science.1122927 - DOI - PubMed
    1. Carotta, S., Pang S.H., Nutt S.L., and Belz G.T.. 2011. Identification of the earliest NK-cell precursor in the mouse BM. Blood. 117:5449–5452 10.1182/blood-2010-11-318956 - DOI - PubMed
    1. Eberl, G., Marmon S., Sunshine M.-J., Rennert P.D., Choi Y., and Littman D.R.. 2004. An essential function for the nuclear receptor RORgamma(t) in the generation of fetal lymphoid tissue inducer cells. Nat. Immunol. 5:64–73 10.1038/ni1022 - DOI - PubMed
    1. Finke, D., Acha-Orbea H., Mattis A., Lipp M., and Kraehenbuhl J.. 2002. CD4+CD3− cells induce Peyer’s patch development: role of alpha4beta1 integrin activation by CXCR5. Immunity. 17:363–373 10.1016/S1074-7613(02)00395-3 - DOI - PubMed
    1. Firth, M.A., Madera S., Beaulieu A.M., Gasteiger G., Castillo E.F., Schluns K.S., Kubo M., Rothman P.B., Vivier E., and Sun J.C.. 2013. Nfil3-independent lineage maintenance and antiviral response of natural killer cells. J. Exp. Med. 210:2981–2990 10.1084/jem.20130417 - DOI - PMC - PubMed

Publication types

MeSH terms

Substances