. 2014 Aug 5;12(8):e1001921.
doi: 10.1371/journal.pbio.1001921. eCollection 2014 Aug.

Carbonic anhydrase generates CO2 and H+ that drive spider silk formation via opposite effects on the terminal domains

Affiliations

Carbonic anhydrase generates CO2 and H+ that drive spider silk formation via opposite effects on the terminal domains

Marlene Andersson et al. PLoS Biol. .

Abstract

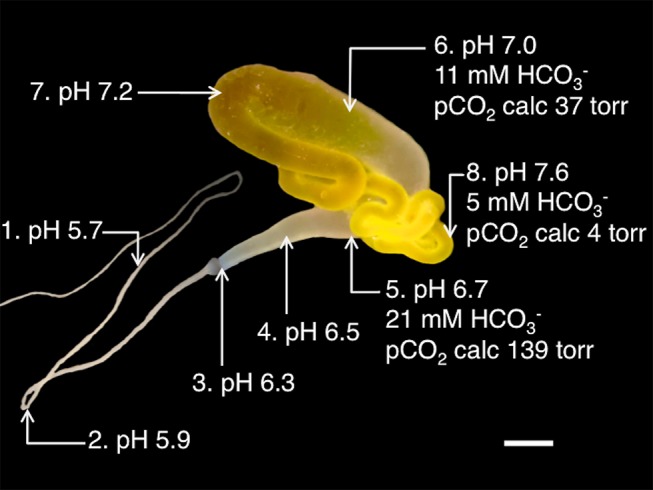
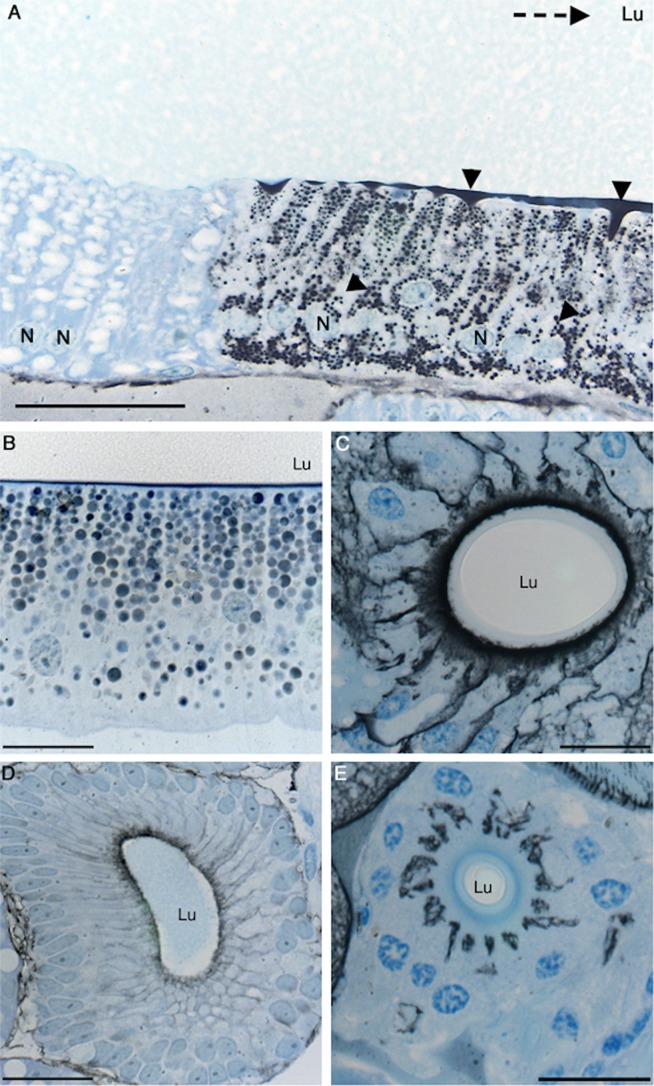
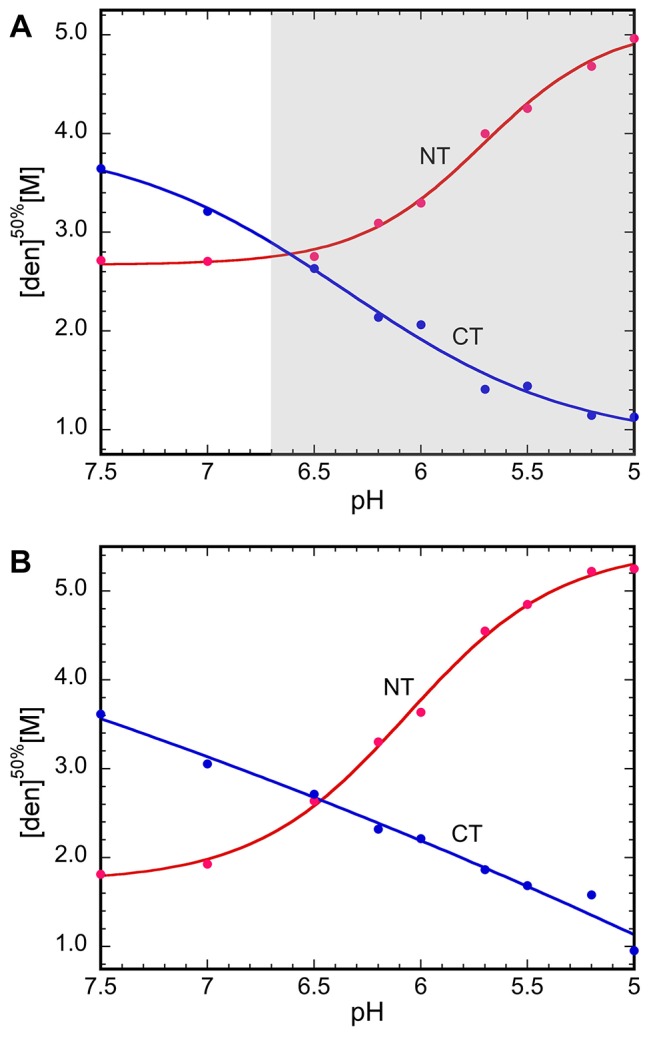
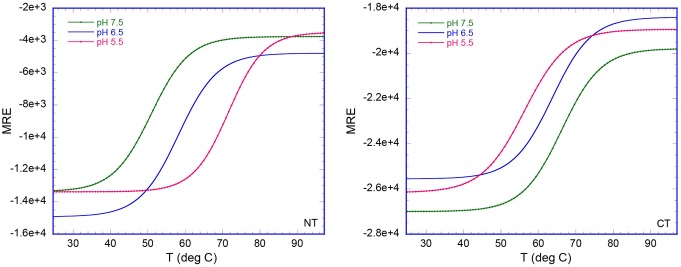
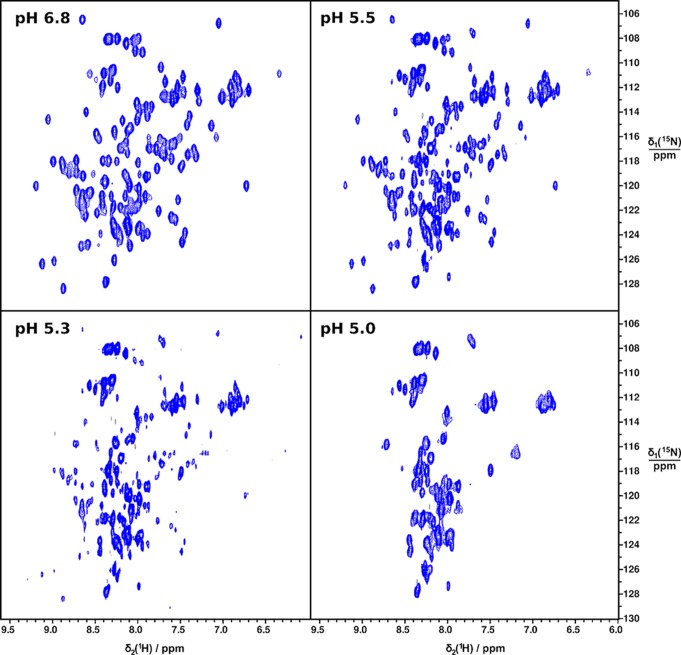
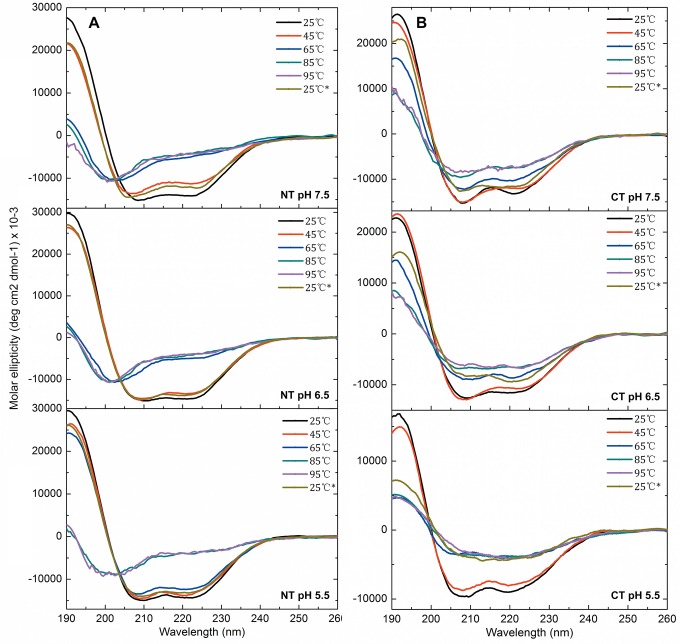
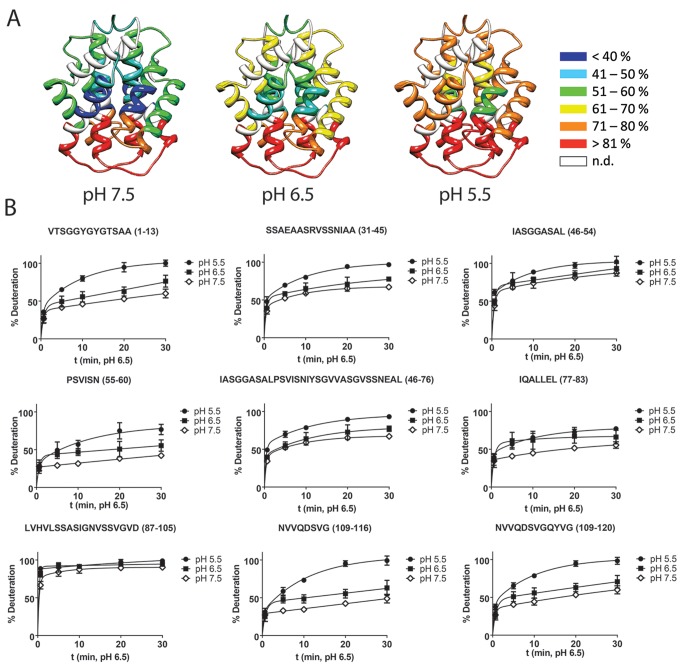
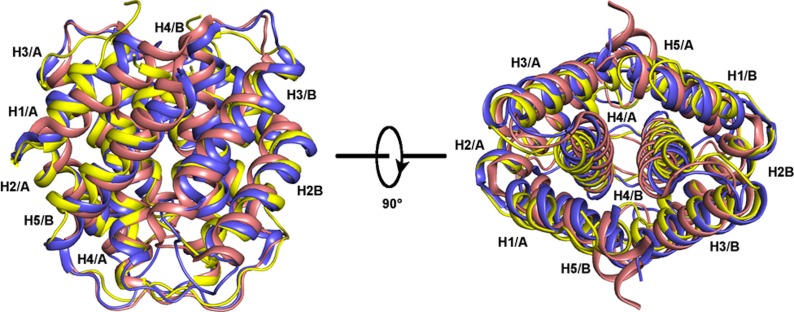
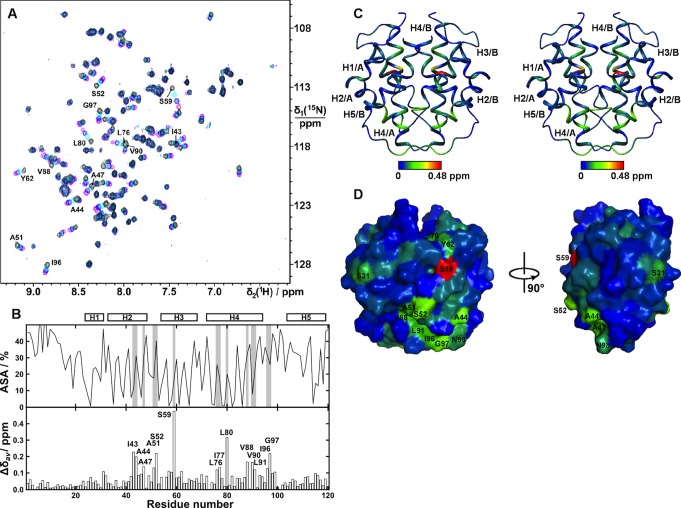
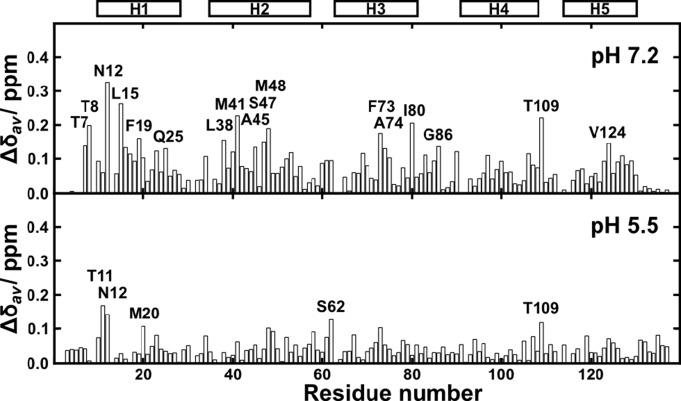
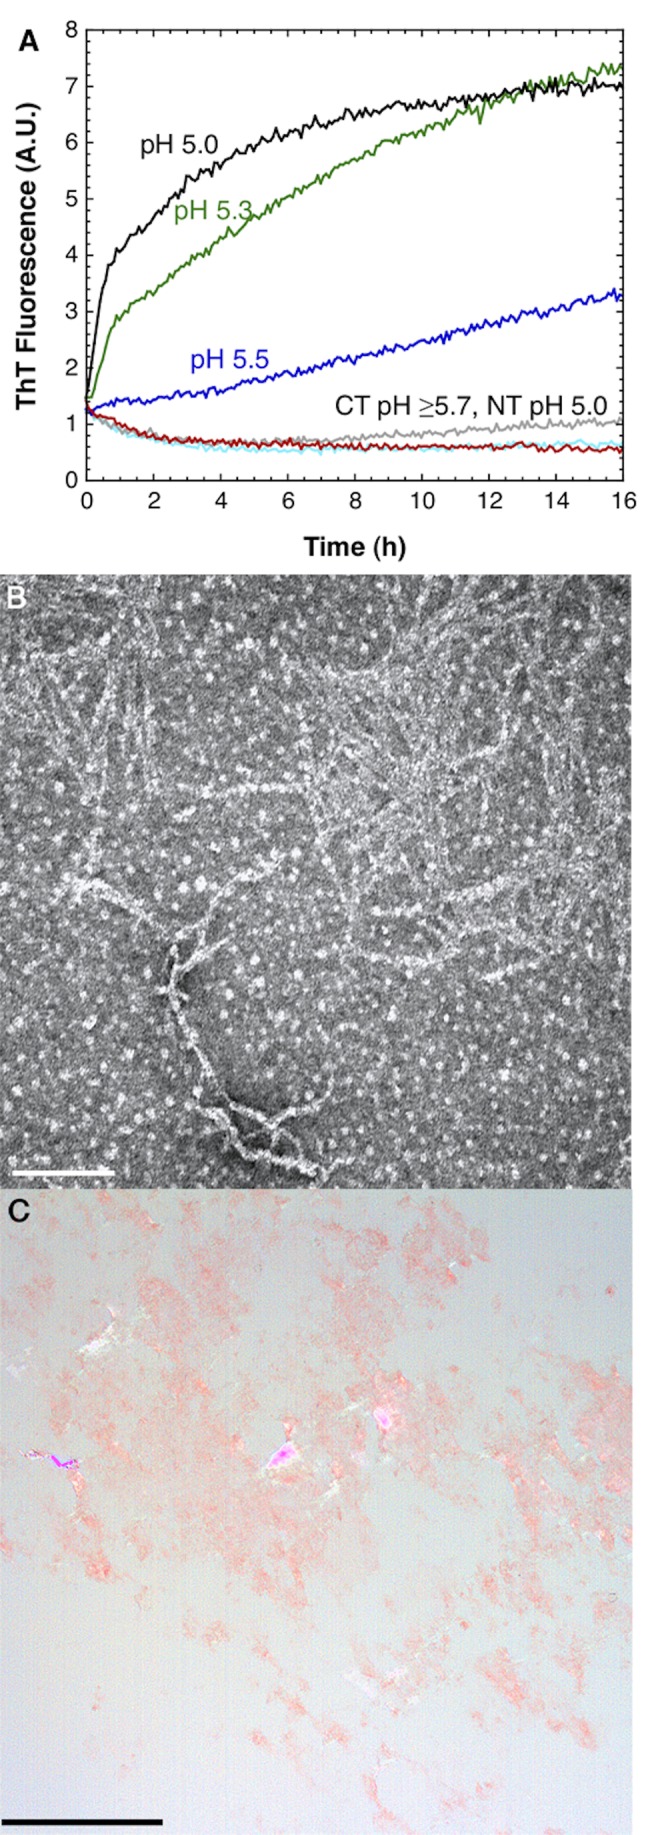
Spider silk fibers are produced from soluble proteins (spidroins) under ambient conditions in a complex but poorly understood process. Spidroins are highly repetitive in sequence but capped by nonrepetitive N- and C-terminal domains (NT and CT) that are suggested to regulate fiber conversion in similar manners. By using ion selective microelectrodes we found that the pH gradient in the silk gland is much broader than previously known. Surprisingly, the terminal domains respond in opposite ways when pH is decreased from 7 to 5: Urea denaturation and temperature stability assays show that NT dimers get significantly stabilized and then lock the spidroins into multimers, whereas CT on the other hand is destabilized and unfolds into ThT-positive β-sheet amyloid fibrils, which can trigger fiber formation. There is a high carbon dioxide pressure (pCO2) in distal parts of the gland, and a CO2 analogue interacts with buried regions in CT as determined by nuclear magnetic resonance (NMR) spectroscopy. Activity staining of histological sections and inhibition experiments reveal that the pH gradient is created by carbonic anhydrase. Carbonic anhydrase activity emerges in the same region of the gland as the opposite effects on NT and CT stability occur. These synchronous events suggest a novel CO2 and proton-dependent lock and trigger mechanism of spider silk formation.


Conflict of interest statement

The authors have declared that no competing interests exist.

Figures

Figure 1
Figure 1. pH, bicarbonate, and carbon dioxide in major ampullate glands.
Photograph of a major ampullate gland in which measured pH and HCO3 values and calculated pCO2 values at different locations are indicated. See Table 1 for details of ISM measurements. Scale bar, 1 mm.
Figure 2
Figure 2. CA in spider silk glands.
CA activity and Azure blue staining of histological sections from (A) the sac of a Tegenaria sp. major ampullate gland, (B) E. australis minor ampullate gland, (C) A. diadematus aggregate gland duct, (D) Tegenaria sp. tubuliform gland, and (E) the third limb of the duct of an A. diadematus major ampullate gland. Black precipitates represent CA activity (arrow heads). In (A) the glandular lumen is labeled and the dotted arrow points towards the duct. Nuclei are indicated by (N) and the lumen by (Lu). Scale bar, (A) 50 µm and (B–E) 20 µm.
Figure 3
Figure 3. NT and CT respond differently to lowered pH.
Stability of NT and CT (from A. ventricosus) in (A) 20 mM HEPES/MES buffer with 154 mM NaCl and (B) the same buffer without NaCl, measured with Trp fluorescence and CD spectroscopy at 222 nm, respectively, presented as urea concentrations for apparent half-denaturation ([den]50%, see Materials and Methods for details on how [den]50% was determined) as a function of pH. The pH region in which CA activity is found in major ampullate glands is indicated by a shaded area in (A).
Figure 4
Figure 4. Temperature-induced unfolding of NT and CT.
The CD signal was measured at 222 nm at pH 7.5, 6.5, and 5.5 and converted to mean residue ellipticity (MRE) in deg × cm2/dmol.
Figure 5
Figure 5. 2D [15N-1H]-HSQC NMR spectra of CT at different pH.
Figure 6
Figure 6. CD spectra of NT and CT.
The residual molar ellipticity was measured at 25, 45, 65, 85, and 95°C and at 25°C after cooling for (A) NT and (B) CT at pH 7.5, 6.5, and 5.5 from top to bottom.
Figure 7
Figure 7. Summary of HDX ESI MS data for CT.
(A) Deuterium incorporation in A. ventricosus MiSp CT at each pH. The degree of deuteration of the peptic peptides at pH 7.5, 6.5, and 5.5 is indicated according to the color code on the right. (B) Deuterium uptake graphs for the major peptic peptide species at pH 7.5, 6.5, and 5.5. Graphs show the average of three repeats. The error bars indicate the standard deviations. The corresponding peptic peptide sequences are given above each graph.
Figure 8
Figure 8. Superposition of MiSp CT structures from A. ventricosus (yellow) and N. antipodiana (blue, PDB code 2M0M) and the MaSp CT structure from A. diadematus (pink, PDB code 2KHM).
Helices are shown as ribbons and labeled H1–H5. The letter A/B indicates the subunit.
Figure 9
Figure 9. CT interacts with CS2.
(A) Overlay of 2D [15N-1H]-HSQC NMR spectra of MiSp CT with CS2 added to concentrations of 0 mM (magenta), 50 mM (blue), 100 mM (cyan), and 200 mM (black). (B, Top) Accessible surface area (ASA) for individual amino acid residues, expressed as percentage of the total surface area of each residue. The most perturbed regions are shaded in grey. (B, Bottom) Chemical shift perturbations of MiSp CT backbone amides upon addition of CS2 (0 to 200 mM). The most perturbed residues are labeled and positions of helices 1–5 are indicated above the plot. (C) Stereoview of the MiSp CT structure, color-coded to reflect the backbone amide chemical shift perturbations of (B). (D) Surface view of A. ventricosus MiSp CT, color-coded to reflect the backbone amide chemical shift perturbations from (B). The surfaces of the most perturbed residues are labeled.
Figure 10
Figure 10. CS2 effects on NT.
Chemical shift perturbations of MaSp NT backbone amides at pH 7.2 and 300 mM NaCl (upper panel) and pH 5.5 (lower panel) upon addition of CS2 (0 to 200 mM). The most perturbed residues are labeled, and positions of helices 1–5 are indicated above the plot.
Figure 11
Figure 11. CT forms amyloid-like fibrils at low pH.
(A) ThT fluorescence for CT at pH 6.0, 5.7, 5.5, 5.3, and 5.0, and NT at pH 5.0, in sodium acetate buffer. (B) Transmission electron micrograph showing fibrils formed from CT incubated at pH 5.5. Scale bar, 200 nm. (C) Congo red stained fibrils formed by CT at pH 5.5, viewed under crossed polarizers. Green birefringence is visible. Scale bar, 50 µm.

References

    1. Simmons AH, Michal CA, Jelinski LW (1996) Molecular orientation and two-component nature of the crystalline fraction of spider dragline silk. Science 271(5245): 84–87. - PubMed
    1. Bell AL, Peakall DB (1969) Changes in fine structure during silk protein production in the ampullate gland of the spider Araneus sericatus. J Cell Biol 42(1): 284–295. - PMC - PubMed
    1. Hijirida DH, Do KG, Michal C, Wong S, Zax D, et al. (1996) 13C NMR of Nephila clavipes major ampullate silk gland. Biophys J 71(6): 3442–3447. - PMC - PubMed
    1. Hagn F, Eisoldt L, Hardy J, Vendrely C, Coles M, et al. (2010) A conserved spider silk domain acts as a molecular switch that controls fibre assembly. Nature 465: 239–242. - PubMed
    1. Askarieh G, Hedhammar M, Nordling K, Saenz A, Casals C, et al. (2010) Self-assembly of spider silk proteins is controlled by a pH-sensitive relay. Nature 465: 236–238. - PubMed

Publication types

MeSH terms