Review
. 2014 Sep;4(7):487-98.
doi: 10.1089/brain.2014.0288.

Neuronal or hemodynamic? Grappling with the functional MRI signal

Affiliations
Review

Neuronal or hemodynamic? Grappling with the functional MRI signal

Peter A Bandettini. Brain Connect. 2014 Sep.

Abstract

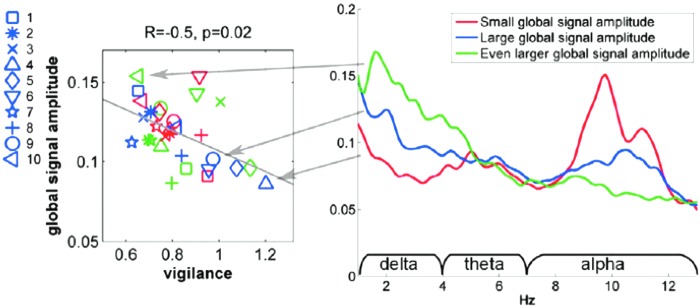
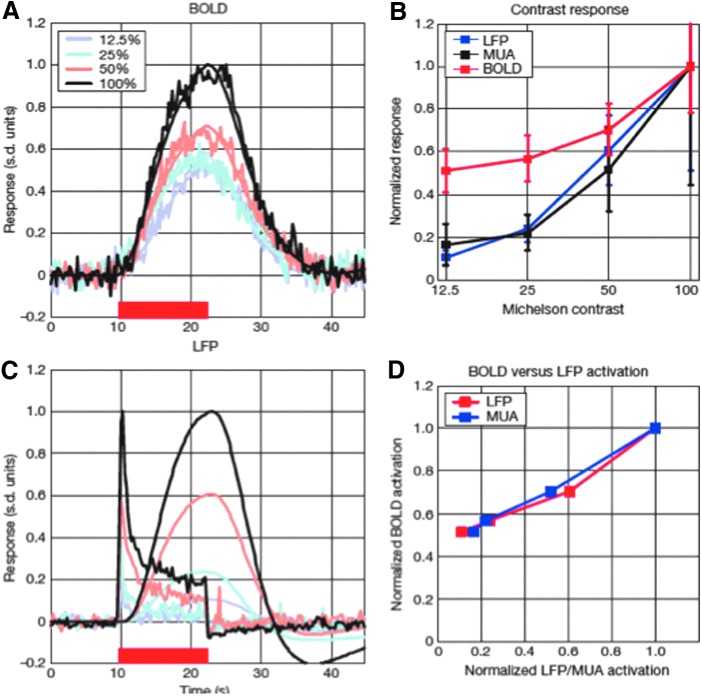
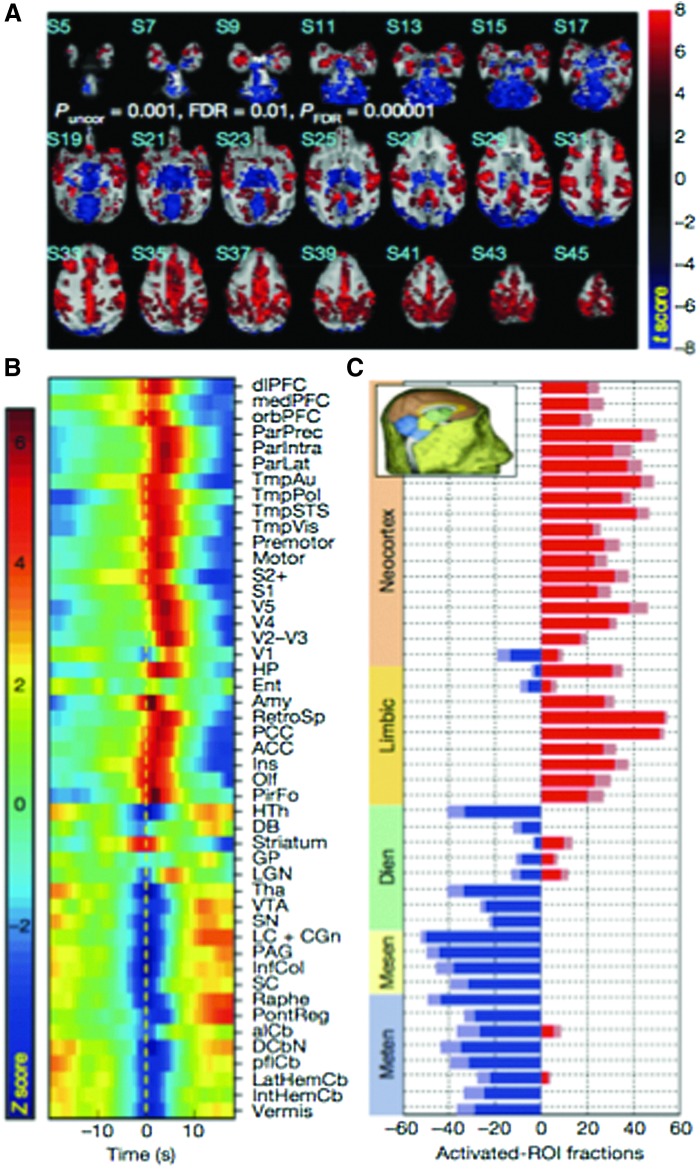
Magnetic resonance imaging (MRI) and functional MRI (fMRI) continue to advance because creative physicists, engineers, neuroscientists, clinicians, and physiologists find new ways for extracting more information from the signal. Innovations in pulse sequence design, paradigm design, and processing methods have advanced the field and firmly established fMRI as a cornerstone for understanding the human brain. In this article, the field of fMRI is described through consideration of the central problem of separating hemodynamic from neuronal information. Discussed here are examples of how pulse sequences, activation paradigms, and processing methods are integrated such that novel, high-quality information can be obtained. Examples include the extraction of information such as activation onset latency, metabolic rate, neuronal adaptation, vascular patency, vessel diameter, vigilance, and subvoxel activation. Experimental measures include time series latency, hemodynamic shape, MR phase, multivoxel patterns, ratios of activation-related R2* to R2, metabolic rate changes, fluctuation correlations and frequencies, changes in fluctuation correlations and frequencies over time, resting correlation states, echo time dependence, and more.

Keywords: blood; brain; fMRI; hemodynamic; high-resolution; multimodal; neurovascular coupling.


Figures

<b>FIG. 1.</b>
FIG. 1.
Whole-brain activation revealed by 9 h of averaging and model relaxation. Note that the responses, while diverse, cluster according to specific brain regions. (A) Axial view of a map of the significant signal changes throughout the entire cortex to a simple motor response to a visual decision task. (B) Corresponding Saggital view of the same map. (C) Time courses corresponding to colored regions in the brain. Note that all the different neuronal response timings that pass threshold. Reproduced with permission from Figure 4 of Gonzalez-Castillo and coworkers (2012).
<b>FIG. 2.</b>
FIG. 2.
Bilateral finger tapping at an on/off rate of 0.062 Hz reveals a peak at the fundamental frequency and peaks out to later harmonics, suggesting transient activity. Maps of the spectral density, “a” is the fundamental and “b” is the first harmonic—show different regions associated with each. Reproduced with permission from Figure 9 of Bandettini and associates (1993).
<b>FIG. 3.</b>
FIG. 3.
The growth of functional magnetic resonance imaging (fMRI) and connectivity fMRI. Data obtained using Scopus and search terms “fMRI” or “functional MRI” for fMRI and “resting state fMRI” or “connectivity AND fMRI” or “spontaneous fluctuations AND fMRI.”
<b>FIG. 4.</b>
FIG. 4.
Correlations of anterior cingulate with the brain. (A) Red highlight shows the seed region. (B) The correlation maps with the entire time series. (C) Windowed correlation maps demonstrating clear changes in correlations over time. Specifically, the blue circled image shows clearly the motor cortex region demonstrating a periodic anticorrelation with anterior cingulate. (D) Time series signal of the anterior cingulate and the motor cortex. (E) Time series of correlation values between the anterior cingulate and motor cortex. While the average correlation is zero, the signals increase and decrease; however, it is difficult to infer that the networks are communicating. They may just be beating against each other. Reproduced with permission from Figure 1 of Handwerker and coworkers (2012).
<b>FIG. 5.</b>
FIG. 5.
Global signal versus electroencephalography-related vigilance measures showing a clear relationship between global signal amplitude and vigilance. Reproduced with permission from Figure 5 of Wong and associates (2013).
<b>FIG. 6.</b>
FIG. 6.
BOLD responses to stimuli with four different contrasts. On left (A and C) is the raw signal and on the right (B and D) are the comparisons. Note that in (D), the relationship between the electrophysiologic measures and BOLD is linear, yet, clearly, to reach the zero point, the relationship needs to change, suggesting a high level of nonlinearity at low levels of neuronal activity. Reproduced with permission from Figure 5 of Logothetis and colleagues (2001).
<b>FIG. 7.</b>
FIG. 7.
Activation maps and relative activations from cortical and subcortical regions that correspond to transient hippocampal ripples during sleep. (A) Shows fMRI activation maps of regions that were both positively and negatively correlated with the hippocampal ripples. (B) Shows the statistical significance and relative phase of the maximum fMRI correlation across multiple regions. (C) Shows the magnitude and sign of the correlation with the hippocampal ripples broken down by hierarchy of the structure. Reproduced with permission from Figure 3 of Logothetis and coworkers (2012).

References

    1. Allen EA, Plis SM, Erhardt EB, Eichele T, Calhoun VD. 2014. Tracking whole-brain connectivity dynamics in the resting state. Cereb Cortex 24:663–676 - PMC - PubMed
    1. Bandettini PA, Jesmanowicz A, Wong EC, Hyde JS. 1993. Processing strategies for time-course data sets in functional MRI of the human brain. Magn Reson Med 30:161–173 - PubMed
    1. Bandettini PA, Wong EC. 1997. A hypercapnia-based normalization method for improved spatial localization of human brain activation with fMRI. NMR Biomed 10:197–203 - PubMed
    1. Bellgowan PSF, Saad ZS, Bandettini PA. 2003. Understanding neural system dynamics through task modulation and measurement of functional MRI amplitude, latency, and width. Proc Natl Acad Sci U S A 100:1415–1419 - PMC - PubMed
    1. Birn RM, Bandettini PA. 2005. The effect of stimulus duty cycle and off duration on BOLD response linearity. Neuroimage 27:70–82 - PubMed

Publication types

LinkOut - more resources