

Envelope enhancement increases cortical sensitivity to interaural envelope delays with acoustic and electric hearing
- PMID: 25093417
- PMCID: PMC4122409
- DOI: 10.1371/journal.pone.0104097
Envelope enhancement increases cortical sensitivity to interaural envelope delays with acoustic and electric hearing
Abstract
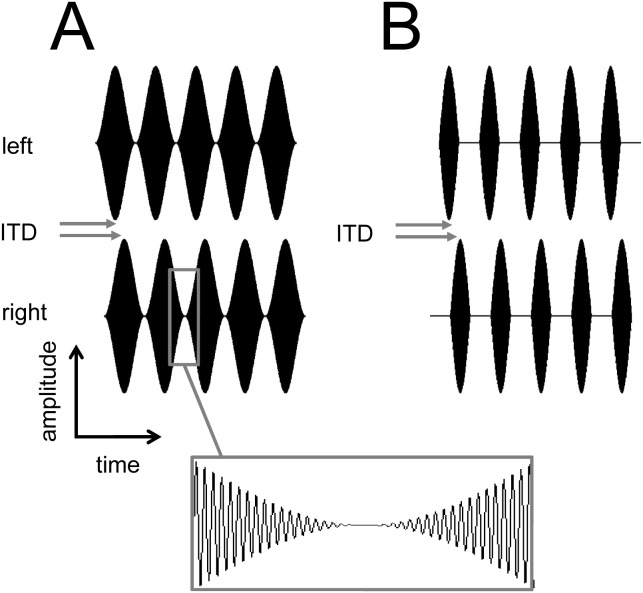
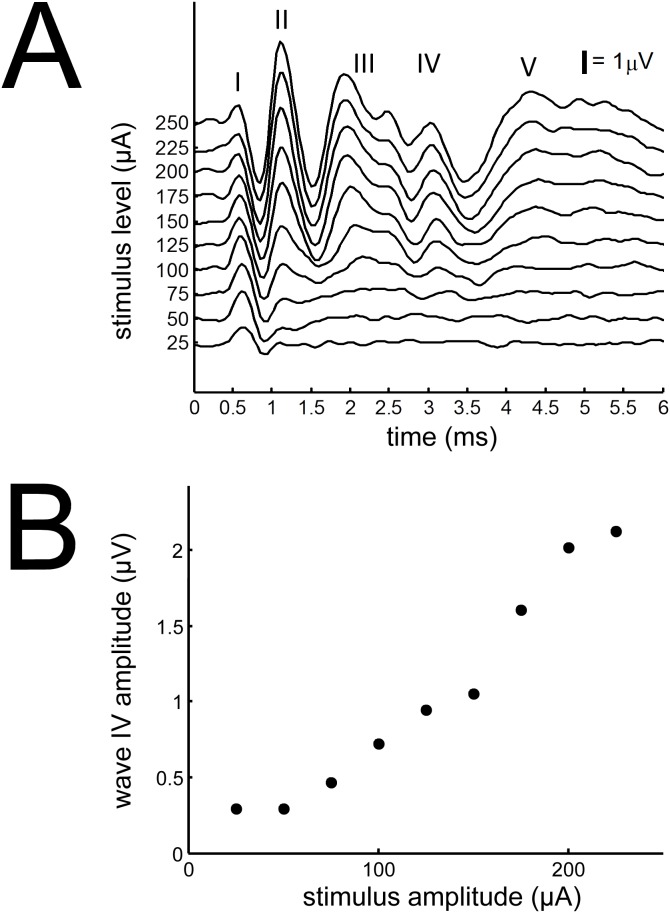
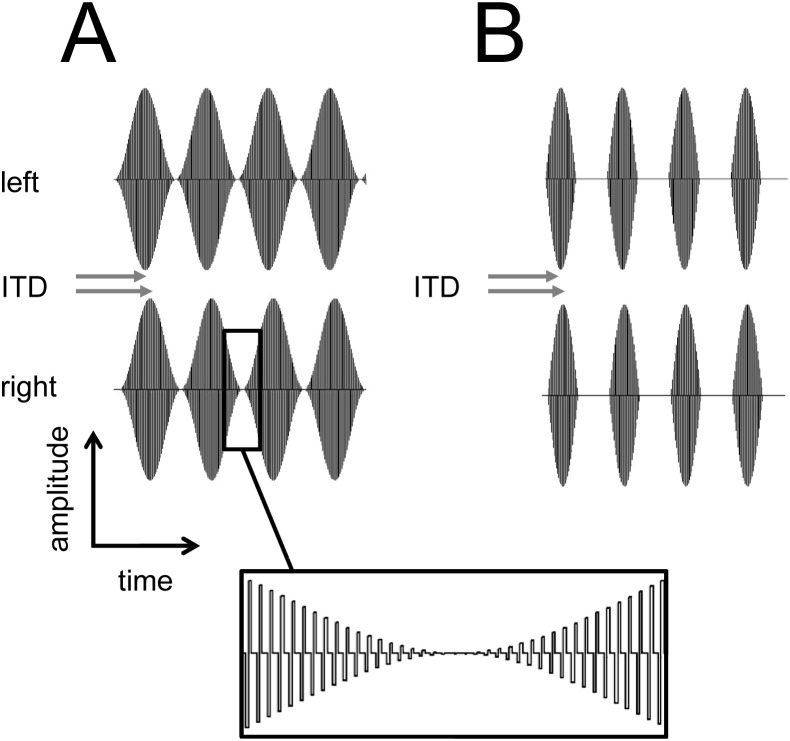
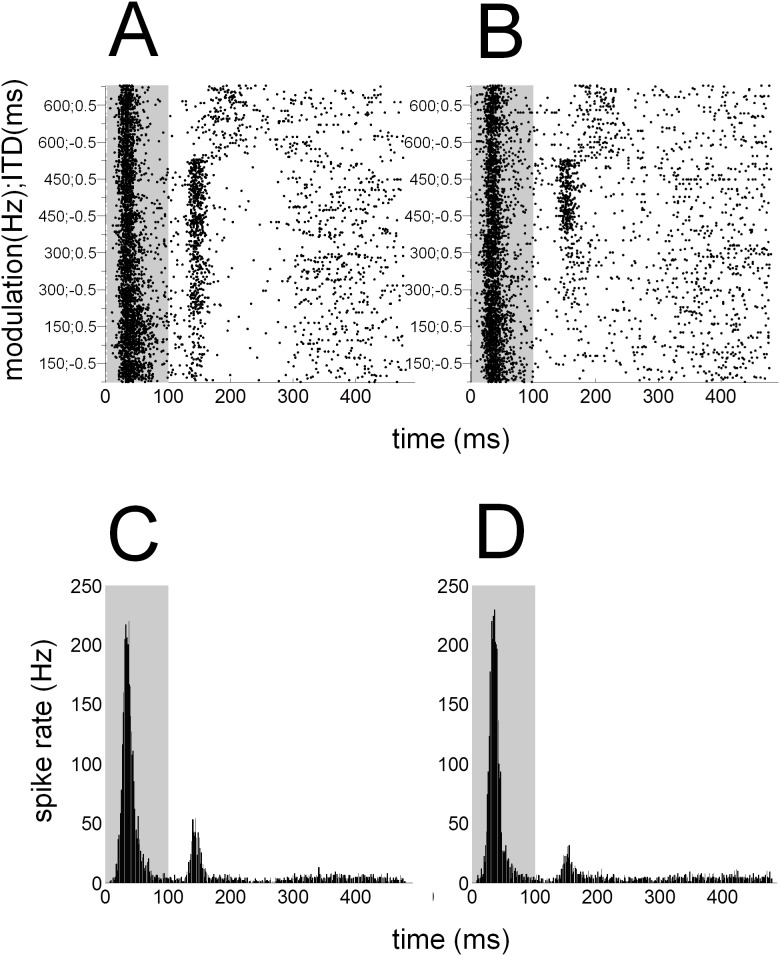
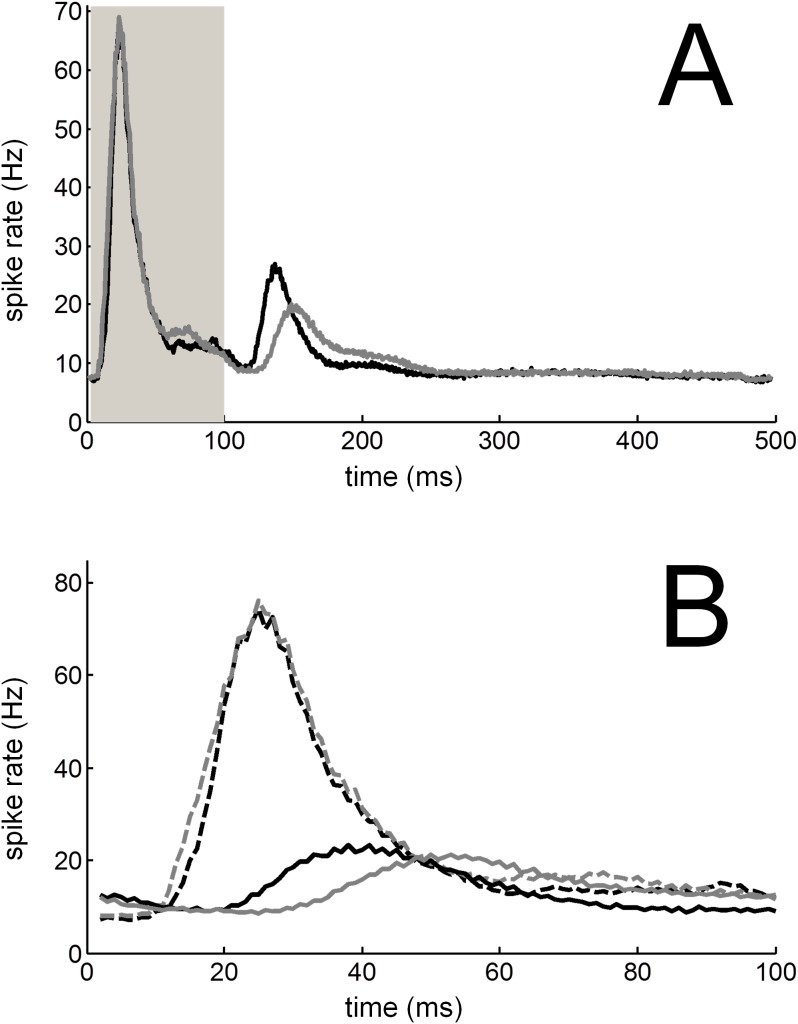
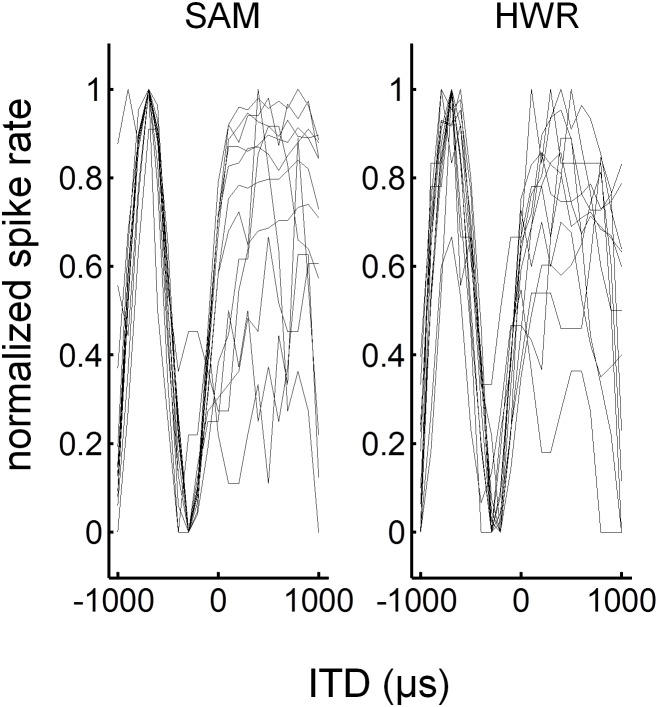
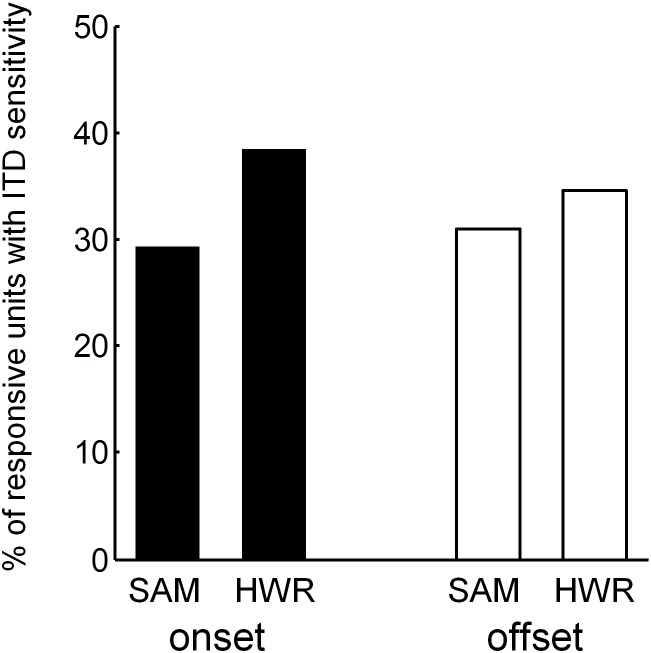
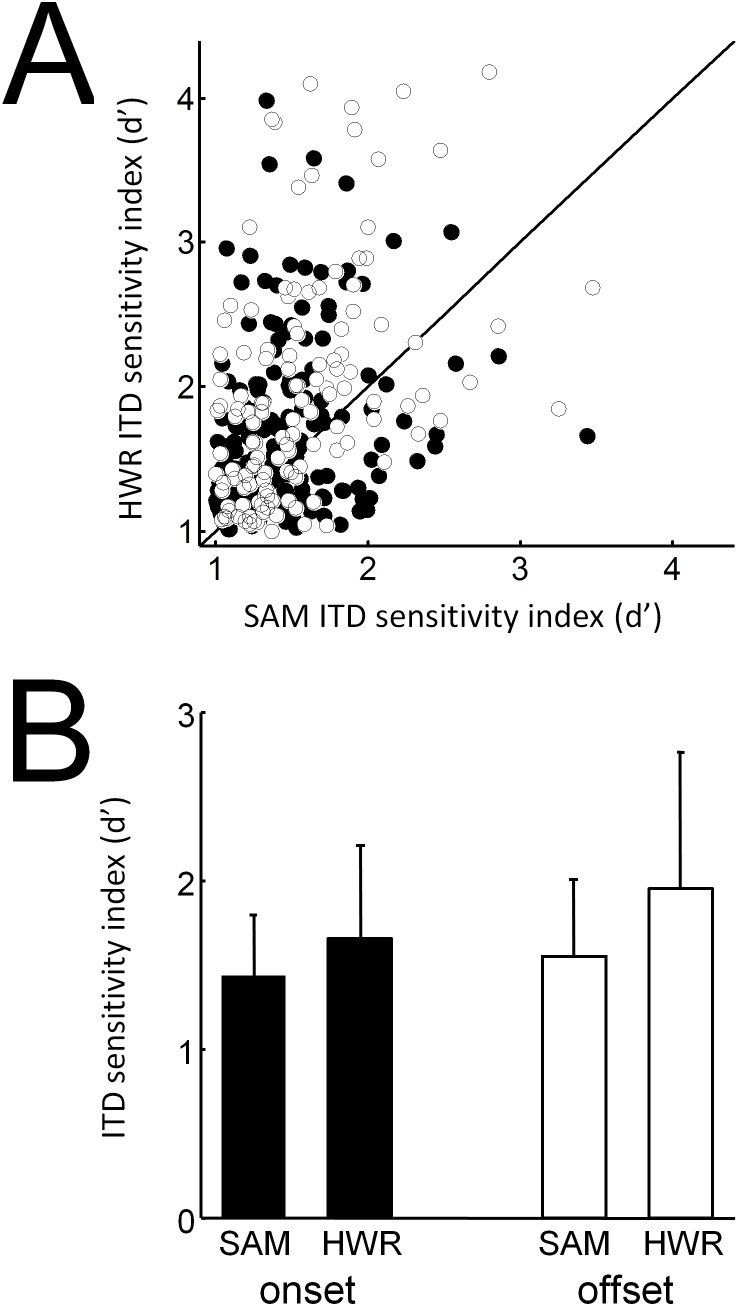
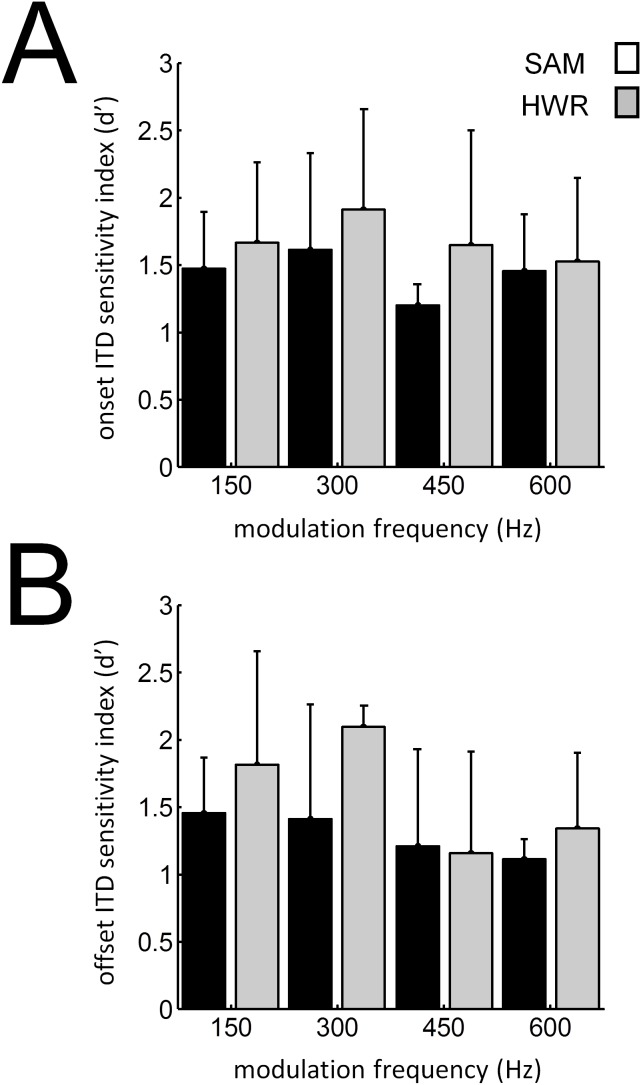
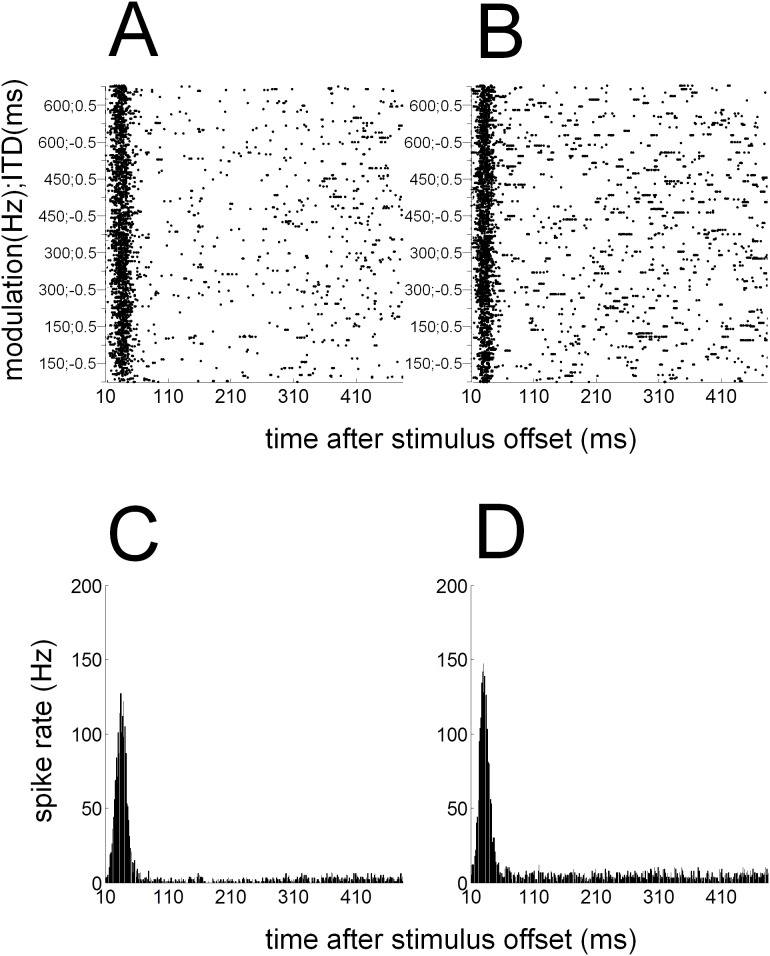
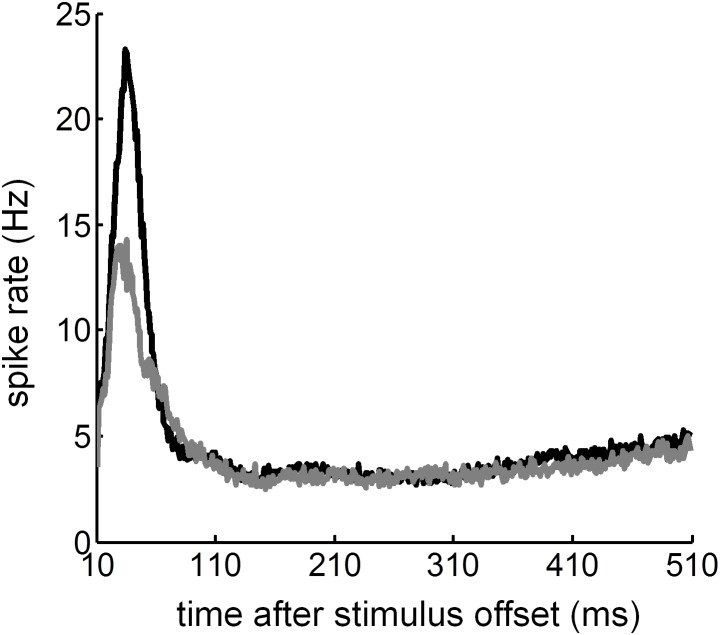
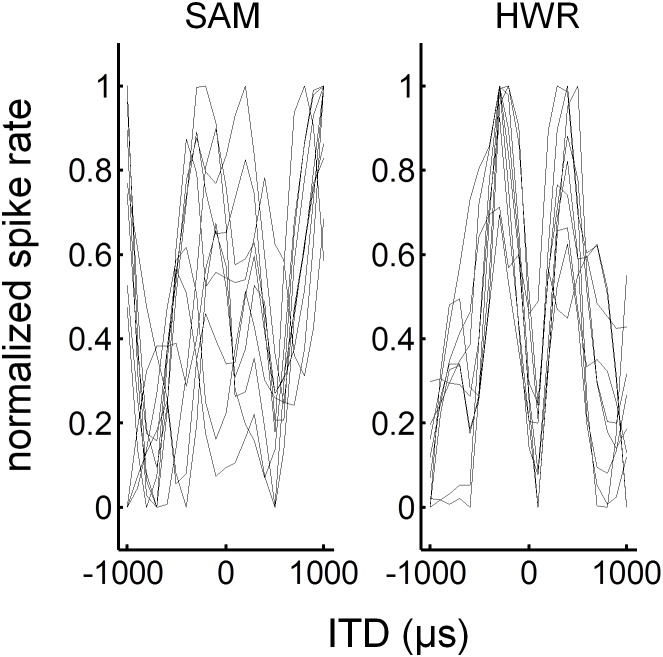
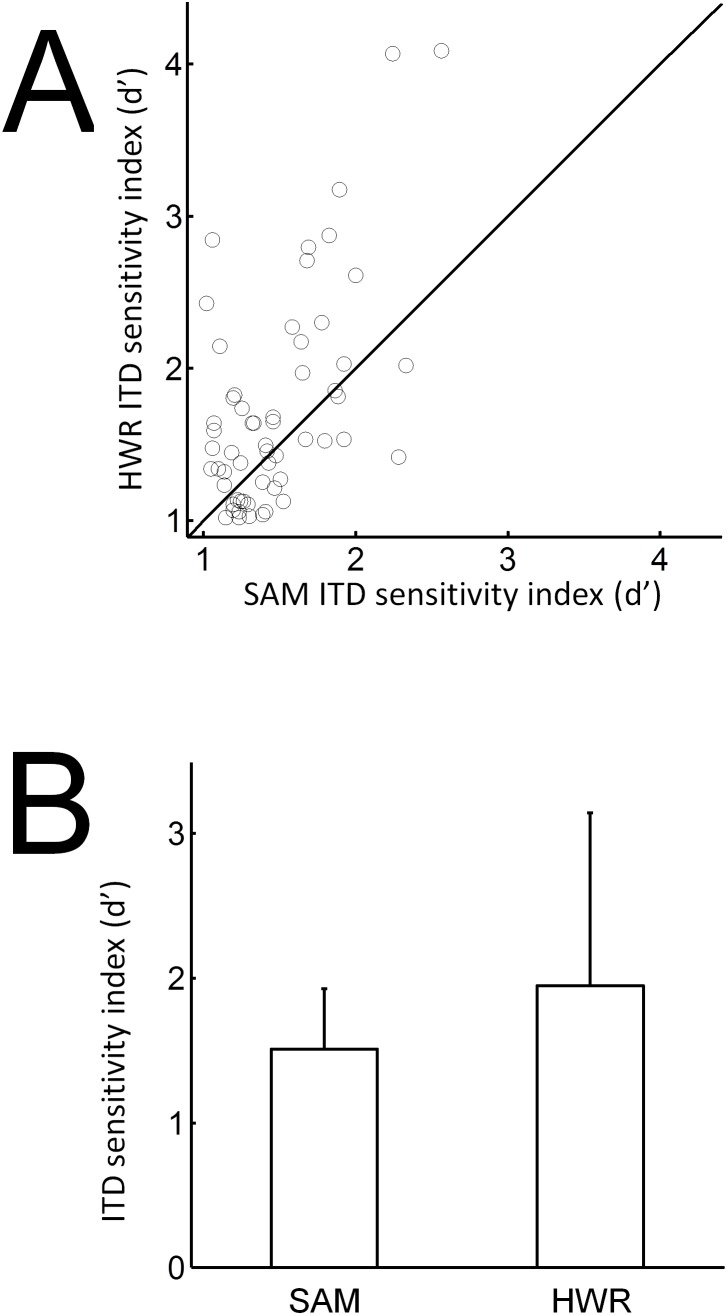
Evidence from human psychophysical and animal electrophysiological studies suggests that sensitivity to interaural time delay (ITD) in the modulating envelope of a high-frequency carrier can be enhanced using half-wave rectified stimuli. Recent evidence has shown potential benefits of equivalent electrical stimuli to deaf individuals with bilateral cochlear implants (CIs). In the current study we assessed the effects of envelope shape on ITD sensitivity in the primary auditory cortex of normal-hearing ferrets, and profoundly-deaf animals with bilateral CIs. In normal-hearing animals, cortical sensitivity to ITDs (±1 ms in 0.1-ms steps) was assessed in response to dichotically-presented i) sinusoidal amplitude-modulated (SAM) and ii) half-wave rectified (HWR) tones (100-ms duration; 70 dB SPL) presented at the best-frequency of the unit over a range of modulation frequencies. In separate experiments, adult ferrets were deafened with neomycin administration and bilaterally-implanted with intra-cochlear electrode arrays. Electrically-evoked auditory brainstem responses (EABRs) were recorded in response to bipolar electrical stimulation of the apical pair of electrodes with singe biphasic current pulses (40 µs per phase) over a range of current levels to measure hearing thresholds. Subsequently, we recorded cortical sensitivity to ITDs (±800 µs in 80-µs steps) within the envelope of SAM and HWR biphasic-pulse trains (40 µs per phase; 6000 pulses per second, 100-ms duration) over a range of modulation frequencies. In normal-hearing animals, nearly a third of cortical neurons were sensitive to envelope-ITDs in response to SAM tones. In deaf animals with bilateral CI, the proportion of ITD-sensitive cortical neurons was approximately a fifth in response to SAM pulse trains. In normal-hearing and deaf animals with bilateral CI the proportion of ITD sensitive units and neural sensitivity to ITDs increased in response to HWR, compared with SAM stimuli. Consequently, novel stimulation strategies based on envelope enhancement may prove beneficial to individuals with bilateral cochlear implants.
Conflict of interest statement
Figures
Similar articles
-
Neural Processing of Acoustic and Electric Interaural Time Differences in Normal-Hearing Gerbils.J Neurosci. 2018 Aug 1;38(31):6949-6966. doi: 10.1523/JNEUROSCI.3328-17.2018. Epub 2018 Jun 29. J Neurosci. 2018. PMID: 29959238 Free PMC article.
-
Rate dependent neural responses of interaural-time-difference cues in fine-structure and envelope.PeerJ. 2024 Apr 24;12:e17104. doi: 10.7717/peerj.17104. eCollection 2024. PeerJ. 2024. PMID: 38680894 Free PMC article.
-
Neuronal sensitivity to interaural time differences in the sound envelope in the auditory cortex of the pallid bat.Hear Res. 2000 May;143(1-2):43-57. doi: 10.1016/s0378-5955(00)00021-6. Hear Res. 2000. PMID: 10771183
-
Perception and coding of interaural time differences with bilateral cochlear implants.Hear Res. 2015 Apr;322:138-50. doi: 10.1016/j.heares.2014.10.004. Epub 2014 Oct 19. Hear Res. 2015. PMID: 25456088 Review.
-
Bilateral cochlear implants in children: Effects of auditory experience and deprivation on auditory perception.Hear Res. 2016 Aug;338:76-87. doi: 10.1016/j.heares.2016.01.003. Epub 2016 Jan 30. Hear Res. 2016. PMID: 26828740 Free PMC article. Review.
Cited by
-
A method to enhance the use of interaural time differences for cochlear implants in reverberant environments.J Acoust Soc Am. 2016 Aug;140(2):1116. doi: 10.1121/1.4960572. J Acoust Soc Am. 2016. PMID: 27586742 Free PMC article.
-
Decoding spatial attention with EEG and virtual acoustic space.Physiol Rep. 2017 Nov;5(22):e13512. doi: 10.14814/phy2.13512. Physiol Rep. 2017. PMID: 29180483 Free PMC article.
-
Pulse timing dominates binaural hearing with cochlear implants.Proc Natl Acad Sci U S A. 2025 Apr 22;122(16):e2416697122. doi: 10.1073/pnas.2416697122. Epub 2025 Apr 17. Proc Natl Acad Sci U S A. 2025. PMID: 40244669
References
-
- Moore BCJ (1997) Space Perception. In: Moore BCJ, editor. An Introduction to the Psychology of Hearing. San Diego: Academic Press. 213–244.
-
- Bernstein LR, Trahiotis C (1982) Detection of interaural delay in highfrequency noise. J Acoust Soc Am 71: 147–152. - PubMed
-
- Yost WA, Wightman FL, Green DM (1971) Lateralization of filtered clicks. J Acoust Soc Am 50: 1526–1531. - PubMed
-
- Bernstein LR, Trahiotis C (1994) Detection of interaural delay in high-frequency sinusoidally amplitude-modulated tones, two-tone complexes, and bands of noise. J Acoust Soc Am 95: 3561–3567. - PubMed
-
- van de Par S, Kohlrausch A (1997) A new approach to comparing binaural masking level differences at low and high frequencies. J Acoust Soc Am 101: 1671–1680. - PubMed
Publication types
MeSH terms
Grants and funding
LinkOut - more resources
Full Text Sources
Other Literature Sources
Medical
Miscellaneous
