. 2014 Nov;25(11):955-65.
doi: 10.1089/hum.2014.048. Epub 2014 Sep 22.

Cellular immune response against firefly luciferase after sleeping beauty-mediated gene transfer in vivo

Affiliations

Cellular immune response against firefly luciferase after sleeping beauty-mediated gene transfer in vivo

Kelly M Podetz-Pedersen et al. Hum Gene Ther. 2014 Nov.

Abstract

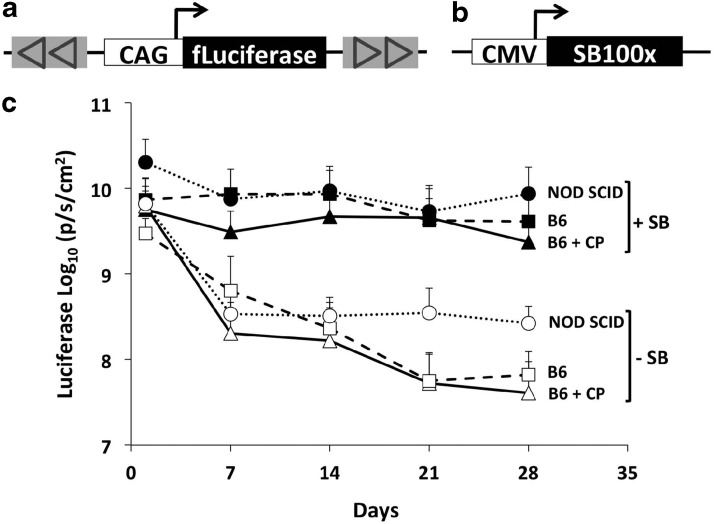
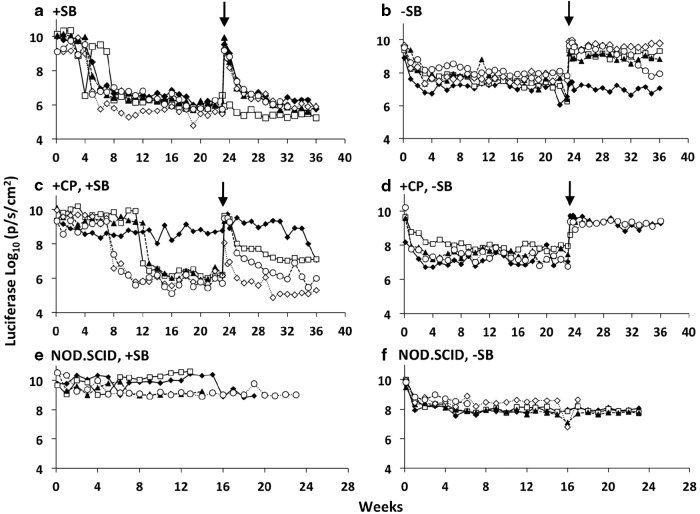
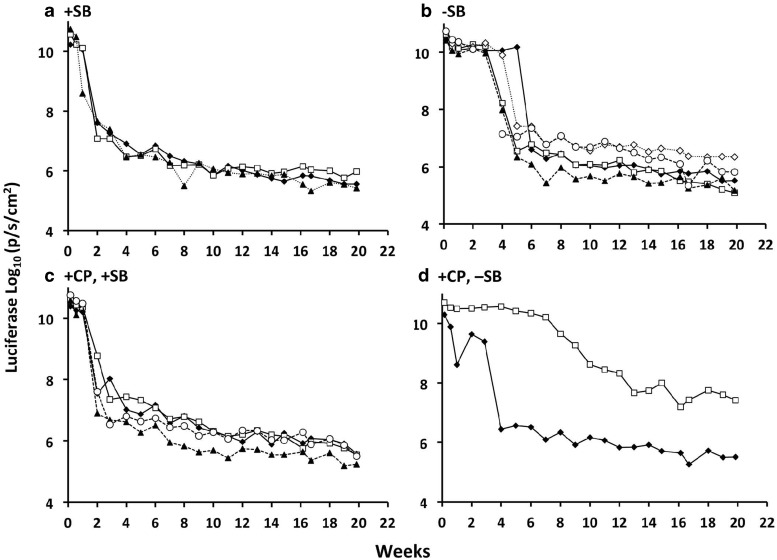
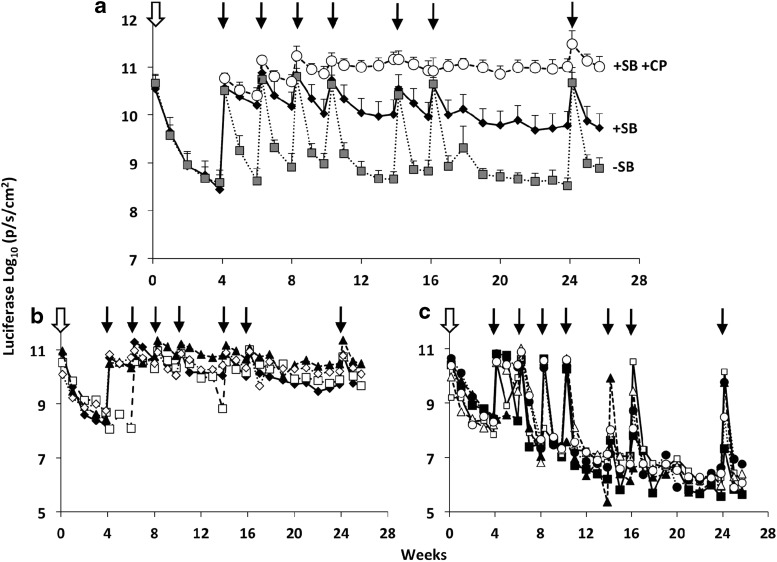
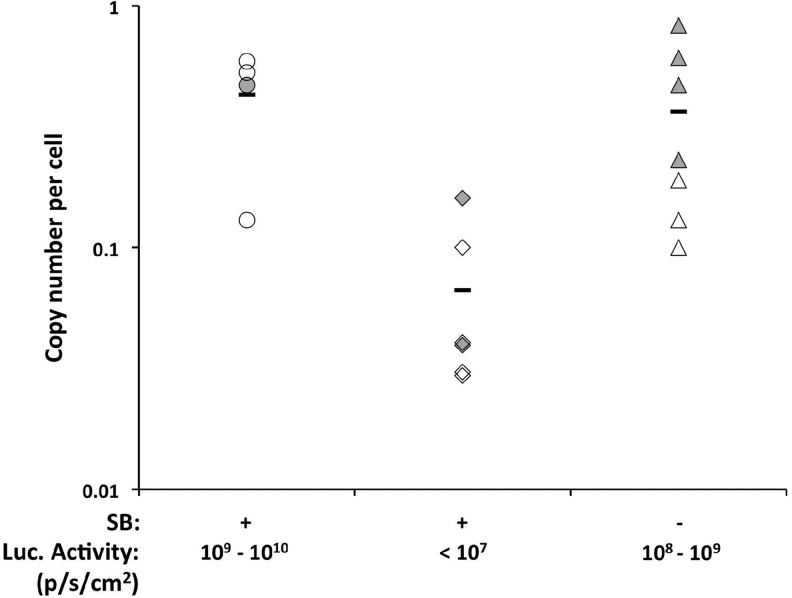
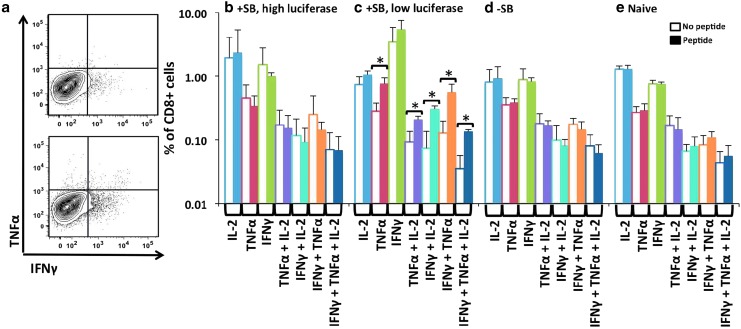
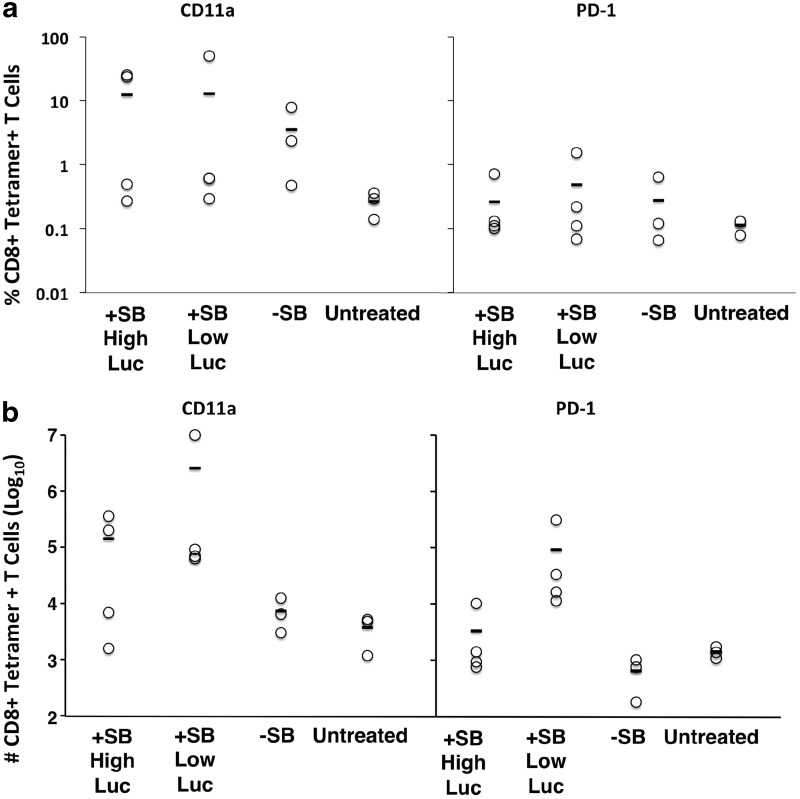
The Sleeping Beauty (SB) transposon system has been shown to mediate new gene sequence integration resulting in long-term expression. Here the effectiveness of hyperactive SB100X transposase was tested, and we found that hydrodynamic co-delivery of a firefly luciferase transposon (pT2/CaL) along with SB100X transposase (pCMV-SB100X) resulted in remarkably sustained, high levels of luciferase expression. However, after 4 weeks there was a rapid, animal-by-animal loss of luciferase expression that was not observed in immunodeficient mice. We hypothesized that this sustained, high-level luciferase expression achieved using the SB100X transposase elicits an immune response in pT2/CaL co-administered mice, which was supported by the rapid loss of luciferase expression upon challenge of previously treated animals and in naive animals adoptively transferred with splenocytes from previously treated animals. Specificity of the immune response to luciferase was demonstrated by increased cytokine expression in splenocytes after exposure to luciferase peptide in parallel with MHC I-luciferase peptide tetramer binding. This anti-luciferase immune response observed following continuous, high-level luciferase expression in vivo clearly impacts its use as an in vivo reporter. As both an immunogen and an extremely sensitive reporter, luciferase is also a useful model system for the study of immune responses following in vivo gene transfer and expression.


Figures

<b>FIG. 1.</b>
FIG. 1.
Long-term, high-level luciferase expression mediated by hyperactive transposase SB100X. (a) Transposon plasmid pT2/CaL contains the CAG promoter regulating firefly luciferase flanked by Sleeping Beauty (SB) T2 IR/DRs. (b) pCMV-SB100X; expression of hyperactive SB100X is regulated by the cytomegalovirus (CMV) early promoter. (c) Time course of mean luciferase activity after hydrodynamic injection of 5 μg pT2/CaL with or without 0.5 μg pCMV-SB100X (as indicated on the right, +SB or −SB) into NOD.SCID, C57BL/6, or temporarily immunosuppressed C57BL/6 mice. Data are expressed as mean (n=5) p/sec/cm2±SD. Immunosuppression was achieved by intraperitoneal (i.p.) injection of 120 mg/kg cyclophosphamide (CP) daily for 4 days beginning the day before hydrodynamic injection.
<b>FIG. 2.</b>
FIG. 2.
Sustained, high-level luciferase expression and resulting immune response. Luciferase activities (p/sec/cm2) are plotted for each of the individual animals from the same groups described in Fig. 1, shown here over the entire 9-month time course of the experiment. (a) C57BL/6 co-injected with pT2/CaL plus SB transposase-encoding plasmid pCMV-SB100X; (b) C57BL/6 injected with pT2/CaL alone; (c) CP immunosuppressed C57BL/6 co-injected with pT2/CaL plus pCMV-SB100X; (d) CP immunosuppressed C57BL/6 injected with pT2/CaL alone; (e) NOD.SCID co-injected with pT2/CaL plus pCMV-SB100X; (f) NOD.SCID injected with pT2/CaL alone. Each line represents an individual mouse, and each point indicates a specific luciferase reading. The black vertical arrow indicates the time at which C57BL/6 mice were challenged with 5 μg pT2/CaL plus 0.5 μg pCMV-SB100X by hydrodynamic injection.
<b>FIG. 3.</b>
FIG. 3.
Immune reactivity following adoptive transfer of splenocytes from previously treated immunocompetent animals. Splenocytes were harvested from each of the animals depicted in Fig. 2a–d and infused into naïve C57BL/6 mice. One day later, the recipient mice were hydrodynamically injected with 5 μg pT2/CaL plus 0.5 μg pCMV-SB100X. Each subfigure is titled according to the source of splenocytes used for each of the injections, that is, the original C57BL/6 treatment groups described in Fig. 1 and expression detailed for individual mice in Fig. 2. (a) C57BL/6 co-injected with pT2/CaL plus pCMV-SB100X (Fig. 2a). (b) C57BL/6 injected with pT2/CaL alone (Fig. 2b). (c) CP immunosuppressed C57BL/6 co-injected with pT2/CaL plus pCMV-SB100X (Fig. 2c). (d) CP immunosuppressed C57BL/6 injected with pT2/CaL alone (Fig. 2d). Each line represents an individual mouse. Luciferase expression (log10 of p/sec/cm2) is plotted over a period of 20 weeks.
<b>FIG. 4.</b>
FIG. 4.
Tolerizing effect of luciferase transposon alone against subsequent repetitive dosing with luciferase transposon plus transposase-encoding plasmid. C57BL/6 mice were hydrodynamically injected with 5 μg pT2/CaL alone to achieve tolerization (open arrow) to luciferase. (a) Starting on day 28, these animals were injected about every 2 weeks (black arrows) with 5 μg pT2/CaL with (closed diamonds, “ +SB”) or without (shaded squares, “−SB”) 0.5 μg pCMV-SB100X. A positive control group of CP-treated (cyclophosphamide was administered on days −1, 0, 1, and 2, and then weekly at a dose of 120 mg/kg for immunosuppression) C57BL/6 mice injected with pT2/CaL plus pCMV-SB100X was added at day 28. Data are presented as the mean luciferase activity (p/sec/cm2)±SD for each group. Mice that were tolerized with pT2/CaL alone and subsequently injected repeatedly with pT2/CaL plus pCMV-SB100X are also plotted individually to emphasize (b) those animals maintaining high levels of luciferase expression (>109 p/sec/cm2) and (c) those animals exhibiting a dramatic reduction of luciferase expression (<107 p/sec/cm2).
<b>FIG. 5.</b>
FIG. 5.
Effect of anti-luciferase immune response on luciferase gene copy frequency. DNA was extracted from hepatocytes (open symbols) or whole liver (closed symbols) of individual animals depicted in Fig. 4a–c. The frequency of luciferase sequences was determined by real-time quantitative PCR as described in Materials and Methods.
<b>FIG. 6.</b>
FIG. 6.
Specific luciferase peptide responsiveness by intracellular cytokine staining. Splenocytes were prepared from test animals (individual animals from Fig. 4a, groups −SB and +SB), stimulated with luciferase peptide (LMYRFEEEL), and assayed for responsive cytokine expression by intracellular staining as described in Materials and Methods. (a) ICCS of CD8+ lymphocytes for expression of IFNγ and TNFα after incubation with luciferase peptide (bottom) or without luciferase peptide (top). In (b–e), the percentage of CD8+ T cells staining positive for IL-2, IFNγ, and TNFα expression is shown with (shaded bars) and without (open bars) exposure to luciferase peptide. (b) Splenocytes from animals that had multiple injections of pT2/CaL plus pCMV-SB100X and maintaining high levels (>109 p/sec/cm2) of luciferase expression. (c) Splenocytes from animals that had multiple injections of pT2/CaL plus pCMV-SB100X and exhibiting a dramatic reduction (<107 p/sec/cm2) in luciferase expression. (d) Splenocytes from animals that had multiple injections of pT2/CaL alone. (e) Splenocytes from untreated naive mice. *p<0.01. Color images available online at www.liebertpub.com/hum
<b>FIG. 7.</b>
FIG. 7.
MHC I–luciferase peptide tetramer binding of CD8+ T cells. Liver lymphocytes were prepared from test animals (same individuals shown in Fig. 6, tested in parallel) and stained with anti-CD8α, anti-CD11a, anti-PD-1, and luciferase peptide–MHC I tetramer as described in Materials and Methods. (a) The percentage of CD8+ MHC I–luciferase peptide tetramer+liver cell populations±SD staining positive for CD11a (left) and PD-1 (right). (b) The mean number±SD of CD8+ cells staining positive for MHC I–luciferase peptide tetramer is shown for CD11a+ (left) and PD-1+(right) cell populations from liver. Treatment groups are detailed in the legend to Fig. 4.

References

    1. Altman J.D., Moss P.A., Goulder P.J., et al. (1996). Phenotypic analysis of antigen-specific T lymphocytes. Science 274, 94–96 - PubMed
    1. Aronovich E.L., Bell J.B., Belur L.R., et al. (2007). Prolonged expression of a lysosomal enzyme in mouse liver after Sleeping Beauty transposon-mediated gene delivery: implications for non-viral gene therapy of mucopolysaccharidoses. J. Gene Med. 9, 403–415 - PMC - PubMed
    1. Baus J., Liu L., Heggestad A.D., et al. (2005). Hyperactive transposase mutants of the Sleeping Beauty transposon. Mol. Ther. 12, 1148–1156 - PubMed
    1. Bell J.B., Podetz-Pedersen K.M., Aronovich E.L., et al. (2007). Preferential delivery of the Sleeping Beauty transposon system to livers of mice by hydrodynamic injection. Nat. Protoc. 2, 3153–3165 - PMC - PubMed
    1. Bell J.B., Aronovich E.L., Schreifels J.M., et al. (2010). Duration of expression and activity of Sleeping Beauty transposase in mouse liver following hydrodynamic DNA delivery. Mol. Ther. 18, 1796–1802 - PMC - PubMed

Publication types

LinkOut - more resources