

The changing demographics of traumatic spinal cord injury: An 11-year study of 831 patients
- PMID: 25096709
- PMCID: PMC4397204
- DOI: 10.1179/2045772314Y.0000000233
The changing demographics of traumatic spinal cord injury: An 11-year study of 831 patients
Abstract
Context/objective: Traumatic spinal cord injuries (T-SCI) have a devastating impact and place a significant financial burden on the healthcare system. The incidence of T-SCI ranges from 10.4 to 83 cases per million and varies with age, sex, or geographical region. This study describes the epidemiology and demographic characteristics of patients treated for T-SCI in our region over 11 years.
Design: Retrospective cohort study.
Setting: Single Level-I trauma center in Québec, Canada.
Participants: Patients who sustained T-SCI between 1 April 2000 and 31 March 2011.
Interventions: None.
Outcome measures: Data concerning T-SCI patients was retrieved from the Québec Trauma Registry. Information on age, sex, trauma, level of injury, type and severity of neurological deficit (ASIA scale), and treatment was extracted. Annual, age-standardized rates of T-SCI were calculated and trends over time were examined.
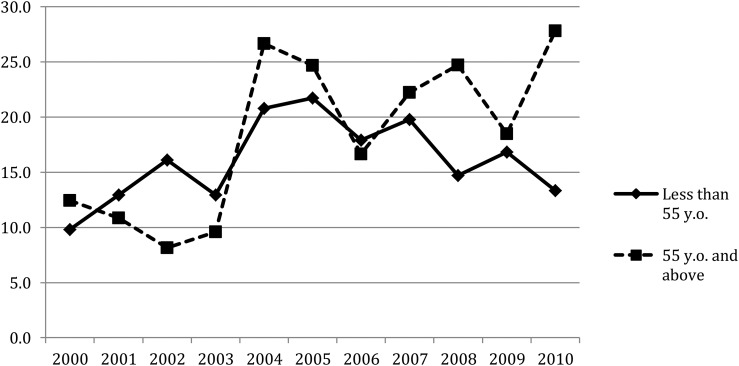
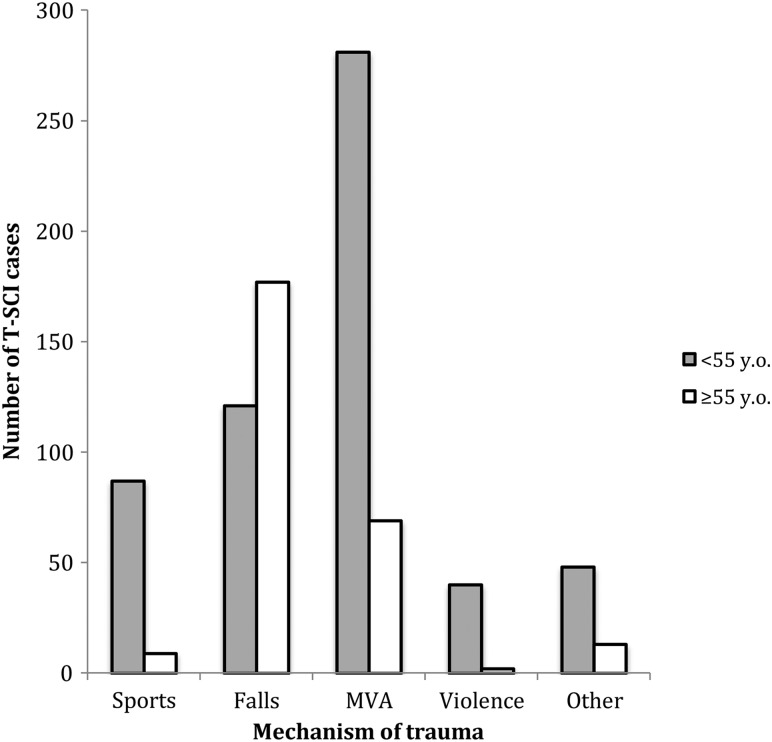
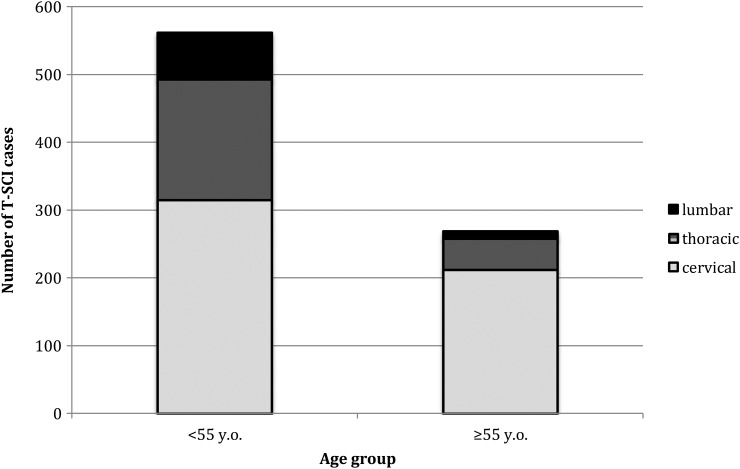
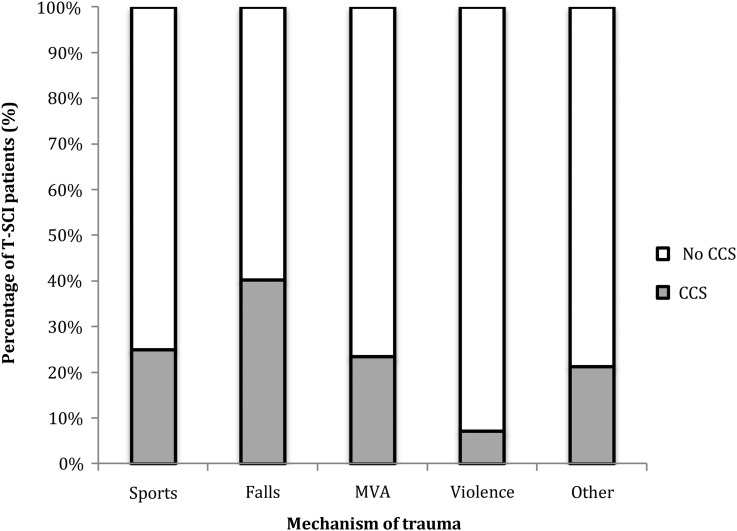
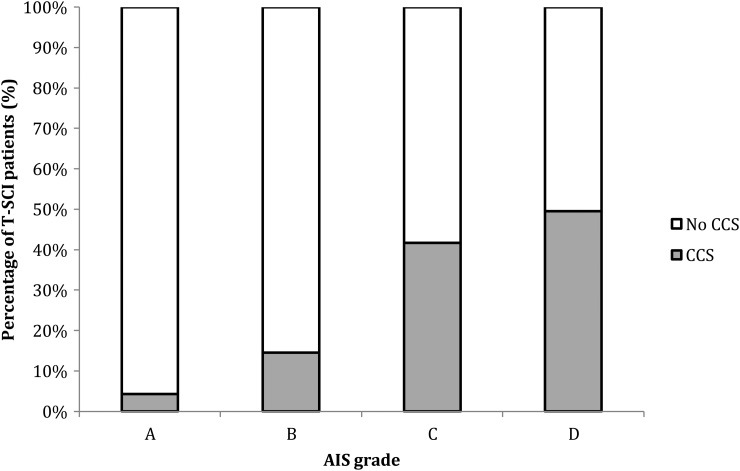
Results: Eight hundred and thirty-one patients with T-SCI were identified. The incidence of T-SCI did not change over time but there was a 13-year increase in age between 2002 and 2010. More than 60% of patients aged 55 years or more were injured following a fall and 80% became tetraplegic. These patients were more likely to have central cord syndrome (CCS) and incomplete neurological injury, compared to younger patients. The incidence of CCS increased from 25 to 37% over 11 years.
Conclusions: The T-SCI population is aging and is more frequently sustaining injuries associated with CCS, incomplete neurological deficits and tetraplegia.
Keywords: Central cord syndrome; Epidemiology; Spinal cord injury; Tetraplegia; Trauma.
Figures
References
-
- Garcia-Altes A, Perez K, Novoa A, Suelves JM, Bernabeu M, Vidal J, et al. . Spinal cord injury and traumatic brain injury: a cost-of-illness study. Neuroepidemiology 2012;39(2):103–8. - PubMed
-
- Dryden DM, Saunders LD, Jacobs P, Schopflocher DP, Rowe BH, May LA, et al. . Direct health care costs after traumatic spinal cord injury. J Trauma 2005;59(2):441–7. - PubMed
-
- Mac-Thiong JM, Feldman DE, Thompson C, Bourassa-Moreau E, Parent S. Does timing of surgery affect hospitalisation costs and length of stay for acute care following a traumatic spinal cord injury? J Neurotrauma 2012;29(81):2816–22. - PubMed
Publication types
MeSH terms
LinkOut - more resources
Full Text Sources
Other Literature Sources
Medical
Miscellaneous