. 2014 Aug;26(8):3387-402.
doi: 10.1105/tpc.114.123455. Epub 2014 Aug 5.

The Os-AKT1 channel is critical for K+ uptake in rice roots and is modulated by the rice CBL1-CIPK23 complex

Affiliations

The Os-AKT1 channel is critical for K+ uptake in rice roots and is modulated by the rice CBL1-CIPK23 complex

Juan Li et al. Plant Cell. 2014 Aug.

Abstract

Potassium (K(+)) is one of the essential nutrient elements for plant growth and development. Plants absorb K(+) ions from the environment via root cell K(+) channels and/or transporters. In this study, the Shaker K(+) channel Os-AKT1 was characterized for its function in K(+) uptake in rice (Oryza sativa) roots, and its regulation by Os-CBL1 (Calcineurin B-Like protein1) and Os-CIPK23 (CBL-Interacting Protein Kinase23) was investigated. As an inward K(+) channel, Os-AKT1 could carry out K(+) uptake and rescue the low-K(+)-sensitive phenotype of Arabidopsis thaliana akt1 mutant plants. Rice Os-akt1 mutant plants showed decreased K(+) uptake and displayed an obvious low-K(+)-sensitive phenotype. Disruption of Os-AKT1 significantly reduced the K(+) content, which resulted in inhibition of plant growth and development. Similar to the AKT1 regulation in Arabidopsis, Os-CBL1 and Os-CIPK23 were identified as the upstream regulators of Os-AKT1 in rice. The Os-CBL1-Os-CIPK23 complex could enhance Os-AKT1-mediated K(+) uptake. A phenotype test confirmed that Os-CIPK23 RNAi lines exhibited similar K(+)-deficient symptoms as the Os-akt1 mutant under low K(+) conditions. These findings demonstrate that Os-AKT1-mediated K(+) uptake in rice roots is modulated by the Os-CBL1-Os-CIPK23 complex.


Figures

Figure 1.
Figure 1.
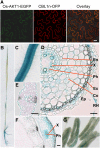
Subcellular Localization and Expression Pattern of Os-AKT1. (A) Transient expression of Os-AKT1-EGFP and CBL1n-OFP in N. benthamiana leaves. Left panel, GFP image; middle panel, OFP image; right panel, merge of GFP and OFP image (bar = 50 μm). (B) to (G) Expression pattern of Os-AKT1 determined in ProOs-AKT1:GUS transgenic rice. The GUS staining of 10-d-old seedling (B), primary root (C), transverse section of primary root (D), transverse section of leaf (E), transverse section of stem (F), and anthers (G). RH, root hair; Ep, epidermis; Ex, exodermis; Co, Cortex; En, endodermis; Ph, phloem; X, xylem. Bars = 100 μm.
Figure 2.
Figure 2.
Functional Characterization of Os-AKT1 in Yeast and Arabidopsis. (A) Os-AKT1 and AKT1 complement the K+ uptake-deficient yeast mutant R5421 on AP medium containing different K+ concentrations. The yeast strain R757 was used as a positive control. Three independent experiments were performed. (B) The K+ uptake kinetic analysis of Os-AKT1 and AKT1 in yeast. The data points are shown as means ± se (n = 3). (C) Phenotype comparison of wild-type Arabidopsis (Col), akt1 mutant, and two transgenic lines (akt1/Os-AKT1-1 and akt1/Os-AKT1-2) grown on MS and LK (100 μM K+) medium for 7 d. (D) Real-time PCR verification of Os-AKT1 and AKT1 expression in different plant materials. (E) Comparison of K+ content in different plant materials. The K+ content of roots and shoots was determined after the plants grown on MS and LK medium for 7 d. Data are shown as means ± se (n = 3). Student’s t test (*P < 0.05 and **P < 0.01) was used to analyze statistical significance. (F) Patch-clamp whole-cell recordings of inward K+ currents in Arabidopsis root cell protoplasts. The plant materials are indicated above each recording. The voltage protocols, as well as time and current scale bars for the recordings, are shown inside the figure. (G) The I-V (current-voltage) relationship of the steady state whole-cell inward K+ currents in root cell protoplasts. The data are derived from the recordings as shown in (F) and presented as means ± se (Col, n = 35; akt1, n = 6; akt1/Os-AKT1-2, n = 28). (H) The voltage dependence of inward K+ currents in root cell protoplasts isolated from different plants. The solid lines represented the best fits according to the Boltzmann function: G/Gmax = 1/(1+exp((Vm−V1/2)/S)). G (conductance) was calculated as G=I/(Vm−EK), where I is the steady state current at voltage Vm. V1/2 is the membrane potential at which the conductance is half-maximal and S is a slope factor. The data are derived from the recordings as shown in (F) and presented as means ± se (Col, n = 35; akt1, n = 6; akt1/Os-AKT1-2, n = 28).
Figure 3.
Figure 3.
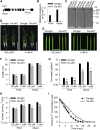
Phenotype of Rice Os-akt1 Mutant. (A) The structure of the Os-AKT1 gene. The black boxes indicate exons and the lines represent introns. The T-DNA insertion site in the Os-akt1 mutant is shown using an arrow. (B) Real-time PCR verification of Os-AKT1 expression in Dongjin and Os-akt1 mutant. The data are presented as means ± se (n = 3). (C) DNA gel blot analysis of T-DNA insertion in Os-akt1. Lanes 1, 4, and 7 were Dongjin (negative control); lanes 2, 5, and 8 were Os-akt1 mutant; and lanes 3, 6, and 9 were the plasmid containing the HPT gene (positive control). Genomic DNA was isolated from rice leaves and digested using BamHI (left), SacI (middle), or HindIII (right). A DNA fragment of HPT included in the T-DNA insertion fragment was used as probe. (D) and (E) Phenotype comparison between Dongjin and Os-akt1 mutant. The photographs of whole seedlings (D) and first leaves (E) were taken after the rice seedlings were grown in hydroponic solution for 7 d. Bars in (D) = 15 cm; bars in (E) = 2 cm. (F) to (H) Seedling length (F), dry weight (G), and K+ content (H) of Dongjin and Os-akt1 mutant after growth in hydroponic solution for 7 d. Data are shown as means ± se (n = 3). Student’s t test (*P < 0.05 and **P < 0.01) was used to analyze statistical significance of differences between genotypes. (I) Comparison of K+ uptake ability between Dongjin and Os-akt1 using the K+ depletion method. Data are shown as means ± se (n = 3).
Figure 4.
Figure 4.
Phenotype of Rice Os-akt1 Complementation Plants. (A) Phenotype comparison of different plant materials. The photographs of whole seedlings and first leaves were taken after the rice seedlings were grown in hydroponic solution for 7 d. The seedlings transformed with empty vector pBI121 were used as controls. COM1 and COM2 represent the two complementation lines of Os-akt1 mutant. Bars = 5 cm. (B) Real-time PCR verification of Os-AKT1 expression in different plant materials. The data are presented as means ± se (n = 3). (C) and (D) Dry weight (C) and K+ content (D) of different plant materials after the rice seedlings were grown in hydroponic solution for 7 d. Data are shown as means ± se (n = 3). Student’s t test (*P < 0.05 and **P < 0.01) was used to analyze statistical significance of differences from the wild type.
Figure 5.
Figure 5.
Lesion of Os-AKT1 Inhibits Plant Growth and Impairs Grain Yield. (A) and (B) Phenotype comparison of Dongjin and Os-akt1 mutant plants at tillering stage (A) and grain-filling stage (B). Bar in (A) = 10 cm; bar in (B) = 15 cm. (C) Comparison of main panicle between Dongjin and Os-akt1 mutant plants. Bar = 5 cm. (D) to (G) Comparison of main panicle length (D), grain number (E), seed set percentage (F), and 100-grain weight (G) between Dongjin and Os-akt1 mutant plants. Data are shown as means ± se (n = 10). Student’s t test (*P < 0.05 and **P < 0.01) was used to analyze statistical significance.
Figure 6.
Figure 6.
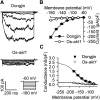
Electrophysiological Analysis of Inward K+ Currents in Rice Root Cells. (A) Patch-clamp whole-cell recordings of inward K+ currents in rice root cell protoplasts isolated from Dongjin and Os-akt1 mutant. The voltage protocols, as well as time and current scale bars for the recordings, are shown. (B) The I-V (current-voltage) relationship of the steady state whole-cell inward K+ currents in rice root cell protoplasts. The data are derived from the recordings as shown in (A) and presented as means ± se (Dongjin, n = 43; Os-akt1, n = 28). (C) The G-V (conductance-voltage) relationship of the steady state whole-cell inward K+ currents in rice root cell protoplasts. The solid lines represented the best fits of conductance (G) according to the Boltzmann function. The data are derived from the recordings as shown in (A) and presented as means ± se (Dongjin, n = 43; Os-akt1, n = 28).
Figure 7.
Figure 7.
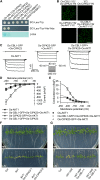
Os-CBL1 and Os-CIPK23 Enhance Os-AKT1 Activity. (A) Yeast two-hybrid analysis of Os-CIPK23 interaction with Os-CBL1 and the cytosolic region of Os-AKT1 (Os-AKT1-C). (B) BiFC assays of Os-CIPK23 interaction with Os-CBL1 and Os-AKT1 in N. benthamiana leaves. Bar = 100 μm. (C) Patch-clamp whole-cell recordings of inward K+ currents in HEK293 cells expressing different combinations of Os-CBL1, Os-CIPK23, and Os-AKT1. The voltage protocols, as well as time and current scale bars for the recordings, are shown. (D) The I-V relationship of the steady state whole-cell inward K+ currents in HEK293 cells. The data are derived from the recordings as shown in (C) and presented as means ± se (Os-AKT1, n = 59; Os-CBL1-GFP+Os-CIPK23, n = 20; Os-CIPK23-GFP+Os-AKT1, n = 8; Os-CBL1-GFP+Os-CIPK23+Os-AKT1, n = 52). (E) The G-V relationship of the steady state whole-cell inward K+ currents in HEK293 cells. The solid lines represented the best fits of conductance (G) according to the Boltzmann function. The data are derived from the recordings as shown in (C) and presented as means ± se (Os-AKT1, n = 59; Os-CIPK23-GFP+Os-AKT1, n = 8; Os-CBL1-GFP+Os-CIPK23+Os-AKT1, n = 52). (F) and (G) Phenotype of Arabidopsis transgenic lines expressing Os-CIPK23 (F) and Os-CBL1 (G) in the lks1 and cbl1 cbl9 mutant backgrounds, respectively. The photographs were taken after the plants were grown on MS and LK medium for 7 d.
Figure 8.
Figure 8.
Phenotype of Os-CIPK23 RNAi Plants. (A) and (B) Phenotype comparison between Nipponbare (Np) and Os-CIPK23 RNAi plants (23RNAi-1 and 23RNAi-2). The photographs of whole seedlings (A) and first leaves (B) were taken after the rice seedlings were grown in hydroponic solution for 7 d. Bars in (A) = 15 cm; bars in (B) = 2 cm. (C) Real-time PCR verification of Os-CIPK23 expression in Nipponbare and Os-CIPK23 RNAi plants. (D) to (F) Seedling length (D), dry weight (E), and K+ content (F) of Nipponbare and Os-CIPK23 RNAi plants after growth in hydroponic solution for 7 d. Data are shown as means ± se (n = 3). Student’s t test (*P < 0.05 and **P < 0.01) was used to analyze statistical significance of difference from the wild type. (G) Comparison of K+ uptake ability between Nipponbare and Os-CIPK23 RNAi plants using the K+ depletion method. Data are shown as means ± se (n = 3).

References

    1. Ahn S.J., Shin R., Schachtman D.P. (2004). Expression of KT/KUP genes in Arabidopsis and the role of root hairs in K+ uptake. Plant Physiol. 134: 1135–1145. - PMC - PubMed
    1. Ashley M.K., Grant M., Grabov A. (2006). Plant responses to potassium deficiencies: a role for potassium transport proteins. J. Exp. Bot. 57: 425–436. - PubMed
    1. Bañuelos M.A., Garciadeblas B., Cubero B., Rodríguez-Navarro A. (2002). Inventory and functional characterization of the HAK potassium transporters of rice. Plant Physiol. 130: 784–795. - PMC - PubMed
    1. Batistič O., Sorek N., Schültke S., Yalovsky S., Kudla J. (2008). Dual fatty acyl modification determines the localization and plasma membrane targeting of CBL/CIPK Ca2+ signaling complexes in Arabidopsis. Plant Cell 20: 1346–1362. - PMC - PubMed
    1. Boscari A., Clément M., Volkov V., Golldack D., Hybiak J., Miller A.J., Amtmann A., Fricke W. (2009). Potassium channels in barley: cloning, functional characterization and expression analyses in relation to leaf growth and development. Plant Cell Environ. 32: 1761–1777. - PubMed

Publication types

MeSH terms