. 2014 Sep;25(9):1663-73.
doi: 10.1177/0956797614541991. Epub 2014 Aug 5.

"Utilizing" signal detection theory

Affiliations

"Utilizing" signal detection theory

Spencer K Lynn et al. Psychol Sci. 2014 Sep.

Abstract

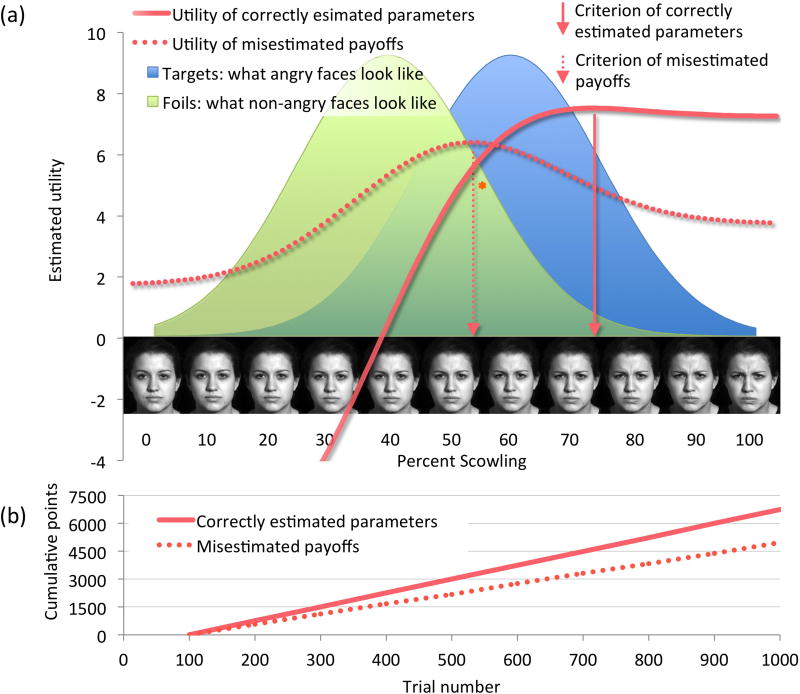
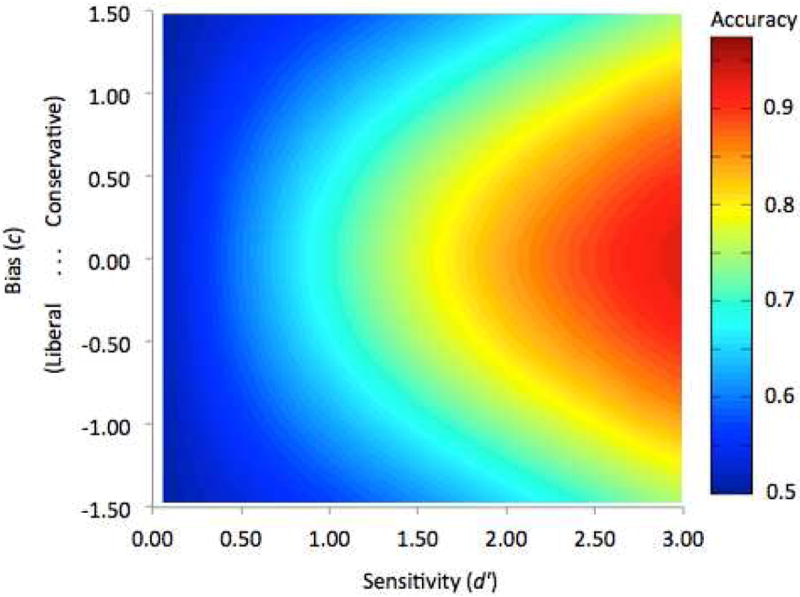
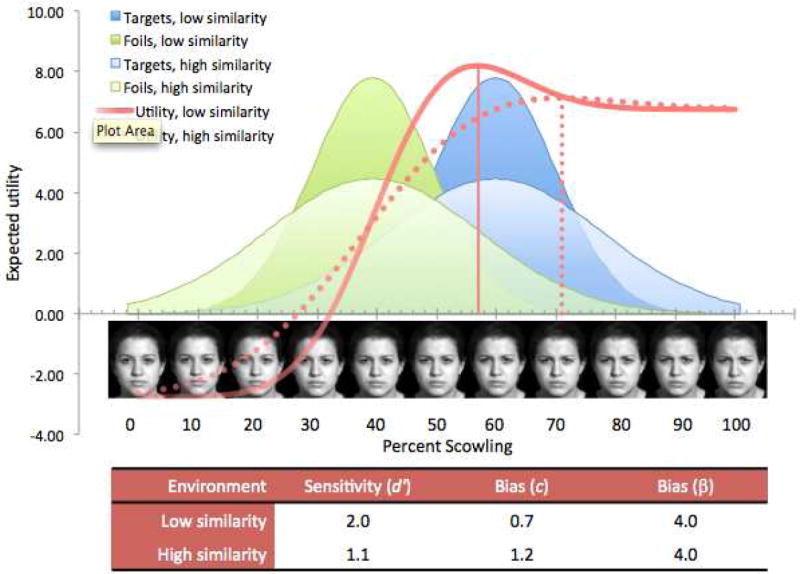
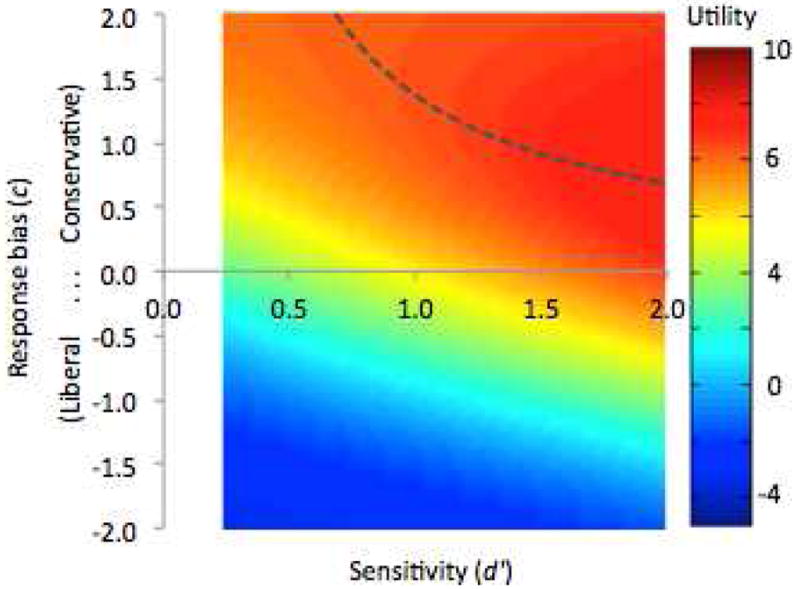
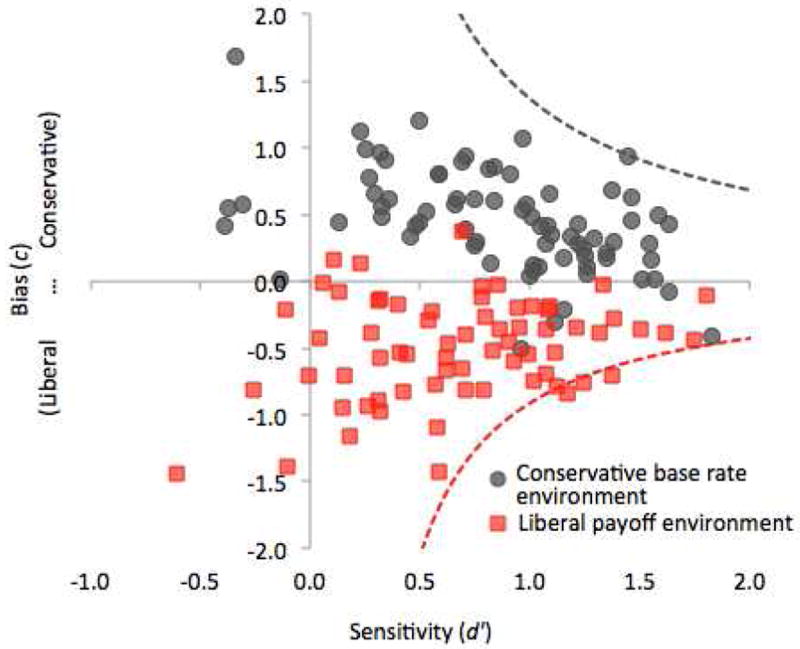
What do inferring what a person is thinking or feeling, judging a defendant's guilt, and navigating a dimly lit room have in common? They involve perceptual uncertainty (e.g., a scowling face might indicate anger or concentration, for which different responses are appropriate) and behavioral risk (e.g., a cost to making the wrong response). Signal detection theory describes these types of decisions. In this tutorial, we show how incorporating the economic concept of utility allows signal detection theory to serve as a model of optimal decision making, going beyond its common use as an analytic method. This utility approach to signal detection theory clarifies otherwise enigmatic influences of perceptual uncertainty on measures of decision-making performance (accuracy and optimality) and on behavior (an inverse relationship between bias magnitude and sensitivity optimizes utility). A "utilized" signal detection theory offers the possibility of expanding the phenomena that can be understood within a decision-making framework.

Keywords: decision making; perception; signal detection theory; utility.


Figures

Fig. 1
Fig. 1
In a social threat detection scenario, facial expressions are evaluated by one person (the perceiver or decision maker) to gauge another person’s (the sender or signaler) threat to the perceiver. (a) The payoff, base rate, and similarity parameters can be combined to derive a utility function for the decision environment that they characterize. The location on the stimulus domain (x-axis) with the highest utility is the decision criterion location (solid drop-line) that will maximize benefit over a series of decisions. A simulated perceiver who underestimates the base rate (dotted utility function), adopts a suboptimally neutral criterion (dotted drop-line). The perceiver’s expected utility is dictated by where the criterion meets the utility function derived from correctly estimated parameters, denoted by an asterisk. (b) That the misestimate is suboptimal is shown by a shallower rate of utility gain
Fig. 2
Fig. 2
Iso-accuracy gradients (regions of the same color) show that multiple combinations of sensitivity and bias produce the same accuracy. For example, at moderate sensitivity (d′=2), both liberal bias (c=-0.5) and conservative bias (c=0.5) can produce accuracy near 0.8 in this simulated neutral-bias environment (parameter values provided in Supplemental Material).
Fig. 3
Fig. 3
To optimize their performance in a biased environment, perceivers with low sensitivity must adopt a more extreme bias than those with high sensitivity. Comparison of two optimal models that differ in similarity of targets vs. foils illustrates that, to offset the decrement in performance caused by low sensitivity, perceivers with low sensitivity should adopt a more extreme bias (depicted by the rightward shift of the criterion for the “high similarity” utility function; see inset table). Note that bias as measured by beta does not explicitly reflect the difference in behavior. Parameter values provided in Supplemental Material.
Fig. 4
Fig. 4
The utility approach to signal detection theory indicates a relationship between bias and sensitivity that functions to maximize the utility of perceptual decisions. Mathematical modeling shows that a perceiver’s sensitivity and bias should be inversely related. A “line of optimal response” (LOR; dashed line) is defined by the bias that yields maximum utility for any given level of sensitivity, for constant base rate and payoff values. Curvature of the LOR indicates that the decrease in utility that results from reduced sensitivity can be mitigated by increased magnitude of bias (here, more conservative-going). Parameter values provided in Supplemental Material.
Fig. 5
Fig. 5
An inverse relationship between bias and sensitivity functions to optimize decision making. Participants in a liberally or conservatively biased decision environment showed inverse relationships between bias and sensitivity as predicted by the Line of Optimal Response (LOR, dashed lines) for the environment’s parameter value set. Perceivers closer to their environment’s LOR earned significantly more points than those farther away, indicating that the inverse relationship is driven by utility maximization. Data from Lynn et al. (2012).

References

    1. Abbey CK, Eckstein MP, Boone JM. An equivalent relative utility metric for evaluating screening mammography. Medical Decision Making. 2009;30:113–122. - PMC - PubMed
    1. Anderson IM, Shippen C, Juhasz G, Chase D, Thomas E, Downey D, Deakin JFW, et al. State-dependent alteration in face emotion recognition in depression. British Journal of Psychiatry. 2011;198:302–308. - PubMed
    1. Bohil C, Maddox W. Category discriminability, base-rate, and payoff effects in perceptual categorization. Attention, Perception, & Psychophysics. 2001;63:361–376. - PubMed
    1. Clark SE. Costs and benefits of eyewitness identification reform: Psychological science and public policy. Perspectives on Psychological Science. 2012;7:238–259. - PubMed
    1. Dusoir A. Treatments of bias in detection and recognition models: A review. Perception & Psychophysics. 1975;17:167–178.

Publication types