. 2014 Sep 16;111(37):13475-80.
doi: 10.1073/pnas.1406663111. Epub 2014 Aug 5.

Predicting the outcomes of treatment to eradicate the latent reservoir for HIV-1

Affiliations

Predicting the outcomes of treatment to eradicate the latent reservoir for HIV-1

Alison L Hill et al. Proc Natl Acad Sci U S A. .

Erratum in

  • Proc Natl Acad Sci U S A. 2014 Oct 28;111(43):15598

Abstract

Massive research efforts are now underway to develop a cure for HIV infection, allowing patients to discontinue lifelong combination antiretroviral therapy (ART). New latency-reversing agents (LRAs) may be able to purge the persistent reservoir of latent virus in resting memory CD4(+) T cells, but the degree of reservoir reduction needed for cure remains unknown. Here we use a stochastic model of infection dynamics to estimate the efficacy of LRA needed to prevent viral rebound after ART interruption. We incorporate clinical data to estimate population-level parameter distributions and outcomes. Our findings suggest that ∼2,000-fold reductions are required to permit a majority of patients to interrupt ART for 1 y without rebound and that rebound may occur suddenly after multiple years. Greater than 10,000-fold reductions may be required to prevent rebound altogether. Our results predict large variation in rebound times following LRA therapy, which will complicate clinical management. This model provides benchmarks for moving LRAs from the laboratory to the clinic and can aid in the design and interpretation of clinical trials. These results also apply to other interventions to reduce the latent reservoir and can explain the observed return of viremia after months of apparent cure in recent bone marrow transplant recipients and an immediately-treated neonate.

Keywords: HIV cure; HIV latent reservoir; viral dynamics.


Conflict of interest statement

The authors declare no conflict of interest.

Figures
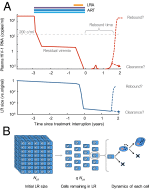
Fig. 1.
Fig. 1.
Schematic of LRA treatment and stochastic model of rebound following interruption of ART. (A) Proposed treatment protocol, illustrating possible viral load and size of LR before and after LRA therapy. When ART is started, viral load decreases rapidly and may fall below the limit of detection. The LR is established early in infection (not shown) and decays very slowly over time. When LRA is administered, the LR declines. After discontinuation of ART, the infection may be cleared, or viremia may eventually rebound. (B) LRA efficacy is defined by the parameter q, the fraction of the LR remaining after therapy, which determines the initial conditions of the model. The stochastic model of viral dynamics following interruption of ART and LRA tracks both latently infected resting CD4+ T cells (rectangles) and productively infected CD4+ T cells (ovals). Each arrow represents an event that occurs in the model. Alternate models considering homeostatic proliferation and turnover of the LR are discussed in SI Materials and Methods. Viral rebound occurs if at least one remaining cell survives long enough to activate and produce a chain of infection events leading to detectable infection (plasma HIV-1 RNA >200 copies per mL).
Fig. 2.
Fig. 2.
Clearance probabilities and rebound times following LRA therapy predicted from the model using point estimates for the parameters (Table 1). LRA log-efficacy is the number of orders of magnitude by which the LR size is reduced following LRA therapy, −log10(q). (A) Probability that the LR is cleared by LRA. Clearance occurs if all cells in the LR die before a reactivating lineage leads to viral rebound. (B) Median viral rebound times (logarithmic scale) among patients who do not clear the infection. (C) Survival curves (Kaplan–Meier plots) show the percentage of patients who have not yet experienced viral rebound, plotted as a function of the time (logarithmic scale) after treatment interruption. Solid lines represent simulations, and circles represent approximations from the branching process calculation. All simulations included 104 to 105 patients.
Fig. 3.
Fig. 3.
Predicted LRA therapy outcomes, accounting for uncertainty in patient parameter values. (A) Full uncertainty analysis where all viral dynamics parameters are sampled for each patient from the distributions provided in Table 1. (B) A best-case scenario where the reservoir half-life is only 6 mo (δ = 3.8 × 10⁻³ d−1). All patients have the same underlying viral dynamic parameters, otherwise given by the point estimates in Table 1. (C) A worst-case scenario where the reservoir does not decay because cell death is balanced by homeostatic proliferation (δ = 0). (I) Probability that the LR is cleared by LRA. Clearance occurs if all cells in the LR die before a reactivating lineage leads to viral rebound. LRA log-efficacy is the number of orders of magnitude by which the LR size is reduced following LRA therapy, −log10(q). (II) Median viral rebound times (logarithmic scale) among patients who do not clear the infection. (III) Survival curves (Kaplan–Meier plots) show the percentage of patients who have not yet experienced viral rebound, plotted as a function of the time (logarithmic scale) after treatment interruption. All simulations included 104 to 105 patients.
Fig. 4.
Fig. 4.
Efficacies required for successful LRA therapy. The target LRA log-efficacy is the treatment level (in terms of log reduction in LR size) for which at least 50% of patients still have suppressed viral load after a given treatment interruption length (blue line). Shaded ranges show the results for the middle 50% (dark gray) and 90% (light gray) of patients. Lifetime indicates the LR is cleared. Annotations on the curve represent data points for case studies describing large reservoir reductions and observing rebound times after ART interruption. From left to right, they represent a case of early ART initiation in an adult [the “Chun patient” (C.) (36)], two cases of hematopoietic stem cell transplant with wild-type donor cells [the two Boston patients (Bo.1 and Bo.2) (23)], a case of early ART initiation in an infant [the Mississippi baby (Mi.) (25), assuming, as recently reported, rebound after 27 mo], and a case of hematopoietic stem cell transplant with Δ32 CCR5 donor cells [the Berlin patient (Be.) (22, 37)]. For the Chun patient, the annotations represent the maximum likelihood estimate for LR reduction (diamond), as well as 95% confidence intervals (vertical bar). For the Boston, Berlin, and Mississippi patients, vertical arrows indicate that only a lower bound on treatment efficacy is known (LR size was below the detection limit) and that the true value may extend further in the direction shown. For the Berlin patient, the horizontal arrow indicates that rebound time is at least 5 y (rebound has not yet occurred).

Comment in

  • Stochastic variability in HIV affects viral eradication.
    Rouzine IM, Razooky BS, Weinberger LS. Rouzine IM, et al. Proc Natl Acad Sci U S A. 2014 Sep 16;111(37):13251-2. doi: 10.1073/pnas.1413362111. Epub 2014 Sep 8. Proc Natl Acad Sci U S A. 2014. PMID: 25201951 Free PMC article. No abstract available.

References

    1. Chun TW, et al. Quantification of latent tissue reservoirs and total body viral load in HIV-1 infection. Nature. 1997;387(6629):183–188. - PubMed
    1. Chun TW, et al. Early establishment of a pool of latently infected, resting CD4(+) T cells during primary HIV-1 infection. Proc Natl Acad Sci USA. 1998;95(15):8869–8873. - PMC - PubMed
    1. Siliciano JD, et al. Long-term follow-up studies confirm the stability of the latent reservoir for HIV-1 in resting CD4+ T cells. Nat Med. 2003;9(6):727–728. - PubMed
    1. Archin NM, et al. 2014. Measuring HIV latency over time: Reservoir stability and assessing interventions. 21st Conference on Retroviruses and Opportunistic Infections (Boston), Abstract 406.
    1. Ruiz L, et al. Structured treatment interruption in chronically HIV-1 infected patients after long-term viral suppression. AIDS. 2000;14(4):397–403. - PubMed

Publication types