. 2014 Aug 26;111(34):12426-31.
doi: 10.1073/pnas.1413299111. Epub 2014 Aug 5.

Dynamic regulation of human endogenous retroviruses mediates factor-induced reprogramming and differentiation potential

Affiliations

Dynamic regulation of human endogenous retroviruses mediates factor-induced reprogramming and differentiation potential

Mari Ohnuki et al. Proc Natl Acad Sci U S A. .

Abstract

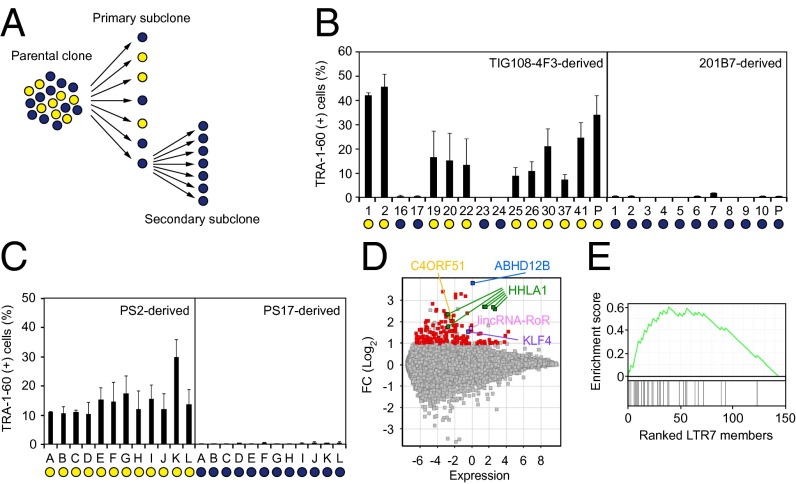
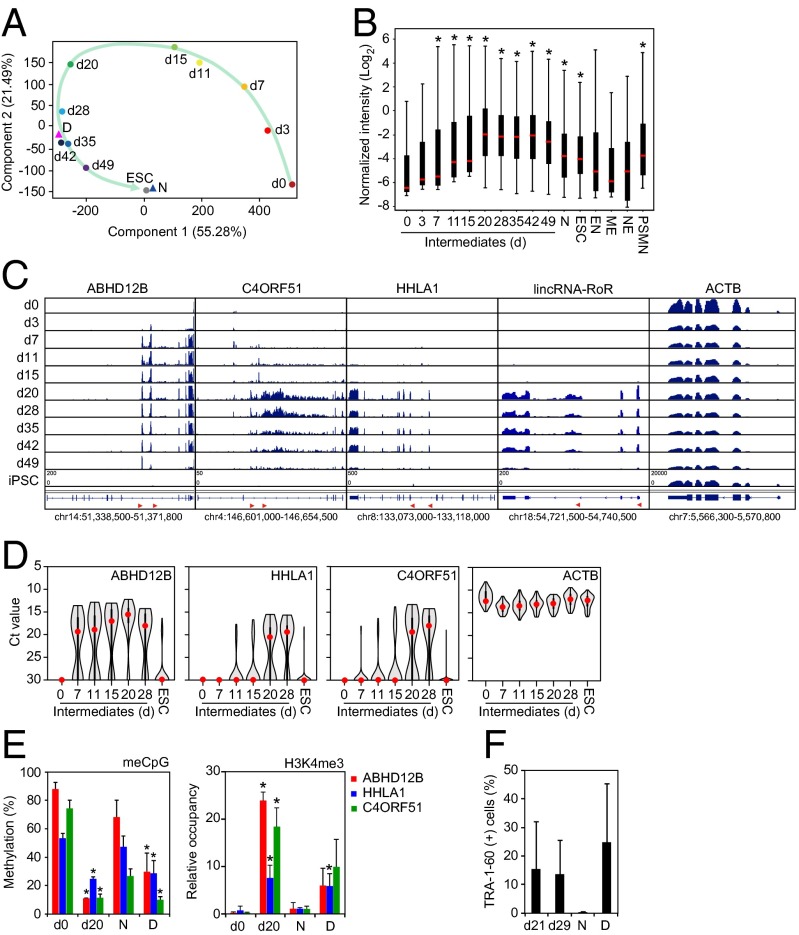
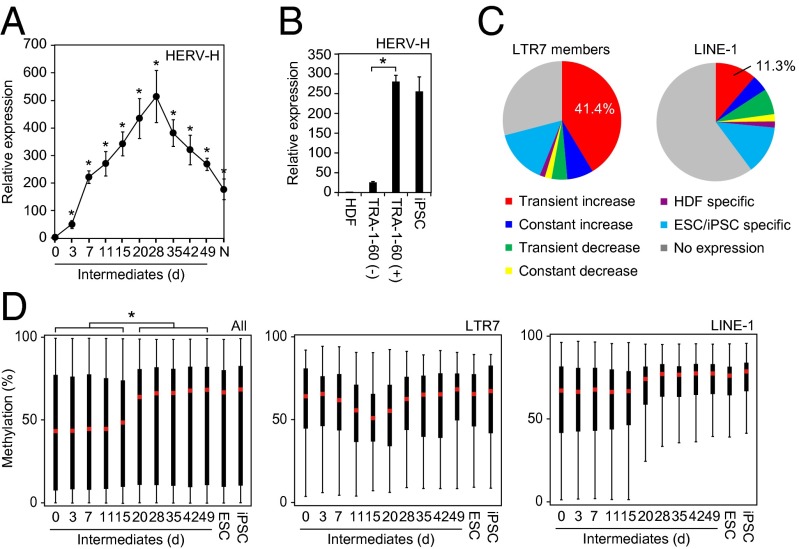
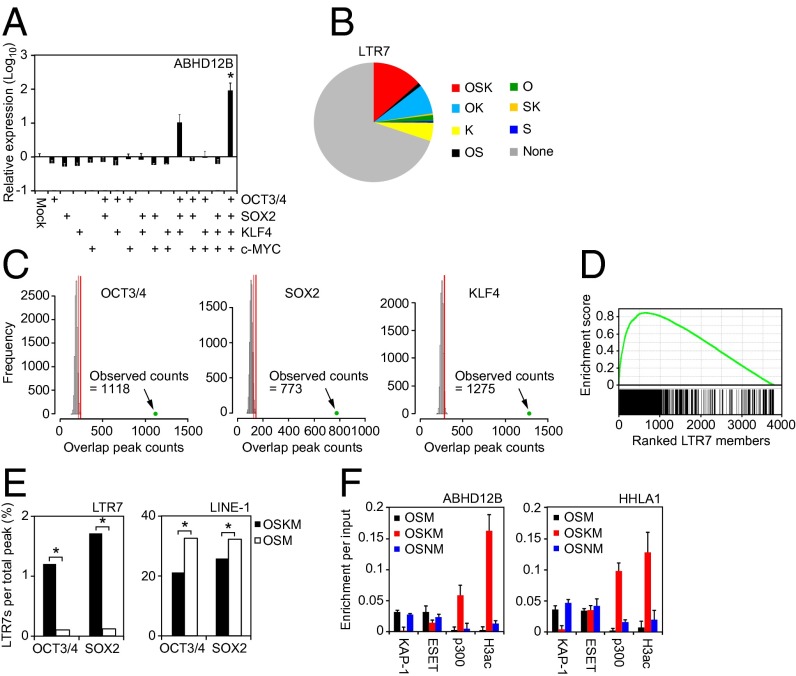
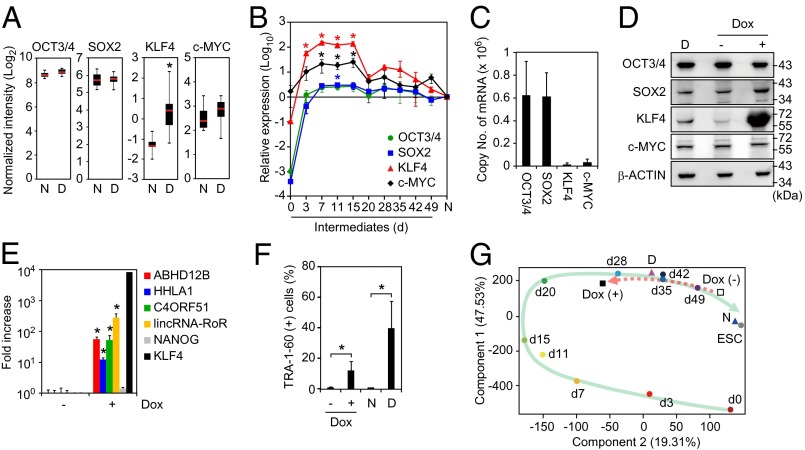
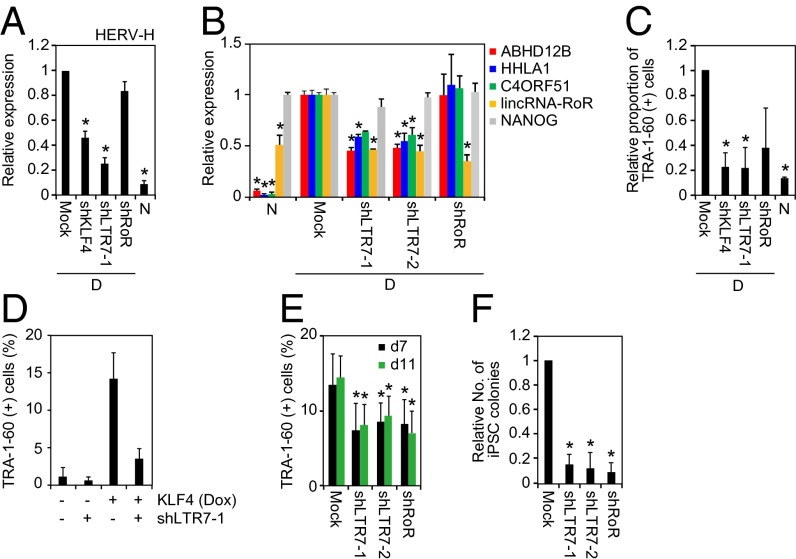
Pluripotency can be induced in somatic cells by overexpressing transcription factors, including POU class 5 homeobox 1 (OCT3/4), sex determining region Y-box 2 (SOX2), Krüppel-like factor 4 (KLF4), and myelocytomatosis oncogene (c-MYC). However, some induced pluripotent stem cells (iPSCs) exhibit defective differentiation and inappropriate maintenance of pluripotency features. Here we show that dynamic regulation of human endogenous retroviruses (HERVs) is important in the reprogramming process toward iPSCs, and in re-establishment of differentiation potential. During reprogramming, OCT3/4, SOX2, and KLF4 transiently hyperactivated LTR7s--the long-terminal repeats of HERV type-H (HERV-H)--to levels much higher than in embryonic stem cells by direct occupation of LTR7 sites genome-wide. Knocking down LTR7s or long intergenic non-protein coding RNA, regulator of reprogramming (lincRNA-RoR), a HERV-H-driven long noncoding RNA, early in reprogramming markedly reduced the efficiency of iPSC generation. KLF4 and LTR7 expression decreased to levels comparable with embryonic stem cells once reprogramming was complete, but failure to resuppress KLF4 and LTR7s resulted in defective differentiation. We also observed defective differentiation and LTR7 activation when iPSCs had forced expression of KLF4. However, when aberrantly expressed KLF4 or LTR7s were suppressed in defective iPSCs, normal differentiation was restored. Thus, a major mechanism by which OCT3/4, SOX2, and KLF4 promote human iPSC generation and reestablish potential for differentiation is by dynamically regulating HERV-H LTR7s.

Keywords: epigenetics; evolution; retrotransposon.


Conflict of interest statement

Conflict of interest statement: S.Y. is a member without salary of the scientific advisory board of iPS Academia Japan.

Figures

Fig. 1.
Fig. 1.
Enrichment of LTR7s in subcloned DD-iPSCs. (A) Summary of single-cell subcloning. (B) Differentiation potential of primary subclones. Shown are the percentages of TRA-1-60 (+) cells 14 d after neural induction of each primary subclone analyzed by flow cytometry. Blue and yellow circles indicate normal and DD-iPSC subclones/parents, respectively. n = 3. Error bars are SDs. (C) Differentiation potential of secondary subclones. Shown are the percentages of TRA-1-60 (+) cells 14 d after neural induction of TIG108-4F3-PS2- and PS17-derived secondary subclones. Blue and yellow circles indicate normal and DD-iPSC subclones, respectively. n = 3. Error bars are SDs. (D) Differential expression of genes between normal and DD-iPSCs. MA plot comparing global gene expression in normal (n = 18) and DD (n = 37) primary subclones derived from four DD-iPSCs parental clones (TIG108-4F3, TIG118-4F1, 451F3, and TKCBV5-6). Red and colored dots indicate genes with significantly higher expression in DD-iPSCs (FC > 2, FDR < 0.05). (E) Correlation between DD-marker expression and the presence of LTR7 elements. GSEA plot showing enrichment of LTR7 elements in 144 DD-iPSC markers. DD-iPSC markers are displayed in order of their fold-changes between normal- (n = 18) and DD- (n = 37) iPSC subclones in expression levels determined by a microarray.
Fig. 2.
Fig. 2.
Resemblance of DD-iPSC and partially reprogrammed cells. (A) Principal component analysis of DD-iPSC marker genes. Comparison of expression of 144 DD-iPSC marker genes in HDFs (day 0, n = 4), intermediate reprogrammed cells derived from HDFs induced by OSKM [EGFP (+) cells on day 3 and TRA-1-60 (+) cells on d7-49, n = 3–4 in each time point], ESCs (n = 4), and normal (N, n = 18) and DD (D, n = 37)-iPSC subclones. The green arrow indicates the route of reprogramming. (B) Distribution of DD-iPSC marker gene expression. The box plot shows expression of 144 DD-iPSC marker genes in microarray data and their distribution in intermediate reprogrammed cells [EGFP (+) cells on day 3 and TRA-1-60 (+) cells on days 7–49], normal iPSCs, ESCs, and ESC/normal iPSC-derived differentiated progenies such as EN, ME, and NE, and PSMN. Red and black boxes indicate the median and quartile, respectively. Post hoc pairwise comparisons were performed by Tukey’s test (*P < 0.01 vs. day 0). (C) Transcription of DD-iPSC markers from LTR7 during reprogramming. Expression of ABHD12B, HHLA1, C4ORF51, lincRNA-RoR, and ACTB in HDFs (day 0), intermediate reprogrammed cells [EGFP (+) cells on day 3 and TRA-1-60 (+) cells on days 7–49] and iPSCs were revealed by RNA-seq. Red arrowheads indicate the LTR7 position and direction in each locus. (D) All TRA-1-60 (+) cells transiently express DD-iPSC markers. Ct values plotted by single-cell qRT-PCR for ABHD12B, HHLA1, C4ORF51, and ACTB in intermediate reprogrammed cells (days 0–28 in the x axis) and ESCs. At least 42 single cells were analyzed for each sample. Red dots indicate median values. Gray hourglass shapes represent the distribution of Ct value. Ct 30 indicates undetectable expression, which was indicated by Ct values >26. (E) Epigenetic statuses of LTR7s in TRA-1-60 (+) cells. The percentages of CpG methylation (Left) and H3K4me3 statuses (Right) in LTR7s on each locus including ABHD12B, HHLA1, and C4ORF51 revealed by bisulfite conversion/pyrosequencing and ChIP-qPCR, respectively. Day 0, HDFs (n = 3); day 20, TRA-1-60 (+) cells (n = 3); N, normal iPSCs (n = 3); D, DD-iPSCs (n = 3). Error bars are SD. *P < 0.05 vs. N was calculated by t test. (F) Neural differentiation-defective phenotype of TRA-1-60 (+) cells during reprogramming. Proportions of TRA-1-60 (+) cells after SFEBq neural inducing culture for 14 d. n = 3. Error bars are SDs.
Fig. 3.
Fig. 3.
Transient hyperactivation of LTR7s during iPSC generation. (A) Transition of total LTR7 transcription level during reprogramming. The plot shows the relative expression of total HERV-H in intermediate reprogrammed cells [EGFP (+) cells on day 3 and TRA-1-60 (+) cells on days 7–49] and normal iPSCs (N) compared with HDFs (day 0) revealed by qRT-PCR. Each value was normalized to that of G3PDH. n = 3. Error bars are SD. *P < 0.05 vs. HDF was calculated by Dunnett test. (B) Abundant HERV-H expression in TRA-1-60 (+) intermediates. Shown are relative expression of HERV-H in HDFs, TRA-1-60 (−) or (+) cells on day 7 and normal iPSCs analyzed by qRT-PCR. Each value was normalized to that of G3PDH. n = 3. Error bars are SD. *P < 0.05 was calculated by t test. (C) Expression patterns of the LTR7 family during reprogramming. Data are shown as LTR7 members and LINE-1 reads per kilobase of exon per million mapped reads (RPKM) in HDFs, TRA-1-60 (+) cells on day 20, and ESCs/normal iPSCs (n = 8). (D) Distribution of CpG methylation during reprogramming. The box plots show the distribution of methylation level at CpGs on all probes (Left), LTR7 (Center), and LINE-1 (Right) regions with overhang sequences (250 bp) in HDFs (day 0), intermediate reprogrammed cells [EGFP (+) cells on d3 and TRA-1-60 (+) cells on days 7–49], ESCs, and normal iPSCs. Red and black bars indicate the median and quartile, respectively. n = 3. Post hoc pairwise comparisons were performed by Tukey’s test (*P < 0.01).
Fig. 4.
Fig. 4.
Role of OSK in LTR7 activation. (A) OSK is required for activation of ABHD12B expression. Relative expression level of ABHD12B on day 7 posttransduction for all combinations of OSKM. Error bars are SDs. n = 3. *P < 0.05 vs. Mock was calculated by Dunnett test. (B) Distribution of reprogramming factor occupancy on all LTR7s loci revealed by ChIP-seq. (C) Significance of the interaction of reprogramming factors to LTR7s. Histograms show counts of peaks for OCT3/4, SOX2, or KLF4 overlapped with randomly selected regions (10,000 random trials). The 95th percentile count of distribution is marked by red lines. Green dots show counts of ChIP-seq peaks on LTR7 regions with overhang sequences (250 bp). (D) GSEA plot showing enrichment of OSK occupancies in expressed LTR7s. Expressed LTR7 family members in TRA-1-60 (+) cells on day 15 are enriched in the set of LTR7s that show full-array OSK binding (P = 2.4e-155). (E) KLF4-dependent binding of OCT3/4 and SOX2 to LTR7s. Bars show the percentage of OCT3/4- or SOX2-bound LTR7 family members and LINE-1 in HDFs transduced with OSKM (closed) or OSM (open) on day 3 posttransduction. χ2 tests were performed between the proportions (*P < 0.05). (F) Interaction between HERV-H loci and chromatin modifiers. ChIP assays were performed to analyze the interaction of ABHD12B and HHLA1 loci with KAP-1, ESET, p300, and pan-acetyl histone H3 (H3ac) occupancy in HDFs transduced with OSM, OSKM, or OSNM on day 3 were analyzed by ChIP-qPCR. n = 3. Error bars are SD.
Fig. 5.
Fig. 5.
Role of KLF4 in the DD phenotype. (A) High expression of KLF4 in DD-iPSCs. Expression levels of total OCT3/4, SOX2, KLF4, and c-MYC in normal- (N; n = 18) and DD- (D; n = 37) iPSC primary subclones in microarray analysis. *FDR < 0.05 vs. N was calculated by t test. (B) Relative expression of total OSKM in intermediate reprogrammed cells were quantified by qRT-PCR and compared with those in iPSC. Each value was normalized to that of G3PDH. n = 3. Error bars are SDs. *P < 0.05 vs. iPSC (N) was calculated by Dunnett test. (C) Copy number of OSKM mRNAs in iPSCs. Data are shown as copy numbers of mRNA per 50 ng of total RNA calculated using a plasmid encoding each factor as a standard in qRT-PCR. n = 23. Error bars are SDs. (D) Expression of KLF4 protein. Western blot analyses of expression of OCT3/4, SOX2, KLF4, c-MYC, and β-ACTIN proteins in DD-iPSCs (D) and normal iPSCs (N) transduced with Dox-inducible KLF4 maintained with (+) or without (−) Dox. (E) KLF4 induces DD-iPSC marker expression in iPSCs. Bars show the relative expression levels of ABHD12B, HHLA1, C4ORF51, lincRNA-RoR, NANOG, and KLF4 in KLF4-overexpressing iPSCs analyzed by qRT-PCR. Each value was normalized to that of G3PDH. n = 3. Error bars are SDs. *P < 0.05 vs. Dox (−) were calculated by t test. (F) KLF4 prevents neural differentiation. Normal iPSCs transduced with Dox-inducible KLF4 were differentiated into neural cells using the SFEBq method with (+) or without (−) Dox. Bars show the percentages of TRA-1-60 (+) cells after a SFEBq neural inducing culture for 14 d. N and D represent normal and DD-iPSCs, respectively. n = 3. Error bars are SDs. *P < 0.05 was calculated by t test. (G) KLF4 changes the fate of iPSCs. PCA of microarray data from HDFs (day 0), TRA-1-60 (+) intermediate reprogrammed cells, normal iPSC subclones (N), DD-iPSC subclones (D), and Dox-inducible KLF4-transduced iPSCs with (+) or without (−) Dox for the 144 DD-iPSC marker genes. The green arrow indicates the route of reprogramming. The red broken arrow indicates the fate transition after induction of the KLF4 transgene.
Fig. 6.
Fig. 6.
Loss of function experiments to test roles of KLF4 and LTR7s in reprogramming and the DD phenotype. (A) KLF4 is responsible for HERV-H expression. Shown are relative expressions of HERV-H in DD-iPSCs (D) transduced with KLF4 shRNA (shKLF4), LTR7 shRNA-1 (shLTR7-1), or shRoR, and normal iPSCs (N) compared with those of Mock-transduced DD-iPSCs. Each value was normalized to that of G3PDH. n = 3. Error bars are SDs. n = 3. *P < 0.05 vs. Mock was calculated by Dunnett test. (B) Knockdown of LTR7 expression. Bars show relative expression of ABHD12B, HHLA1, C4ORF51, lincRNA-RoR, and NANOG in normal iPSCs (N) and DD-iPSCs (D) transduced with empty vector (Mock), LTR7 shRNA-encoding vectors (shLTR7-1 and -2), or shRoR compared with Mock analyzed by microarray. Error bars are SDs. N =2. *P < 0.05 vs. Mock was calculated by Dunnett test. (C) Suppression of KLF4/HERV-H LTR7 rescues the DD phenotype. Shown are the relative proportions of residual TRA-1-60 (+) cells on day 14 after neural differentiation of DD-iPSCs (D) carrying empty vector (Mock), LTR7 shRNAs (shLTR7-1), or shRoR, compared with normal iPSCs (N). n = 3. *P < 0.05 vs. Mock was calculated by Dunnett test. (D) Suppression of LTR7 rescues the KLF4-induced DD phenotype. Shown are the percentages of residual TRA-1-60 (+) cells on day 14 after neural differentiation of normal iPSCs carrying dox-inducible KLF4, and empty vector or LTR7 shRNA (shLTR7-1). Differentiation was performed in the presence (+) or absence (−) of Dox. Error bars are SDs. n = 2. (E) LTR7 activity enhances reprogramming efficiency. Shown are the percentages of TRA-1-60 (+) cells on days 7 (black) and 11 (green) posttransduction of OSKM with empty vector (Mock), LTR7 shRNA-encoding vectors (shLTR7-1 and -2), or shRoR vector. n = 3. Error bars are SDs. *P < 0.05 vs. Mock was calculated by Dunnett test. (F) LTR7 activity facilitates iPSC generation. Shown are the relative numbers of iPSC colonies on day 25 posttransduction of OSKM with empty vector (Mock), LTR7 shRNA-encoding vectors (shLTR7-1 and -2), or shRoR vector. Error bars are SDs. n = 4. *P < 0.05 vs. Mock was calculated by Dunnett test.

References

    1. Thomson JA, et al. Embryonic stem cell lines derived from human blastocysts. Science. 1998;282(5391):1145–1147. - PubMed
    1. Takahashi K, et al. Induction of pluripotent stem cells from adult human fibroblasts by defined factors. Cell. 2007;131(5):861–872. - PubMed
    1. Koyanagi-Aoi M, et al. Differentiation-defective phenotypes revealed by large-scale analyses of human pluripotent stem cells. Proc Natl Acad Sci USA. 2013;110(51):20569–20574. - PMC - PubMed
    1. Lander ES, et al. International Human Genome Sequencing Consortium Initial sequencing and analysis of the human genome. Nature. 2001;409(6822):860–921. - PubMed
    1. Santoni FA, Guerra J, Luban J. HERV-H RNA is abundant in human embryonic stem cells and a precise marker for pluripotency. Retrovirology. 2012;9:111. - PMC - PubMed

Publication types

MeSH terms

Associated data