

Critical comparison of sample preparation strategies for shotgun proteomic analysis of formalin-fixed, paraffin-embedded samples: insights from liver tissue
- PMID: 25097466
- PMCID: PMC4115481
- DOI: 10.1186/1559-0275-11-28
Critical comparison of sample preparation strategies for shotgun proteomic analysis of formalin-fixed, paraffin-embedded samples: insights from liver tissue
Abstract
Background: The growing field of formalin-fixed paraffin-embedded (FFPE) tissue proteomics holds promise for improving translational research. Direct tissue trypsinization (DT) and protein extraction followed by in solution digestion (ISD) or filter-aided sample preparation (FASP) are the most common workflows for shotgun analysis of FFPE samples, but a critical comparison of the different methods is currently lacking.
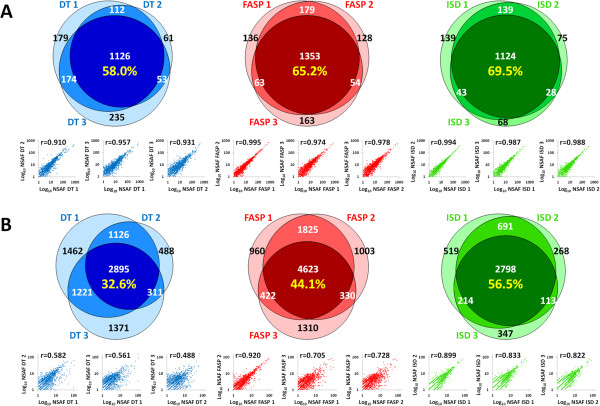
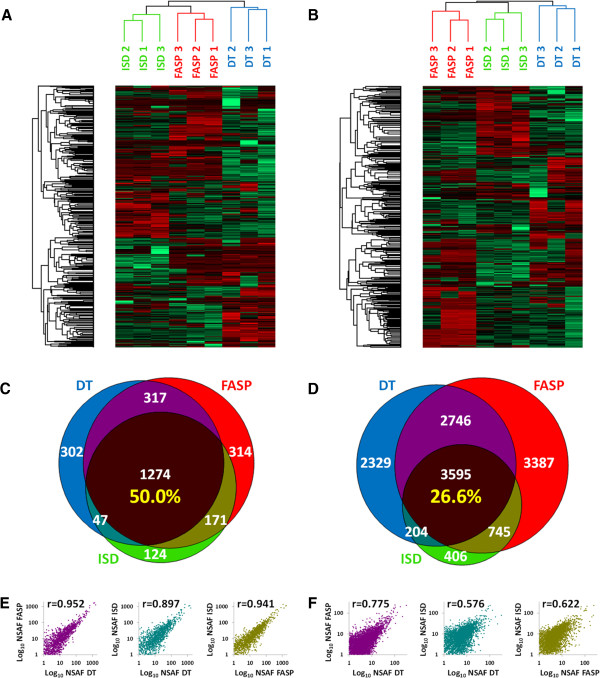
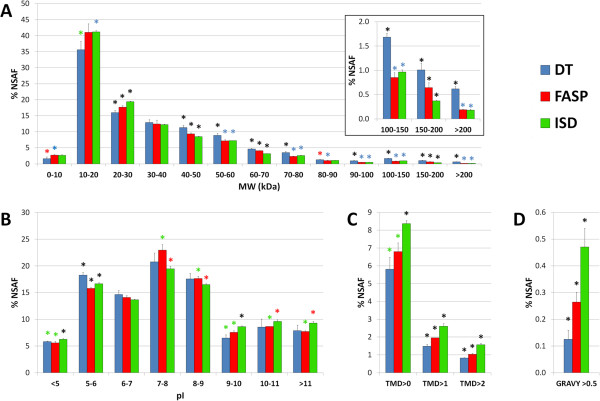
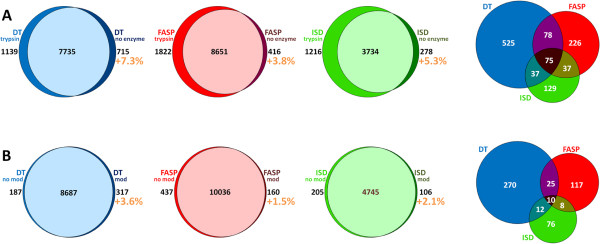
Experimental design: DT, FASP and ISD workflows were compared by subjecting to the same label-free quantitative approach three independent technical replicates of each method applied to FFPE liver tissue. Data were evaluated in terms of method reproducibility and protein/peptide distribution according to localization, MW, pI and hydrophobicity.
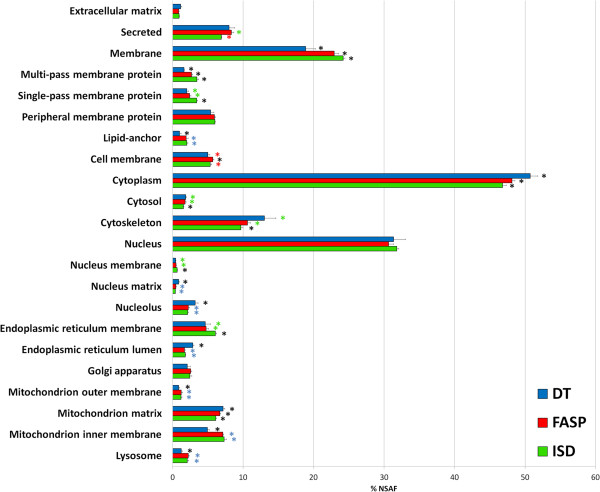
Results: DT showed lower reproducibility, good preservation of high-MW proteins, a general bias towards hydrophilic and acidic proteins, much lower keratin contamination, as well as higher abundance of non-tryptic peptides. Conversely, FASP and ISD proteomes were depleted in high-MW proteins and enriched in hydrophobic and membrane proteins; FASP provided higher identification yields, while ISD exhibited higher reproducibility.
Conclusions: These results highlight that diverse sample preparation strategies provide significantly different proteomic information, and present typical biases that should be taken into account when dealing with FFPE samples. When a sufficient amount of tissue is available, the complementary use of different methods is suggested to increase proteome coverage and depth.
Keywords: Archival tissues; FASP; FFPE; LC-MS/MS; Protein extraction.
Figures
References
-
- Nirmalan N, Banks R, Van Eyk JE. Proteomic analysis of formalin fixed tissue. Proteomics Clin Appl. 2013;11:215–216. - PubMed
-
- Blonder J, Veenstra TD. Clinical proteomic applications of formalin-fixed paraffin-embedded tissues. Clin Lab Med. 2009;11:101–113. - PubMed
-
- Tanca A, Pagnozzi D, Addis MF. Setting proteins free: Progresses and achievements in proteomics of formalin-fixed, paraffin-embedded tissues. Proteomics Clin Appl. 2012;11:7–21. - PubMed
-
- Addis MF, Tanca A, Pagnozzi D, Rocca S, Uzzau S. 2-D PAGE and MS analysis of proteins from formalin-fixed, paraffin-embedded tissues. Proteomics. 2009;11:4329–4339. - PubMed
-
- Tanca A, Pagnozzi D, Burrai GP, Polinas M, Uzzau S, Antuofermo E, Addis MF. Comparability of differential proteomics data generated from paired archival fresh-frozen and formalin-fixed samples by GeLC-MS/MS and spectral counting. J Proteomics. 2012;11:561–576. - PubMed
LinkOut - more resources
Full Text Sources
Other Literature Sources
Research Materials
Miscellaneous