

Examination of effects of corticosteroids on skeletal muscles of boys with DMD using MRI and MRS
- PMID: 25098537
- PMCID: PMC4162304
- DOI: 10.1212/WNL.0000000000000775
Examination of effects of corticosteroids on skeletal muscles of boys with DMD using MRI and MRS
Abstract
Objective: To evaluate the effects of corticosteroids on the lower extremity muscles in boys with Duchenne muscular dystrophy (DMD) using MRI and magnetic resonance spectroscopy (MRS).
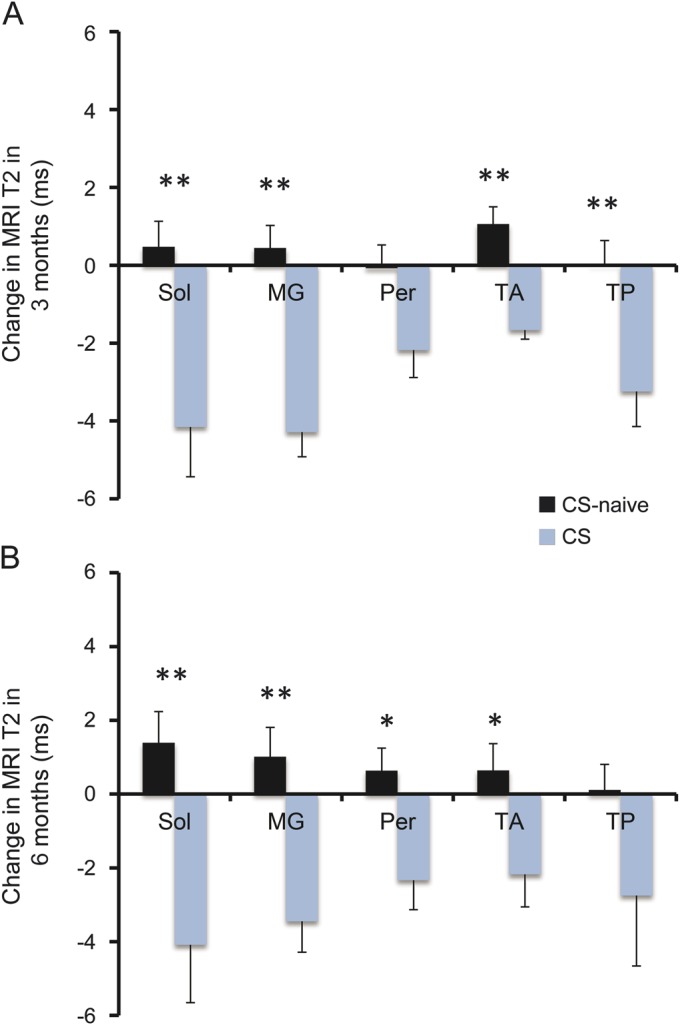
Methods: Transverse relaxation time (T2) and fat fraction were measured by MRI/MRS in lower extremity muscles of 15 boys with DMD (age 5.0-6.9 years) taking corticosteroids and 15 corticosteroid-naive boys. Subsequently, fat fraction was measured in a subset of these boys at 1 year. Finally, MRI/MRS data were collected from 16 corticosteroid-naive boys with DMD (age 5-8.9 years) at baseline, 3 months, and 6 months. Five boys were treated with corticosteroids after baseline and the remaining 11 served as corticosteroid-naive controls.
Results: Cross-sectional comparisons demonstrated lower muscle T2 and less intramuscular (IM) fat deposition in boys with DMD on corticosteroids, suggesting reduced inflammation/damage and fat infiltration with treatment. Boys on corticosteroids demonstrated less increase in IM fat infiltration at 1 year. Finally, T2 by MRI/MRS detected effects of corticosteroids on leg muscles as early as 3 months after drug initiation.
Conclusions: These results demonstrate the ability of MRI/MRS to detect therapeutic effects of corticosteroids in reducing inflammatory processes in skeletal muscles of boys with DMD. Our work highlights the potential of MRI/MRS as a biomarker in evaluating therapeutic interventions in DMD.
© 2014 American Academy of Neurology.
Figures


Comment in
-
Quantitative MRI in muscular dystrophy: An indispensable trial endpoint?Neurology. 2014 Sep 9;83(11):956-7. doi: 10.1212/WNL.0000000000000785. Epub 2014 Aug 6. Neurology. 2014. PMID: 25098536 No abstract available.
References
-
- Hoffman EP, Brown RH, Jr, Kunkel LM. Dystrophin: the protein product of the Duchenne muscular dystrophy locus. Cell 1987;51:919–928 - PubMed
-
- Bushby K, Finkel R, Birnkrant DJ, et al. Diagnosis and management of Duchenne muscular dystrophy, part 1: diagnosis, and pharmacological and psychosocial management. Lancet Neurol 2010;9:77–93 - PubMed
-
- Mendell JR, Moxley RT, Griggs RC, et al. Randomized, double-blind six-month trial of prednisone in Duchenne’s muscular dystrophy. N Engl J Med 1989;320:1592–1597 - PubMed
-
- Griggs RC, Moxley RT, III, Mendell JR, et al. Prednisone in Duchenne dystrophy: a randomized, controlled trial defining the time course and dose response: Clinical Investigation of Duchenne Dystrophy Group. Arch Neurol 1991;48:383–388 - PubMed
Publication types
MeSH terms
Substances
Grants and funding
LinkOut - more resources
Full Text Sources
Other Literature Sources
Medical