. 2014 Aug 6:5:4593.
doi: 10.1038/ncomms5593.

Alarmin S100A8/S100A9 as a biomarker for molecular imaging of local inflammatory activity

Affiliations

Alarmin S100A8/S100A9 as a biomarker for molecular imaging of local inflammatory activity

Thomas Vogl et al. Nat Commun. .

Abstract

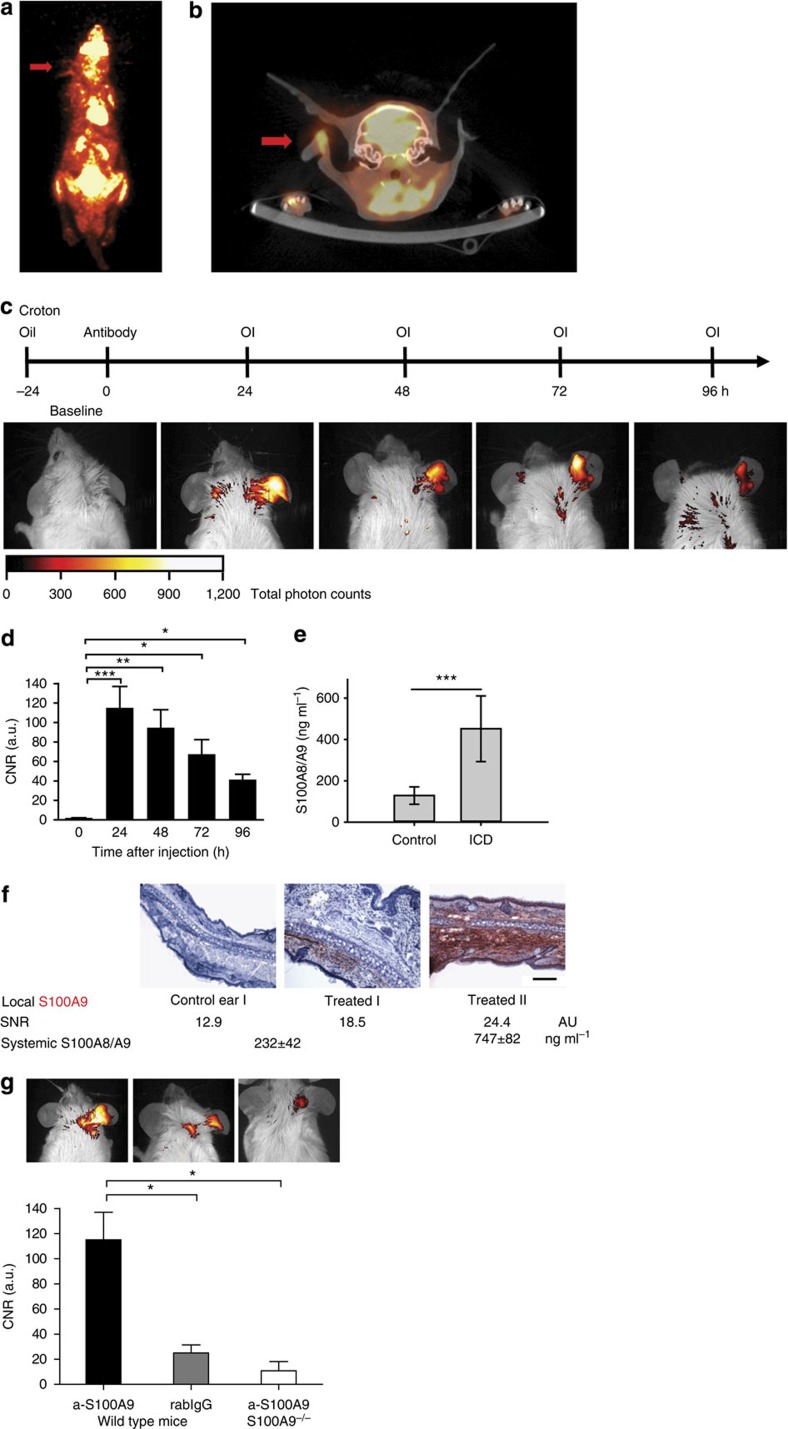
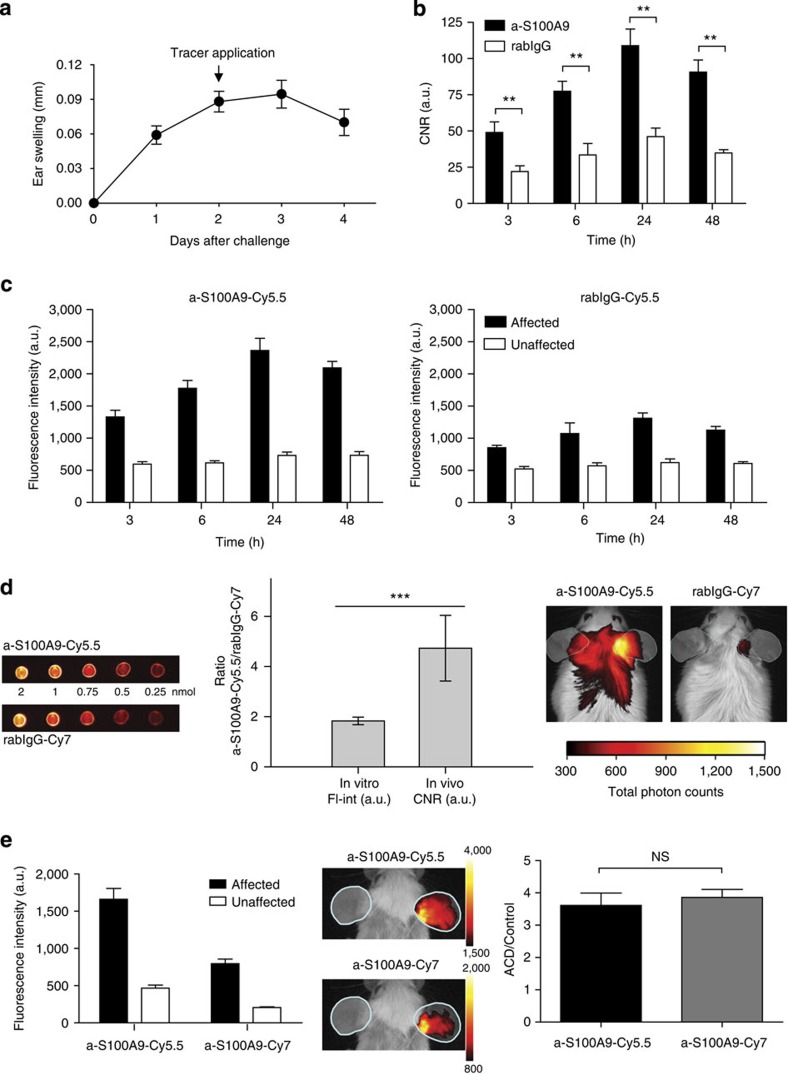
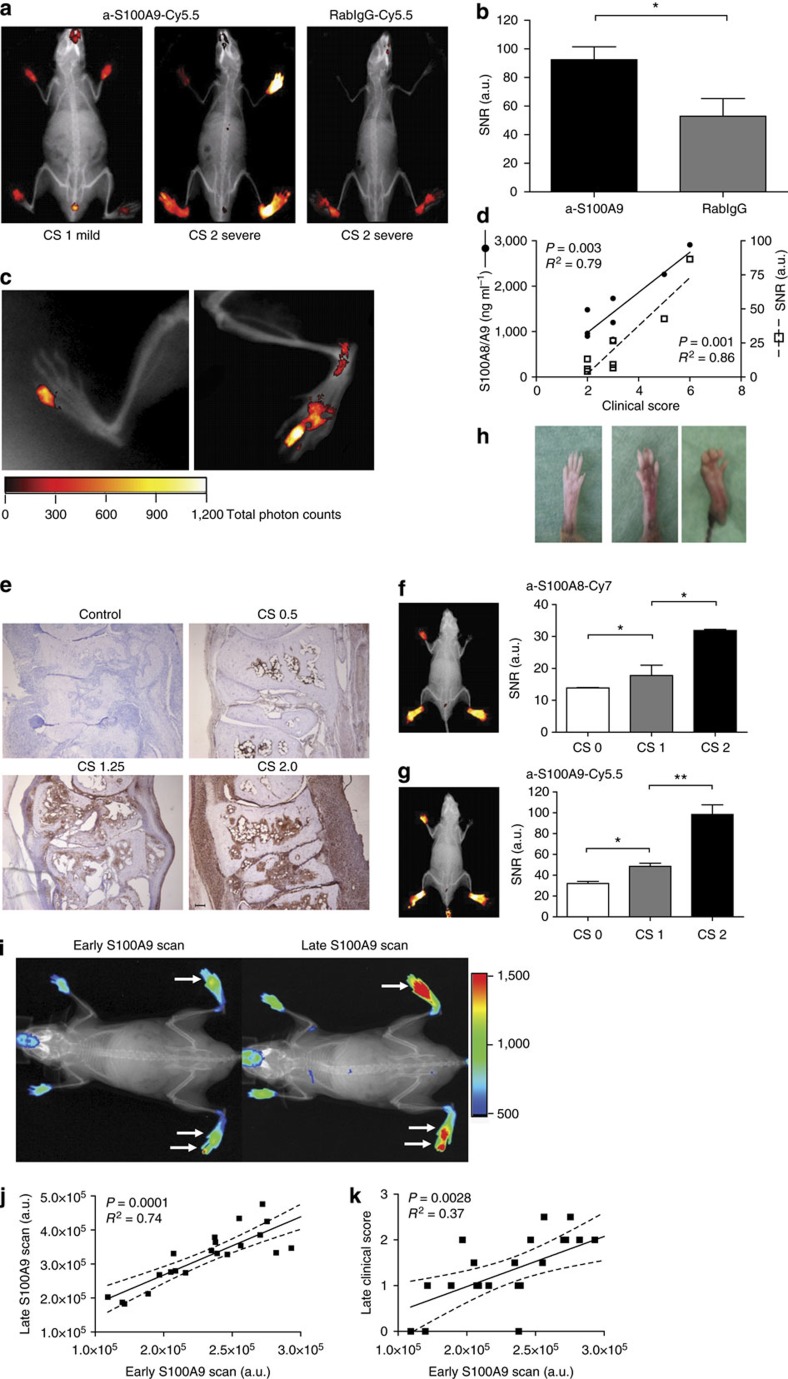
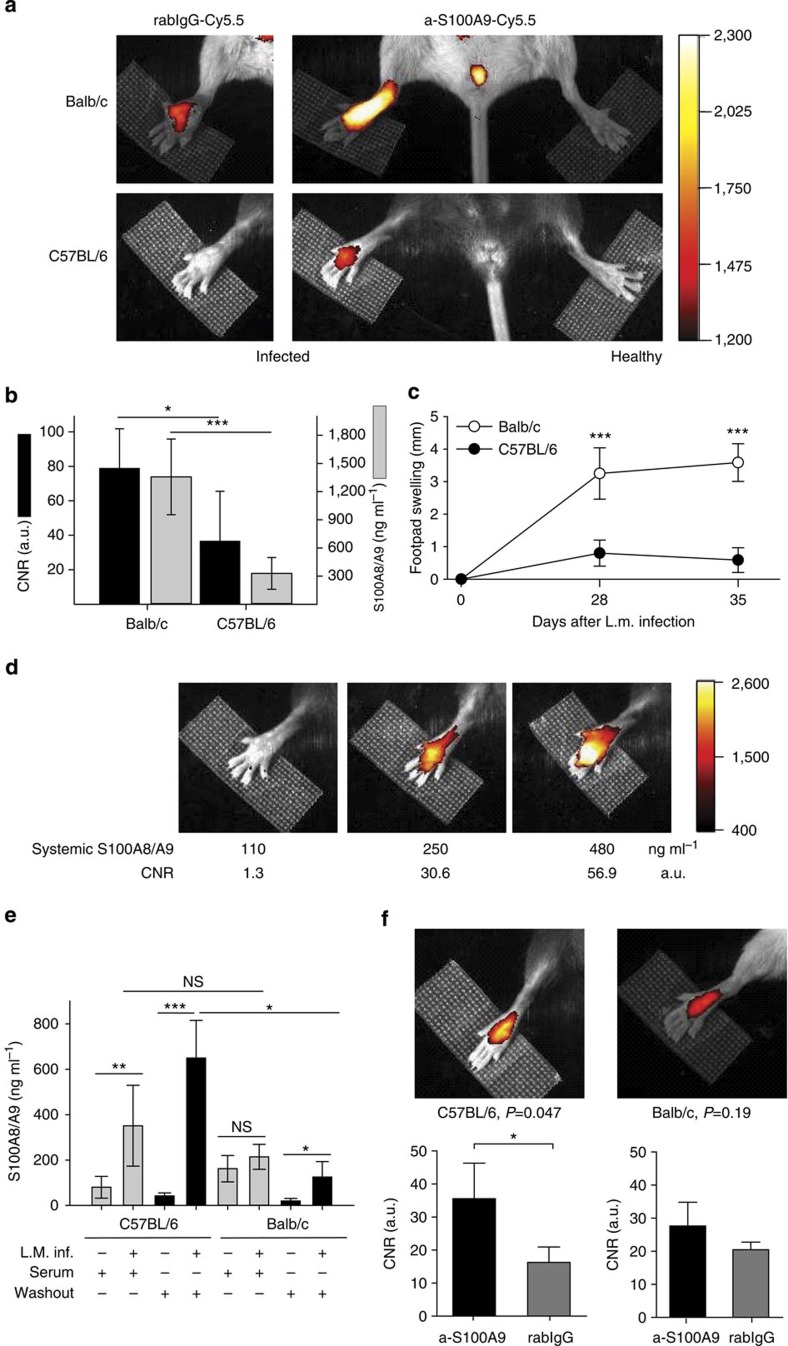
Inflammation has a key role in the pathogenesis of various human diseases. The early detection, localization and monitoring of inflammation are crucial for tailoring individual therapies. However, reliable biomarkers to detect local inflammatory activities and to predict disease outcome are still missing. Alarmins, which are locally released during cellular stress, are early amplifiers of inflammation. Here, using optical molecular imaging, we demonstrate that the alarmin S100A8/S100A9 serves as a sensitive local and systemic marker for the detection of even sub-clinical disease activity in inflammatory and immunological processes like irritative and allergic contact dermatitis. In a model of collagen-induced arthritis, we use S100A8/S100A9 imaging to predict the development of disease activity. Furthermore, S100A8/S100A9 can act as a very early and sensitive biomarker in experimental leishmaniasis for phagocyte activation linked to an effective Th1-response. In conclusion, the alarmin S100A8/S100A9 is a valuable and sensitive molecular target for novel imaging approaches to monitor clinically relevant inflammatory disorders on a molecular level.


Figures

Figure 1
Figure 1. In vivo fluorescence reflectance imaging of mice during ICD.
(a) 18F-FDG-PET image and the fused PET/CT (axial CT slice) (b) of ICD in mice treated with croton oil on the right ear. The area of inflammation (red arrows) can be depicted in the maximum intensity PET image (a, whole body) with the axial CT slice showing the swelling of the inflamed tissue and the local uptake of FDG (ratio inflamed ear versus healthy ear=4.8; b). (c) After the application of a-S100A9-Cy5.5 to Balb/c mice 24 h after elicitation of ICD, optical imaging (OI) was performed at the time points indicated. Strong fluorescence intensities were detected only at sites of inflammation for up to 96 h. (d) Quantification of CNR shows significant changes in the affected ears over the observed time period from 24 to 96 h (baseline=time point 0). Data are from three independent experiments (each n=5, mean±s.d., *P<0.05, **P<0.01, ***P<0.001; P values calculated using Student’s t-test). (e) S100A8/S100A9 serum concentrations 48 h after croton oil application. Data are from five mice per group (mean±s.d., ***P<0.001; Student’s t-test). (f) Cryosections of treated and control ears were stained for S100A9-expression. The figure shows representative ear sections of an untreated control ear (left) and treated ears with moderately (middle) and strongly (right) elevated SNR including the corresponding systemic S100A8/S100A9 level. Scale bar, 100 μm. (g) Application of a-S100A9-Cy5.5 or rabIgG-Cy5.5 to WT or S100A9−/− mice 24 h after the elicitation of ICD confirmed the specificity of optical imaging for S100A9 expression in vivo. Data are from five mice per group (mean±s.d., *P<0.05; P-values calculated using one-way analysis of variance with Bonferroni’s post test). a.u., arbitrary units.
Figure 2
Figure 2. Monitoring of S100A9 expression during ACD by fluorescence reflectance imaging (FRI) in vivo.
(a) ACD was induced in mice and disease progression was assessed by the increase in ear swelling. (b) FRI was performed at different time points after the application of either a-S100A9-Cy5.5 or rabIgG-Cy5.5, as indicated in the figure. The optimal time point for optical imaging was found to be 24 h after tracer application. (c) Fluorescence intensities of the specific (left image) versus unspecific tracer (right image) of affected (black bars) versus unaffected (white bars) ears allowed for the estimation of Fcγ receptor contribution to total FRI signals. (d) Comparison of the ratios of equal amounts of a-S100A9-Cy5.5 and rabIgG-Cy7 in vitro (FL-int=fluorescence intensities, left side) versus in vivo (CNR, right side). ACD was induced in mice and 2 nmol of Cy5.5-labelled anti-S100A9 and Cy7-labelled rabIgG were injected simultaneously. Optical imaging was performed 24 h after antibody injection and the region of interest (ROI) of data acquisition was labelled in cyan. Data are from five mice per group (two independent experiments each, mean±s.d.) *P<0.05, **P<0.01, ***P<0.001; Student’s t-test. (e) Comparison of the ratios of equal amounts of a-S100A9-Cy5.5 and a-S100A9-Cy7 during ACD. ACD was induced in mice and 2 nmol of Cy5.5- and Cy7-labelled anti-S100A9 each was injected simultaneously. Optical imaging was performed at 24 h after antibody injection and the ROI of data acquisition was labelled in cyan (data are from five mice, mean±s.d. according to Student’s t-test). a.u., arbitrary units; NS, not significant.
Figure 3
Figure 3. Detection of single inflamed joints in collagen-induced arthritis by optical imaging.
(a) CIA was induced in DBA/jdba1/j mice and optical imaging was recorded by FRI using a-S100A9-Cy5.5 or rabIgG-Cy5.5 at day 28. Individual feet were analysed and compared with clinical scores described in the Method section (n=5 mice per group, three independent experiments). (b) Comparison of imaging data of a-S100A9-Cy5.5 and rabIgG-Cy5.5 from mice feet with CS2 confirms the specificity of our findings (mean±s.d., *P<0.05, Student’s t-test, n=5 mice per group, three independent experiments). (c) Enlarged view of only subclinical inflammation of single joints. (d) Correlation of imaging data and systemic S100A8/S100A9 levels of mice with clinical disease severity. Scoring of single feet were added up (maximum score 8 per mouse) and imaging data were calculated as mean values over all four feet. (e) S100A9 immunostaining of paw sections with CS of 0.5, 1.25 and 2 and control at day 28 confirmed correlation of local S100A8/S100A9 expression and severity of inflammation. Scale bar, 100 μm. (f,g) Simultaneous injection of a-S100A8-Cy7 (f) and a-S100A9-Cy5.5 (g) shows an almost identical distribution pattern in FRI. (h) Upper panel, representative pictures of paws for the different clinical scores. Lower panels, correlation of clinical scores with SNR for Cy7-labelled anti-S100A8 and Cy5.5-labelled anti-S100A9 (n=5 mice, mean±s.d., *P<0.05, **P<0.01; one-way analysis of variance with Bonferroni’s post test). (i) CIA was induced in C57BL/6 mice and a-S100A9-Cy5.5-driven FRI was performed at the first signs of arthritis (early time point) and for a second time where disease progression had occurred (late time point, 2 nmol of dye per mouse). All paws were analysed separately and compared with the clinical scoring as described in (a, n=6 mice). Representative images of an early (left image) versus late (right image) S100A9 scan are shown. White arrows indicate inflamed areas. Correlation of optical imaging data of early versus late time point (j) and early time point versus late clinical score (k). To correct for the variable areas of fore- and hind-paws, fluorescence intensities were normalized for the ROI size. Two fore-paws of one mouse were excluded from the analysis because of an incorrect position in the scanner (j,k). a.u., arbitrary units.
Figure 4
Figure 4. Mouse strain-specific responses during L. major infection monitored by S100A9 imaging in vivo.
(a) Right hind legs of C57BL/6 mice and Balb/c mice (three independent experiments, each five mice per group) were infected with L. major, whereas the left hind legs served as controls. FRI was monitored during the late phase of infection at day 28 after receiving either a-S100A9-Cy5.5 or rabIgG-Cy5.5 (2 nmol of dye per mouse) 24 h earlier. (b) CNR was calculated for both mouse strains at day 28 after L. major infection. Significant strain-specific differences were found for both local (CNR) and systemic (S100A8/S100A9) parameters (three independent experiments, each five mice per group, mean±s.d., *P<0.05, ***P<0.001; Mann–Whitney U-test). (c) Footpad swelling of infected C57BL/6 mice and Balb/c mice at day 28 and 35 in relation to non-infected contralateral foot pads (mean±s.d., n=5 for each mouse strain, ***P<0.001; t-test) demonstrates the different outcome in both mouse strains. (d) Individual comparison of representative optical imaging data (CNR) of infected C57BL/6 mice at day 28 after infection shows fairly good accordance, suggesting that systemic S100A8/S100A9 levels resemble disease activities. (e) During early L. major infection (day 4), sera (grey bars) and footpad washouts (black bars) of infected and non-infected mice were collected and analysed for S100A8/S100A9 by ELISA. Systemic and local S100A8/S100A9 levels were already significantly increased in infected C57BL/6 mice as compared with controls. In Balb/c mice, only a minor, nonsignificant increase in local S100A8/S100A9 expression was observed. Data are from fvie mice per group (mean±s.d., *P<0.05, **P<0.01, ***P<0.001 and NS, not significant; Mann–Whitney U-test). (f) At day 4 already, local upregulation of S100A9 expression could be monitored in resistant C57BL/6 mice by optical imaging (P=0.047 by t-test) reflecting phagocyte activation. This was not detectable in susceptible Balb/c mice (P=0.19). Data are from five mice per group. a.u., arbitrary units.

References

    1. Chan A. C. & Behrens T. W. Personalizing medicine for autoimmune and inflammatory diseases. Nat. Immunol. 14, 106–109 (2013). - PubMed
    1. Gotthardt M., Bleeker-Rovers C. P., Boerman O. C. & Oyen W. J. Imaging of inflammation by PET, conventional scintigraphy, and other imaging techniques. J. Nucl. Med. 51, 1937–1949 (2010). - PubMed
    1. Chan J. K. et al. Alarmins: awaiting a clinical response. J. Clin. Invest. 122, 2711–2719 (2012). - PMC - PubMed
    1. Harris H. E., Andersson U. & Pisetsky D. S. HMGB1: a multifunctional alarmin driving autoimmune and inflammatory disease. Nat. Rev. Rheumatol 8, 195–202 (2012). - PubMed
    1. Rock K. L., Latz E., Ontiveros F. & Kono H. The sterile inflammatory response. Annu. Rev. Immunol. 28, 321–342 (2010). - PMC - PubMed

Publication types

MeSH terms